

When people hear about the changing size of religious groups, many think of individuals converting to a new faith or leaving religion altogether. While that kind of switching does impact the size of religious groups, most of the change taking place globally is a result of demographic dynamics.
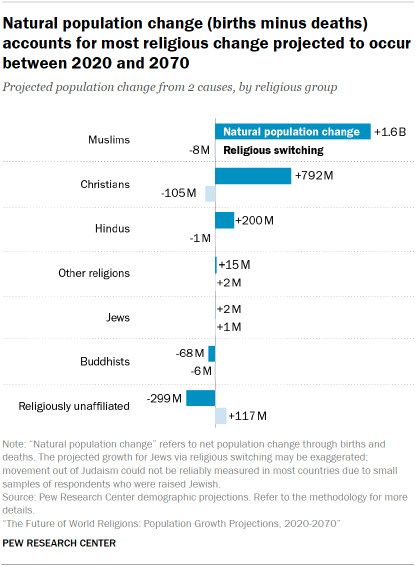
Fertility and mortality are powerful drivers of demographic change. Populations naturally grow when births outnumber deaths. This happens in young populations with high fertility. Conversely, populations that are older and have higher mortality will eventually shrink.
Looking at the world’s three largest religious categories:
- Muslims are projected to experience the most population growth between 2020 and 2070. Their young age profile and high fertility will cause a natural increase as Muslim births outnumber Muslim deaths by at least 1.6 billion over five decades.
- Christians, too, are projected to experience a natural increase, though at a smaller scale than Muslims. Christians’ growth will be tempered by people leaving (or “switching out” of) the faith.
- Many people around the world are projected to join the ranks of the religiously unaffiliated population between 2020 and 2070 as they leave the religions in which they were raised. But unaffiliated people, globally, have a relatively old age profile and low fertility, which will cause their numbers to decline in the coming decades.
Delve into how these five factors shape our projections for religious groups:
These findings are part of a broader Pew Research Center study examining how the size of seven religious groups will change globally between 2020 and 2070 if recent demographic trends continue. Our projections take into account the differences between religious groups’ age profiles, fertility rates, and patterns of religious switching and migration. (Religious switching and migration are assumed to continue at the same levels that have been recently observed.) We also incorporate mortality rates, applying the same rate to each religious group within a country. Read the methodology for more details about these projections and their limitations.
Age structure
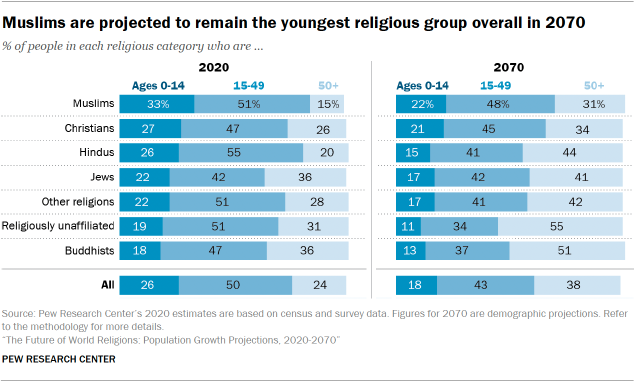
In the coming decades, the world’s population – viewed as a whole – is expected to grow older as fertility rates decline and people live longer. People ages 50 and older are projected to rise from 24% of the global population in 2020 to 38% in 2070. This gradual aging is expected to occur in all religious groups.
Muslims currently have the youngest age profile (or “age structure”) of the seven religious groups in this study. In 2020, a third of Muslims were under 15, compared with fewer than one-fifth of Buddhists and religiously unaffiliated people. Muslims’ relative youth is an advantage for growth, since a large portion of their population is in or near their prime childbearing years.
Muslims are projected to remain the youngest religious group in the coming decades. But their age structure will more closely mirror that of Christians by 2070, when people ages 50 and older are expected to make up similar shares of both groups (31% of Muslims and 34% of Christians).
Median age by religion and region in 2020
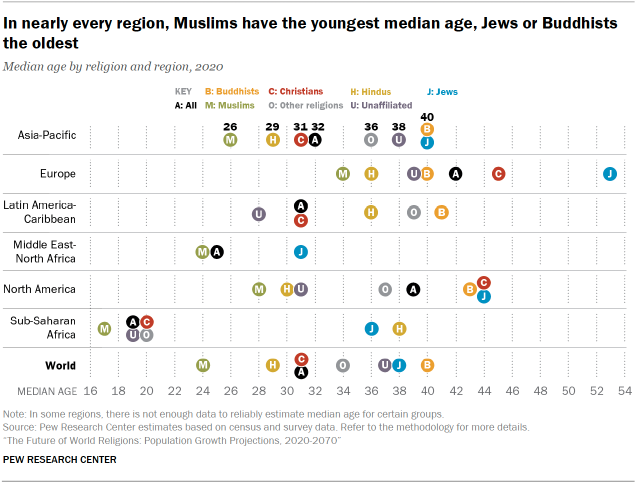
Many of the current age differences between religious groups reflect where they tend to live around the world.
Buddhists and religiously unaffiliated people – who have older age profiles – are heavily concentrated in East Asian countries such as China, where the median age of the whole population is 39, and Japan, where it is 49. By contrast, many Christians (about three-in-ten, as of 2020) live in sub-Saharan Africa, where the median age is 19. Sub-Saharan Africa also is home to about 18% of the world’s Muslims.
In addition, Muslims are typically the youngest religious group within each geographic region, while Jews and Buddhists are often among the oldest. For example, in Europe, Muslims had the lowest median age (34) in 2020, while Jews had the highest (53).
Fertility
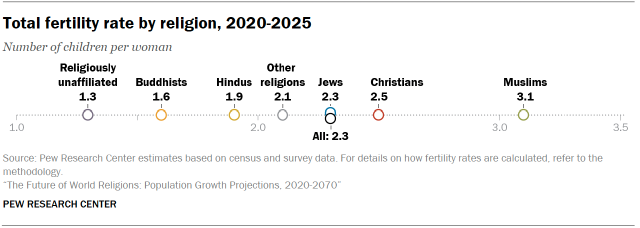
A population has greater potential for growth if it has both a young age structure and a high rate of childbirth. Throughout this study, we present total fertility rates – the average number of children a hypothetical woman would have in her lifetime if she experienced the birth rates that were estimated for women of reproductive age during a particular period, such as 2020 to 2025.15
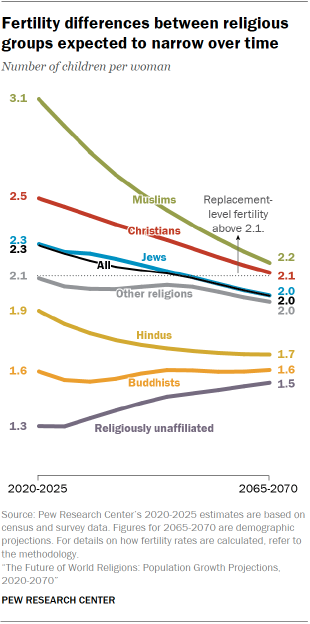
Globally, Muslims have a relatively large percentage of women who are in, or soon will enter, their childbearing years. They also have the highest total fertility rate of any religious group covered in this study: 3.1 children per woman, according to our 2020-2025 global estimates.
Christians have the second-highest fertility rate (2.5).
Hindus have a slightly younger age structure than the global population, but because they have a lower-than-average fertility rate (1.9), the Hindu population is projected to grow at a slower pace than non-Hindus in the coming decades. In fact, their total fertility rate is below the replacement level, which is generally estimated at 2.1 children per woman in countries with low mortality rates for infants and children.16
Religiously unaffiliated people and Buddhists have the lowest total fertility rates – 1.3 and 1.6 children per woman, respectively – both of which are well below the replacement level.
How fertility is projected to change in the future
The Center’s projections assume that religious groups’ fertility rates will begin to slowly converge within countries in the coming decades.
Religious groups that currently have fertility rates well above the replacement level are projected to see their rates decline, while groups with fertility rates below the replacement level are generally expected to see their rates stabilize – or even rise – by 2070. Muslims are the only religious group projected to have above-replacement-level fertility at the end of the projection period.
By 2070, the Center projects …
- Muslims will experience the sharpest decline in fertility, falling from 3.1 to 2.2 children per Muslim woman, on average.
- Buddhists’ rate will stabilize at 1.6.
- The total fertility rate of religiously unaffiliated people will rise slightly, from 1.3 to 1.5.
- Fertility rates of the remaining four religious groups will decline modestly.
Globally, the overall fertility rate for all women is projected to dip from 2.3 in 2020-2025 to 2.0 – just below replacement level – in 2070.17
Regional differences in fertility
All of the world’s major geographic regions are projected to see their religious composition change, but some regions will change more than others. These shifts are influenced by fertility differences between religious groups, which often reflect the overall fertility of the countries in which they are concentrated.
For example, in the Asia-Pacific region, Muslims currently have a much higher total fertility rate than religiously unaffiliated people (2.5 children per woman vs. 1.1). If this fertility gap persists – while gradually narrowing in coming decades – Muslims will surpass unaffiliated people as the largest religious group in the region by 2040.
Muslims also are projected to grow as a share of the population in sub-Saharan Africa, largely because they have a much higher fertility rate than non-Muslims there (5.1 vs. 4.0).
Fertility differences between regions also can gradually alter the geographic distribution of a religious group. For instance, in the decades ahead, Christians are expected to grow more concentrated in sub-Saharan Africa – where they are estimated to have a total fertility rate of 4.0 children per woman as of 2020-2025 – and less concentrated in Europe, where their fertility rate is 1.4.
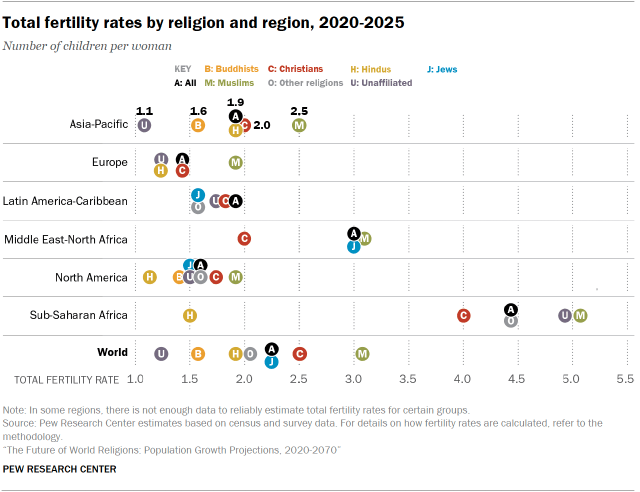
Likewise, Jews are projected to become more concentrated in the Middle East and North Africa and less concentrated in North America, largely due to their higher fertility in Israel (3.0 children per Jewish woman, as of 2020-2025) than in the United States and Canada, where the average Jewish woman is expected to have fewer than two children.
Country-level differences in fertility
Many religious groups are concentrated in just a few countries. As a result, their global fertility rates are shaped largely by the national fertility rates in those countries.
For example, during the recent 2020-2025 period, the total fertility rate of Hindus (1.9) resembles the overall fertility rate of India (2.0). India is home to 95% of all Hindus, and Hindus make up 79% of India’s population. Since 85% of all Jews live in Israel or the U.S., fertility patterns in these two countries heavily influence the fertility of Jews globally.
This also impacts the rankings of countries with the largest religious group populations. According to the Center’s projections, by 2070:
- The Democratic Republic of the Congo, which has a national fertility rate of 6.1 children per woman as of 2020-2025, will surpass the U.S. (fertility rate of 1.6) as the country with the largest Christian population.
- Pakistan (3.6) will replace Indonesia (2.1) as the country with the most Muslims.
- India (2.0) will surpass China (1.1) to have the largest number of followers of “other religions.”18
(Refer to our sortable table to see how 201 countries and territories rank in the size of their religious group populations.)
Within countries, religious groups tend to have roughly similar fertility levels. This is especially true in places where the overall fertility rate is low, such as the U.S., which has an overall fertility rate of 1.6 children per woman as of 2020-2025. Muslim Americans are estimated to have only a modestly higher fertility rate than Christian Americans (1.9 vs. 1.8).
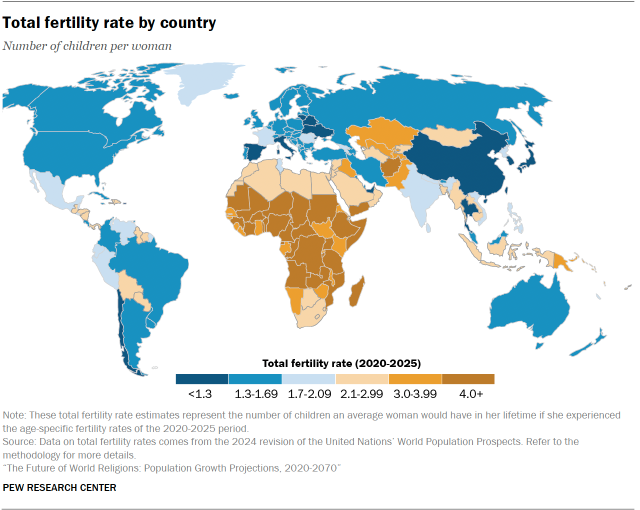
But there are often wide fertility gaps in countries with high overall fertility rates. This is the case in the Democratic Republic of the Congo, where Muslim and Christian fertility rates differ by one child (7.1 vs. 6.1, respectively, as of 2020-2025).
How much difference does fertility make?
One way to assess the impact of fertility on the future religious landscape is to compare the main projection scenario – which assumes that the current fertility gaps between groups will persist but slowly converge toward the country’s overall fertility level – with a hypothetical scenario in which all religious groups within a country share the same national fertility rate in the coming decades.
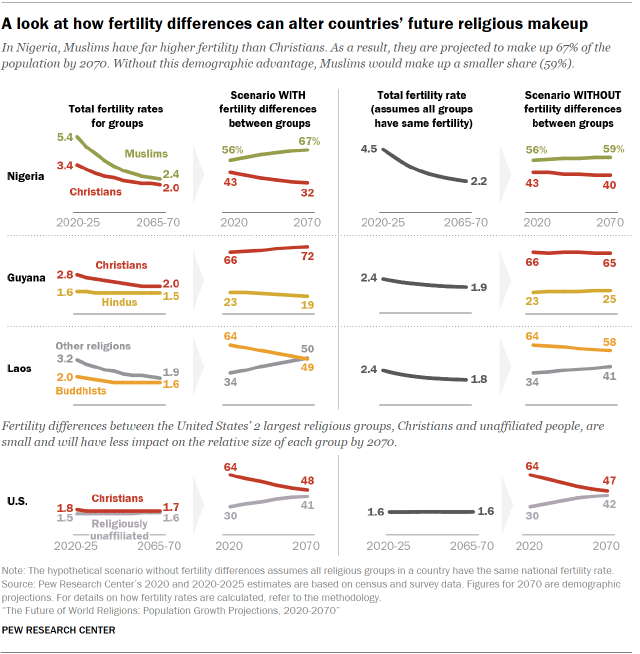
For example, in Nigeria, we estimate that Muslims made up 56% of the population in 2020, while Christians accounted for 43%. The total fertility rates of Muslims (5.4) and Christians (3.4) differed by two children, on average, during the 2020-2025 period. But if we were to assume that there was no difference between the fertility rates of Nigerian Muslims and Christians throughout the 50-year projection period:
- Muslims would make up a smaller share of the country’s population in 2070 (59%) than they would under the main projection scenario (67%).
- Christians would make up a larger portion of the population (40% vs. 32%).
This suggests that Nigerian Muslims’ comparatively high fertility will play a large role in their growth.
Several other countries are expected to see a shift in the religious makeup of their populations, largely due to fertility differences between their two largest religious groups.
Under the main projection scenario, Buddhists will no longer form a majority in Laos in 2070. However, Buddhists would remain a majority if they were to share the same fertility rate as the country’s overall population in the coming decades, making up 58% of all Laotians in 2070 rather than declining to 49%. Similarly, if Christians in Togo were to have the same fertility rate as all other Togolese people, they would still make up a majority of the population in 2070 (56%).
By contrast, in the United States, where fertility differences between the two largest religious groups – Christians and unaffiliated people – are small, the percentage of the population that each group is projected to make up in 2070 is similar under the main projection scenario and the scenario without fertility differences.
At the global level, the religious landscape would look only modestly different under the hypothetical “no fertility differences” scenario versus the main projection scenario. Muslims would still surpass Christians as the largest religious group by 2040 – just five years later than is projected in the main scenario.19
(This scenario without fertility differences would not substantially change the global religious landscape because it models what would happen if every group within a country had the same fertility as the national average, rather than if every group worldwide had the same fertility as the global average. Total fertility rates vary greatly across countries, ranging from less than one child per woman in some parts of Asia to more than six children per woman in several African countries.)
Mortality
While fertility is key to population growth, populations also can increase over time if people begin to live longer, on average, and fewer die prematurely. One way to assess how much religious groups benefit from this demographic advantage is by examining the expected longevity of human life.
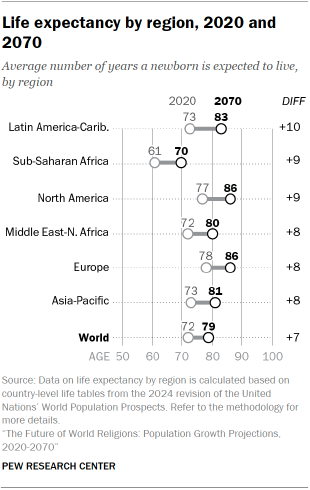
Life expectancy at birth is a common metric that demographers use to capture mortality rates at a given moment in time. It represents the expected lifespan of an average newborn child.20
Globally, life expectancy at birth was 72 years in 2020, according to the United Nations.21 But life expectancy varies considerably across the six regions included in this study, reflecting differences in living conditions and access to healthcare.
In 2020, Europe had the highest average life expectancy, at 78 years, followed closely by North America (77 years). Sub-Saharan Africa had the lowest average life expectancy (61) and was the only region where life expectancy was below the global average.
Global life expectancy is projected to rise to 79 in 2070. People in most countries are expected to live longer due to better healthcare, diet and hygiene, and other factors.22 Despite these gains, regional differences in life expectancy are projected to persist. In 2070, Europeans are forecast to have an average life expectancy of 86 years, compared with 70 years in sub-Saharan Africa.
In this study, due to a lack of reliable information on differences in life expectancy between religious groups within individual countries, we assume that people in all religious groups have the average life expectancy of the country in which they live. For example, both Christians and Muslims in Nigeria are assigned the average life expectancy of all Nigerians, which was 53 years in 2020, while both Christians and Muslims in the United States are assigned the average life expectancy of all Americans, which was 77 years in 2020.
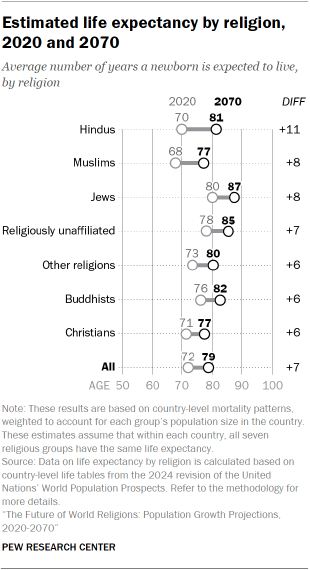
This approach allows us to indirectly estimate differences in life expectancy between religious groups due to variation in how each group is distributed around the globe.
Jews are estimated to have the highest life expectancy at birth of any religious group, with a global average of 80 years in 2020, followed by religiously unaffiliated people (78) and Buddhists (76).23
Muslims have the lowest life expectancy, at 68 years. The life expectancies of Hindus (70) and Christians (71) also are below the global average (72).
Over the next five decades, Hindus are projected to see the largest gains in life expectancy (+11 years), followed by Muslims (+8 years). The average life expectancy of Christians and Buddhists is expected to increase by six years.
By 2070, Christians and Muslims worldwide are projected to have the same life expectancy (77 years).
Religious switching: Leaving or joining a religion
Globally, most people still belong to the religion – or nonreligion – in which they were raised. However, the percentage of people who keep their childhood religious identity in adulthood varies by religion.
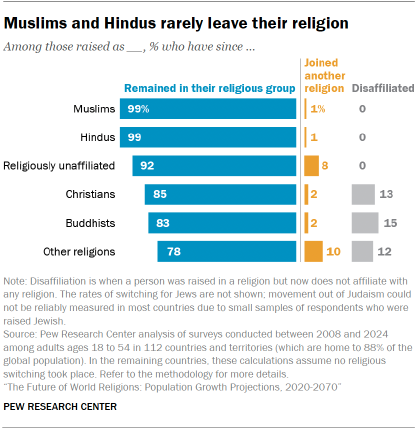
Muslims and Hindus have the highest retention rate, at 99% each, followed by religiously unaffiliated people (92%), according to the Center’s estimates.
Christians and Buddhists are less likely to retain their religion, followed by people in the “other religions” umbrella category, who have the lowest retention rate of the seven religious groups we studied.
In addition to people leaving, all religious groups have people who join, either by formally converting or by informally changing their religious identity.
Of the groups included in this study, Christians have the highest ratio of people leaving to joining the religion. For every person who joins Christianity, 2.3 are projected to leave the faith during the 2020-2025 period. By contrast, religiously unaffiliated people have the highest ratio of people joining to leaving, at 2.4 to 1.
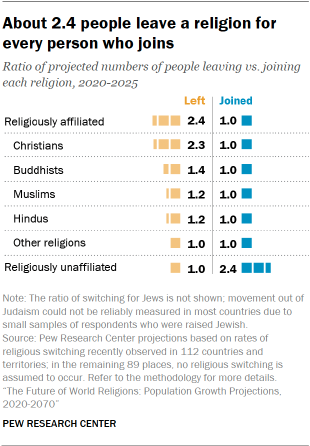
Because it is relatively uncommon for people to leave or join Islam or Hinduism, there are only modest differences in the ratio of leavers to joiners in those religious groups.
We cannot calculate a meaningful ratio of people leaving to joining Judaism because in most countries, there is not enough survey data on people raised as Jews to reliably estimate rates of switching out of Judaism.
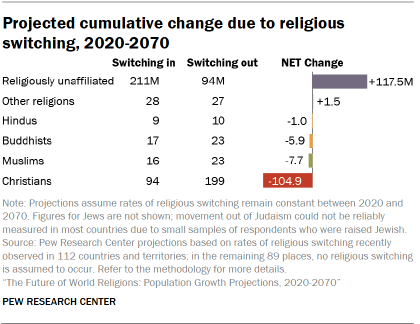
Over the long term, switching into and out of religious groups can shift religious landscapes. Based on recent experience, the largest global movement is expected to be people leaving religion. If switching were to continue in the decades ahead at the same levels recently observed in 112 countries and territories for which data on switching is available, then an estimated 211 million people would become unaffiliated between 2020 and 2070, while 94 million unaffiliated people would join a religion. As a result, unaffiliated people are expected to experience the largest net gains from religious switching, increasing by 117 million over the next five decades.
Christians are expected to experience the largest net losses through religious switching, declining by 105 million between 2020 and 2070. Muslims, Hindus and Buddhists are projected to experience modest net losses due to switching, while people who belong to other religions are expected to see modest gains through religious switching.
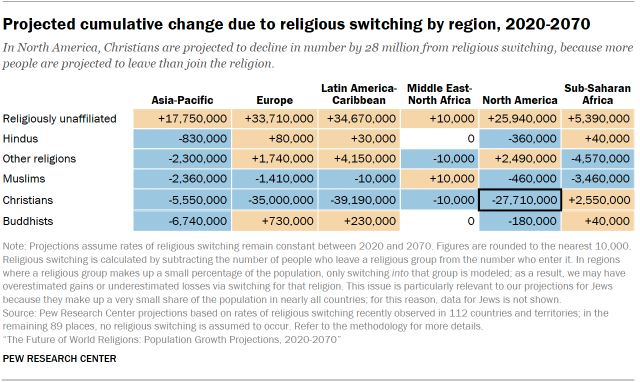
These patterns largely hold across all major geographic regions. Within each region, Christians typically are projected to lose the most followers, while unaffiliated populations often are expected to gain the most people from religious switching.
However, there are some exceptions. In the Asia-Pacific region, Buddhists are projected to experience the largest net loss (-7 million), followed by Christians (-6 million). And in sub-Saharan Africa, Christians are expected to see small gains through religious switching (+3 million), partially offsetting their losses at the global level.
How much difference does religious switching make?
The global impact of religious switching can be seen by comparing the main projection scenario with a hypothetical scenario that assumes no religious switching will take place between 2020 and 2070.24
Under this “what if” scenario, everyone continues to identify with the same religion in which they were raised. (For example, all people who were raised as Christians remain Christians, and everyone who was raised without a religion stays unaffiliated throughout their lives.)
Under this “no switching” scenario, the religious makeup of the global population in 2070 would look broadly similar to the outcome in the main scenario, with some exceptions.
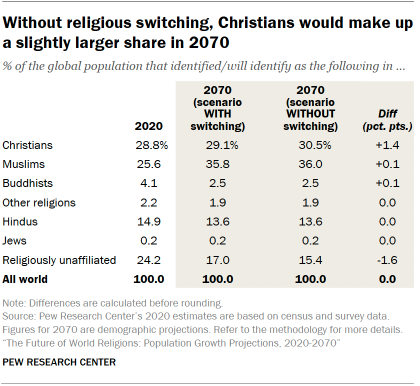
If there were no more religious switching after 2020, Christians would make up 31% of the world population in 2070. That is 1.4 percentage points higher than projected in the main scenario, which factors in a net loss of Christians due to switching. On the other hand, religiously unaffiliated people would account for 15% of the global population under the “no switching” scenario. That’s 1.6 points lower than in the main scenario, which includes a net gain in unaffiliated people through switching.
Even under a hypothetical “no switching” scenario, Muslims still would surpass Christians as the world’s largest religion because differences in the age structure and fertility rates of the two groups have a much larger effect on their population sizes than switching does.
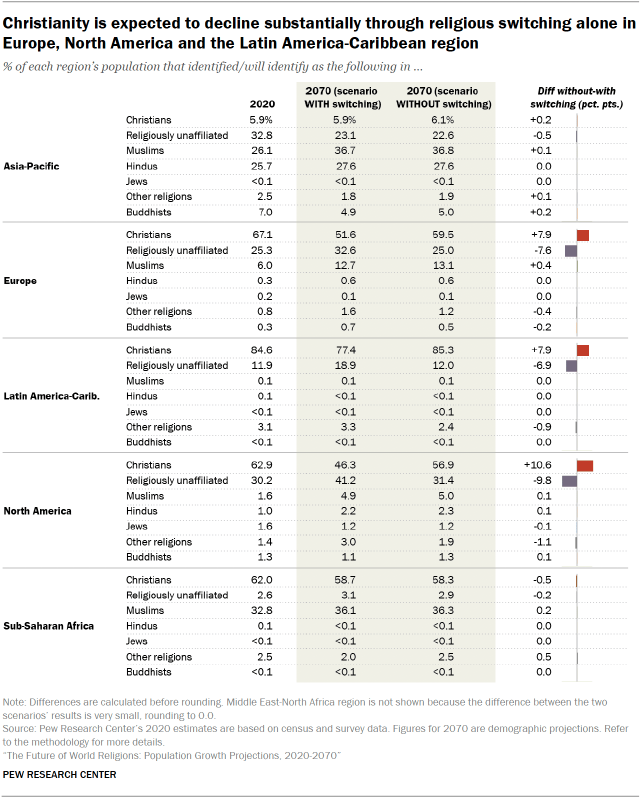
While religious switching is expected to have a modest impact on the global religious landscape, it is projected to substantially shift the religious makeup of some geographic regions. If all switching were to cease from 2020 through 2070, Christians would make up:
- 57% of North America’s population, compared with 46% under the main projection scenario
- 85% of the population in Latin America and the Caribbean, rather than falling to 77% as the main scenario projects
- 60% of Europeans, rather than 52% as the main projection scenario forecasts
Unaffiliated people, meanwhile, would account for a smaller portion of these three regions’ populations. Under the hypothetical “no switching” scenario, religiously unaffiliated people would make up:
- 31% of North Americans versus 41% under the main projection scenario
- 12% of the population in Latin America and the Caribbean, rather than 19% as the main scenario projects
- 25% of Europe’s population – the same share as in 2020 – rather than rising to 33% under the main projection scenario
In the future, it is possible that people may leave religion at a higher rate, especially in countries where disaffiliation from religion is currently rare. Some scholars have suggested that religious affiliation becomes less common in societies during the final stage of a “secular transition,” a process that they consider to be advanced in many European countries but still developing elsewhere.
In short, if leaving religion becomes more common in the future, the unaffiliated population could be larger than projected in 2070.
Conversely, it is possible we could see movement toward religion in countries where many people have disaffiliated from religion in the past, such as the United States. News media have reported a possible uptick in church attendance among young U.S. adults in some denominations, in some parts of the country.25 However, our projections for religious populations focus on religious affiliation rather than religious behavior.
While survey data shows stability in Christian and unaffiliated shares of the U.S. adult population in the last few years, it reveals a decades-long trend of religious disaffiliation; there is no evidence of an increase in affiliation. Our projections, based on switching data that capture long-term trends, do not forecast a rise in Christian affiliation in the coming decades.
Also, because religiously unaffiliated Americans are, on average, much younger than Christian Americans, the share of “nones” in the U.S. population would still grow by 2 percentage points by 2070 – and the share of Christians would shrink by 6 points – even if all disaffiliation from Christianity came to a halt (i.e., the “no switching” scenario).
Migration
Over time, migration can substantially alter the religious makeup of a country or an entire region.
For instance, previous Pew Research Center studies have found that the non-Muslim populations of the six Gulf Cooperation Council (GCC) countries – Bahrain, Kuwait, Oman, Qatar, Saudi Arabia and the United Arab Emirates – collectively have risen substantially due to an influx of Christian and Hindu migrant workers. As a result of Catholics moving to the UAE, St. Mary’s Catholic Church in Dubai is reported to serve more people than any other Catholic parish in the world.
Migration also has been a primary driver of Muslim population growth in Europe in recent decades.
If migration inflows and outflows follow recent patterns, the religious makeup of these places could shift further.26
Roughly 38 million people moved across international borders between 2020 and 2025, according to our projections, which assume that migration inflows and outflows have continued at roughly the same levels recently observed.27 (Our latest estimates are for 2020; all figures after that year are projections.) Most of these migrants belong to the world’s two largest religions, Christianity and Islam.
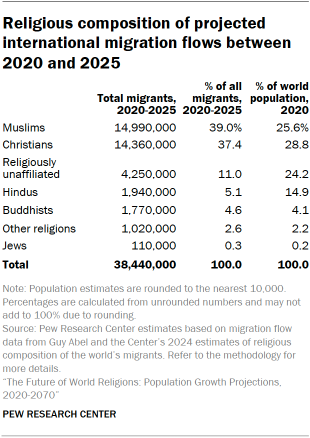
Christians and Muslims make up a larger share of all international migrants (76%) than they do of the world’s total population (54%).
By contrast, religiously unaffiliated people and Hindus are underrepresented among migrants. Hindus made up 15% of the world’s 2020 population, but they account for just 5% of international migrants.
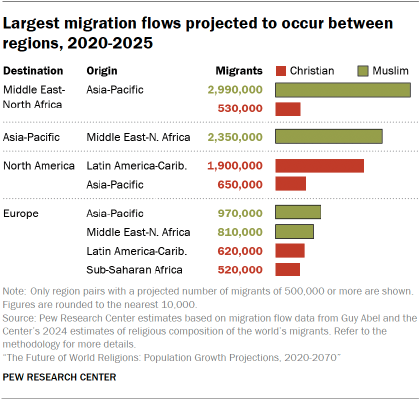
About half of all migrants are projected to move between regions; the remainder will move between countries within the same region. The largest interregional movement is projected to occur among:
- Muslims moving between the Asia-Pacific region and the Middle East-North Africa region, including many migrant workers moving to and from GCC countries
- Christian migrants from the Latin America-Caribbean region to North America
Europe also is projected to receive large numbers of Muslims from the Asia-Pacific and Middle East-North Africa regions, as well as many Christians from sub-Saharan Africa and the Latin America-Caribbean region, between 2020 and 2025.
How much difference does migration make?
Migration has little impact on the global religious landscape as people move from one location to another on Earth.28 However, migration can greatly impact the religious makeup of a region or country. Its effects are especially evident in places where migration flows are large and the religious profile of migrants differs from that of the broader population.
We can assess the impact of migration by comparing the main projection scenario, which assumes migration will continue at the same levels recently observed, with a hypothetical scenario that assumes all international migration will stop after 2020 – an implausible scenario that serves to isolate the effect of migration.
Under this “what if” scenario, Europe’s religious landscape would shift slightly, since migrants to the region are more likely than Europeans overall to be Muslim and less likely to be Christian.
In the main scenario, Muslims are projected to make up 13% of Europe’s population in 2070. But if migration to Europe ceased after 2020, that share would be 9%. This suggests that immigration is a substantial driver of Muslim population growth in Europe. (European Muslims also tend to have a higher birth rate and younger age structure than other religious groups in Europe.)
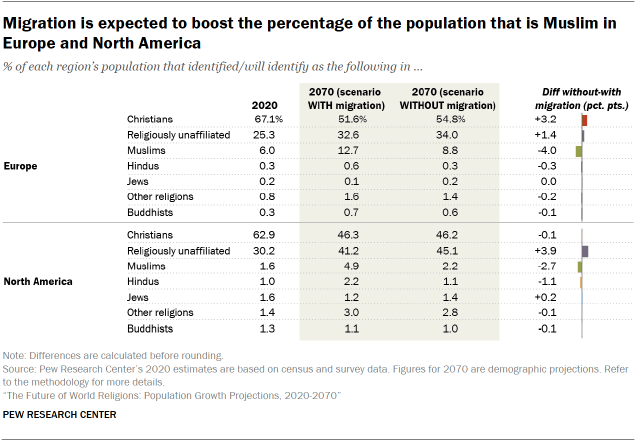
A similar pattern appears in North America, where Muslims are projected to make up 5% of the population in 2070. Without migration, that share would be similar to what it was in 2020, approximately 2%. Migration also is expected to slow down the growth in the share of the region’s population that has no religious affiliation. If migration were to stop after 2020, unaffiliated people would make up 45% of the North American population in 2070, compared with 41% if recent trends in migration continue in the coming decades. This difference reflects the fact that incoming migrants to the region are more likely than the general population to be religiously affiliated. For example, nearly all migrants from India – who account for a large share of immigrants to the region – affiliate with a religion, with fewer than 1% identifying as religiously unaffiliated.
Migration plays less of a role in shaping the religious landscape of the other four major geographic regions. In the Middle East and North Africa, the share of the population that is Muslim would be just 0.5 percentage points larger under the “no migration” scenario than the main scenario (95.7% vs. 95.2%), while the share that is Christian would be 0.3 points smaller (2.0% vs. 2.3%).
Migration between Gulf Cooperation Council countries
Some of the world’s largest international migration flows are into the six Gulf Cooperation Council (GCC) countries of Bahrain, Kuwait, Oman, Qatar, Saudi Arabia and the United Arab Emirates. However, migration is expected to have only a modest impact on these countries’ religious composition in the future. This is because in our projections, natural increase (births exceeding deaths) is the primary driver of population change in the region. While we project a large number of migrants will continue to flow into the region, we expect that most of them will eventually return home and will not have children who remain in GCC countries.29
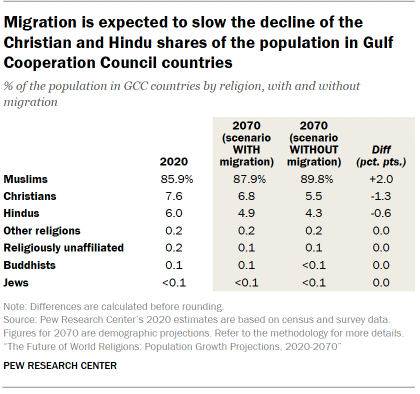
Under the hypothetical scenario where migration stops after 2020, Muslims are projected to make up 90% of the total population in all six GCC countries combined in 2070. This compares with 88% under the main projection scenario, which assumes continued migration. (Still, Muslims are expected to make up a larger share of the population than they did in 2020 under either scenario.)30
Together, GCC countries are expected to see an increase of 2.6 million Christians and 1.8 million Hindus through migration between 2020 and 2070. Because the Muslim majority is projected to grow more rapidly, Christians and Hindus are projected to shrink slightly as a share of these countries’ combined population.


