

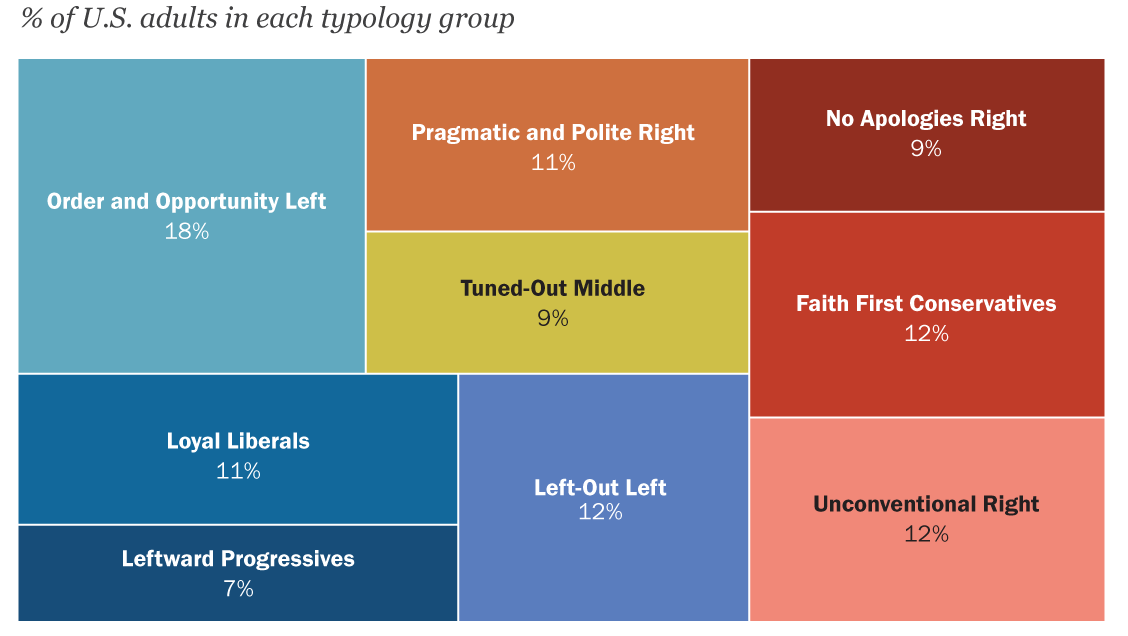
Pew Research Center’s political typology sorts Americans into nine groups based on their political values and attitudes. Some groups are very ideologically consistent and deeply partisan, while others represent different combinations of values and are more ideologically mixed. But the groups also vary in the relative importance they place on politics itself and the extent to which they participate in the political process.
This analysis is part of Pew Research Center’s 2026 Political Typology. To learn more about the typology, start with the overview. To find which group is your best fit, take the quiz.
Who is most invested in election outcomes?
Some groups in the typology are mostly made up of people who almost always vote in federal elections, say that political outcomes really matter to them and regularly seek out news and information about politics. These groups are highly engaged in politics.
Other groups vote far less frequently and are far less likely to want to discuss politics or find political information. These groups have relatively low levels of political engagement.
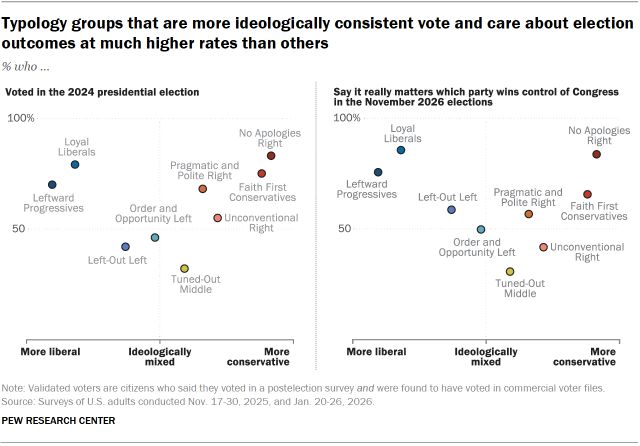
Generally, the groups at the farther ends of the political spectrum – those that are more ideologically consistent – have higher levels of political engagement than the groups that fall in the middle. This reflects a long-standing pattern in American politics.
Consistent with that pattern, about eight-in-ten No Apologies Right (83%) and Loyal Liberals (79%) turned out to vote in the 2024 presidential election. They were followed closely by Faith First Conservatives (75%) and Leftward Progressives (70%).
Pragmatic and Polite Right’s 2024 turnout rate also surpassed the overall national turnout rate, but other more ideologically mixed groups participated at substantially lower rates. Tuned-Out Middle (a group largely defined by their low levels of interest in politics) were the least likely to vote in 2024 – just 32% turned out.
There is a similar pattern in the shares within each group who say it really matters which party wins control of Congress in the upcoming 2026 elections.
Talking about politics and views of politicians
The most ideologically consistent groups are also the most likely to be interested in talking about politics.
But the engaged and ideological groups differ in their orientation to politics and politicians: Some of the most engaged groups are among the most idealistic about politics, while others are deeply cynical.
Interest in talking about politics
The typology groups at the farther ends of the political spectrum are much more likely to express interest in talking about politics than those that are more ideologically mixed – but that interest mostly extends to talking with people who share their political views.
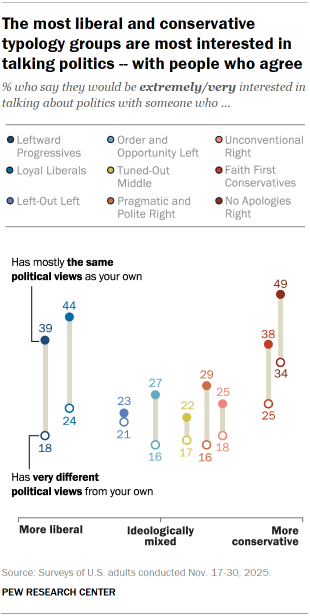
Talking with people who share your views
About half of No Apologies Right (49%) say they would be extremely or very interested in talking about politics with someone who mostly shares their political views. More than four-in-ten Loyal Liberals (44%) say this, as do 39% of Leftward Progressives and 38% of Faith First Conservatives.
No more than 29% in any other group say they would be extremely or very interested in talking about politics with someone who shares their views.
Talking with people who have very different political views than you
Yet when it comes to discussing politics with someone who has very different political views from their own, there is less distance between typology groups – and less interest across the board.
In eight of the nine groups, no more than a quarter say they would be extremely or very interested in doing this. No Apologies Right stand out on this measure, with 34% saying they would be extremely or very interested in talking about politics with someone who has very different political views.
Views about elected officials split both the left and the right
Across the typology groups, engagement with politics doesn’t neatly map to how the groups view elected officials. For instance, some groups are highly engaged and skeptical of politicians, while others are highly engaged and have more generous views of the motivations of elected officials. The combination of these views splits groups on both the left and the right.
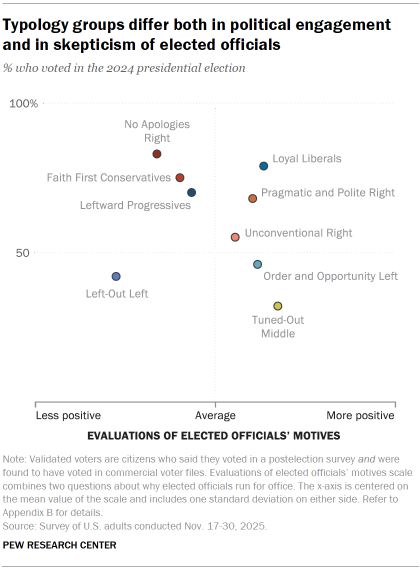
High participation, low skepticism
Loyal Liberals – a high-engagement group – have greater confidence in the good intentions of people serving in elected office than most of the other typology groups.
The moderately engaged Pragmatic and Polite Right look similar to Loyal Liberals in this regard, with relatively positive evaluations of why elected officials run for office.
High participation, high skepticism
By contrast, No Apologies Right are about as highly engaged as Loyal Liberals – but are more skeptical of politicians’ motives. Faith First Conservatives and Leftward Progressives are slightly less engaged, though they still have relatively high levels of engagement – and they express a fair amount of political cynicism.
Low participation, low skepticism
Unconventional Right, Order and Opportunity Left and Tuned-Out Middle are groups with lower levels of engagement but relatively low levels of skepticism.
Low participation, high skepticism
Left-Out Left stand on their own as a group with both low engagement – they were among the lowest-turnout groups in the 2024 election – and a fair amount of skepticism of elected officials’ motives. Left-Out Left are least likely to say that elected officials were motivated by the desire to serve or to address issues important to them.
Typology groups use different sources for political news and information
In addition to differing in levels of interest in political news and information, the typology groups express very different preferences for their news sources. In a March 2025 survey, Pew Research Center presented Americans with a list of 30 different news outlets and asked them to identify those outlets from which they regularly receive news.
| Leftward Progressives | |
| Loyal Liberals | |
| Left-Out Left |
| Order and Opportunity Left | |
| Tuned-Out Middle | |
| Pragmatic and Polite Right |
| Unconventional Right | |
| Faith First Conservatives | |
| No Apologies Right |
Fox News
The Joe Rogan Experience
Newsmax
CNN
NPR
The New York Times
| Typology group | Fox News | CNN | NPR | The New York Times | The Joe Rogan Experience | Newsmax |
|---|---|---|---|---|---|---|
| Total | 38% | 33% | 20% | 19% | 12% | 8% |
| Leftward Progressives | 4% | 36% | 47% | 41% | 1% | <1% |
| Loyal Liberals | 7% | 51% | 58% | 47% | 1% | 1% |
| Left-Out Left | 23% | 40% | 23% | 23% | 6% | 1% |
| Order & Opportunity Left | 32% | 46% | 15% | 19% | 4% | 1% |
| Tuned-Out Middle | 42% | 35% | 6% | 9% | 6% | 2% |
| Pragmatic & Polite Right | 38% | 35% | 18% | 17% | 8% | 7% |
| Unconventional Right | 48% | 24% | 11% | 12% | 18% | 8% |
| Faith First Conservatives | 65% | 13% | 6% | 7% | 26% | 22% |
| No Apologies Right | 73% | 9% | 6% | 4% | 42% | 32% |
Some of the differences track closely with the ideological balance of the groups. For example, groups on the right of the political spectrum are much more likely to report regularly getting news from Fox News than groups on the left of the spectrum, while the reverse is mostly true for CNN.
Yet there are substantial differences in the shares who get news from these sources, even beyond the ideological composition of the groups.
Fox News
Nearly three-quarters of No Apologies Right (73%) report regularly getting news from Fox News, as do nearly two-thirds of Faith First Conservatives (65%).
Fox News is one of the most commonly turned-to sources of the 30 we asked about overall, though other groups are less likely to regularly get news from it. Still, nearly half of Unconventional Right (48%), about four-in-ten Tuned-Out Middle (42%) and Pragmatic and Polite Right (38%), about a third of Order and Opportunity Left (32%), and roughly a quarter of Left-Out Left (23%) regularly get news from Fox News. By comparison, far smaller shares of Loyal Liberals (10%) or Leftward Progressives (4%) are regular Fox News consumers.
CNN
CNN also has a relatively large audience, though Loyal Liberals (51%) and Order and Opportunity Left (46%) are the most likely to regularly get news there. Relatively few No Apologies Right (9%) or Faith First Conservatives (13%) regularly get news from CNN.
The Joe Rogan Experience and Newsmax
Far less widely consumed, these are most popular among No Apologies Right and Faith First Conservatives – though Unconventional Right are also more likely than other groups to regularly get news from The Joe Rogan Experience.
NPR and The New York Times
A majority of Loyal Liberals (58%) say they regularly get news from NPR, as do nearly half of Leftward Progressives (47%) – no more than a quarter in any other group say this. Loyal Liberals and Leftward Progressives are similarly much more likely than those in other groups to regularly get news from The New York Times.
(The Pew Research Center news media sources study asked about more than 30 different news outlets. Visit the detailed tables for additional data on the typology groups’ use of news outlets.)


