
By a wide margin, voters most want candidates running for Congress to talk about economic issues – with many specifically mentioning prices and affordability.

| Category | % | Group |
|---|---|---|
| NET Economy | 29 | subgroup |
| Cost of living/Affordability | 15 | subgroup |
| General economy | 7 | subgroup |
| Taxes | 4 | subgroup |
| Government ethics and reform | 9 | group |
| Immigration | 7 | group |
| Healthcare | 5 | group |
| Foreign policy | 4 | group |
| Trump | 4 | group |
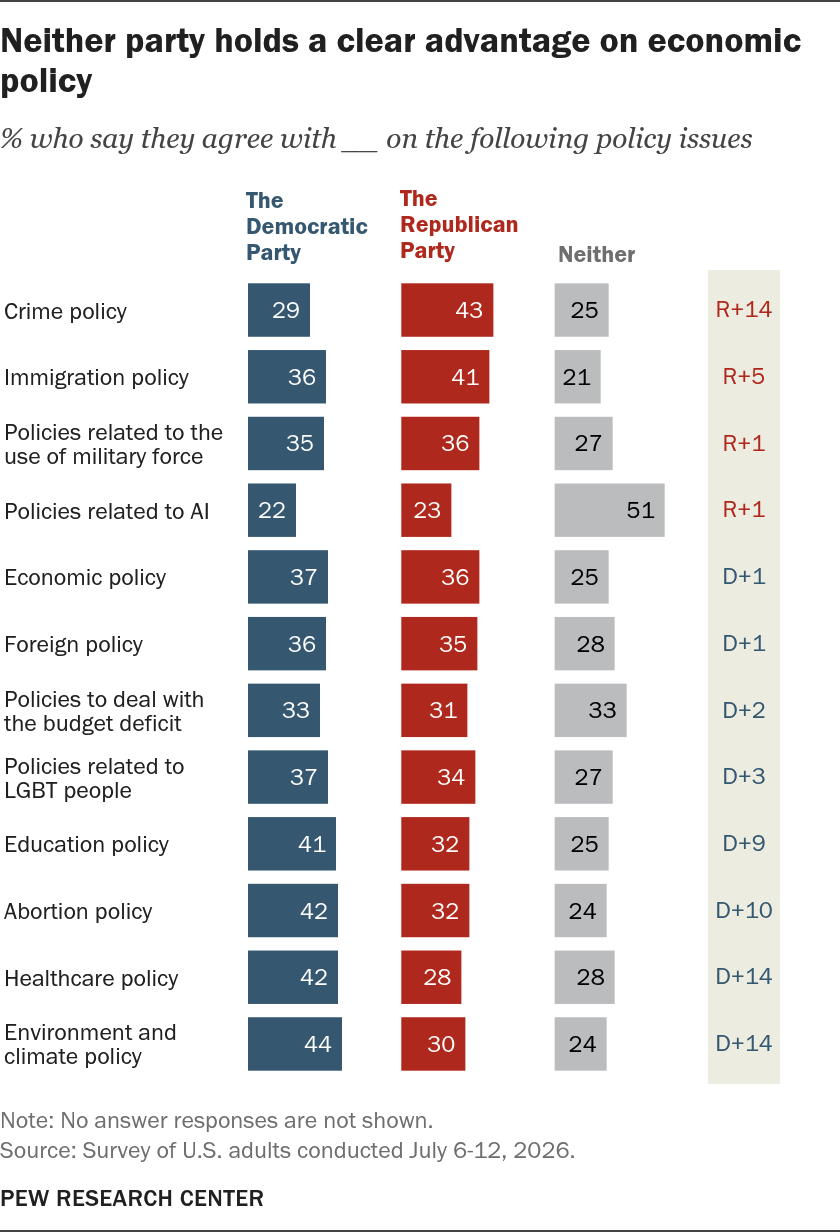
But with the November elections on the horizon, neither party is seen as having an advantage on these issues. Americans are now almost evenly split over which party they most agree with on economic policies: 37% say the Democratic Party, while 36% say the Republican Party.
At this early stage, Democrats have both an edge in voters’ congressional candidate preferences and an engagement advantage among their coalition. Among registered voters:
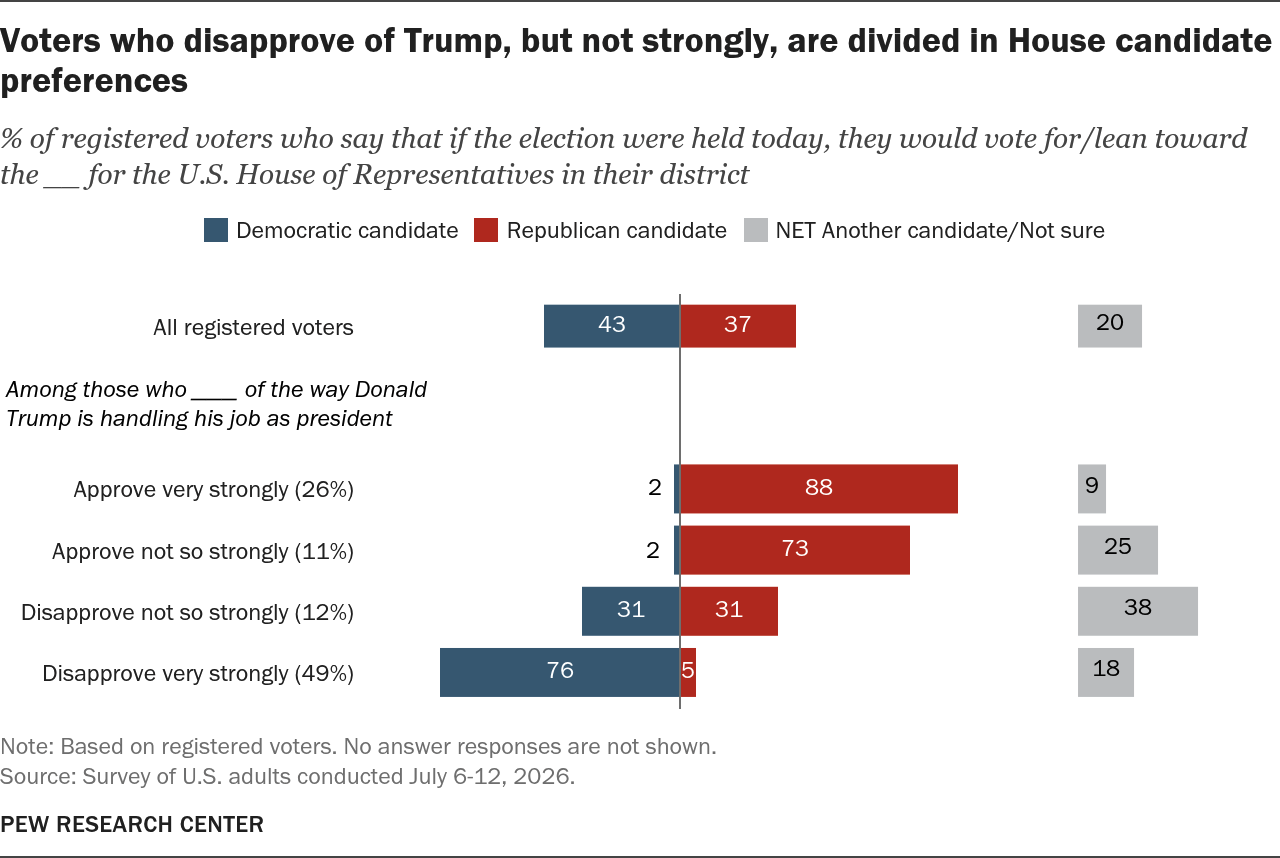
- 43% say they would back a Democratic candidate for Congress if the election were held today, while 37% would back a Republican. Two-in-ten say they are not sure or would back another candidate.
- 70% of Democrats and Democratic-leaning independents say “it really matters” which party controls Congress in November, while 60% of Republicans and Republican leaners say the same.
- 39% of Democrats have thought a lot about the election, compared with 22% of Republicans.
At a similar stage of the 2022 midterm campaign, Republicans held a modest edge on both engagement measures.
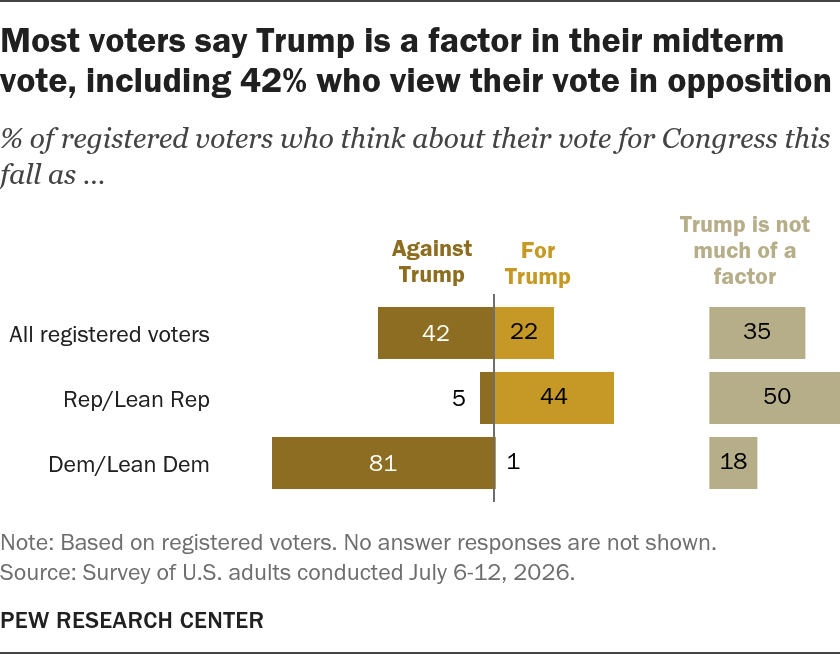
These are among the key findings of a new Pew Research Center survey conducted from July 6 to 12 among 3,554 U.S. adults, including 2,779 registered voters. The survey also finds that President Donald Trump looms large in the campaign. Most voters say the president is a factor in their vote – though by roughly two-to-one, voters are more likely to say they think of their vote this fall as a vote against Trump (42%) than to say they think of it as a vote for him (22%).
Views of Trump are a bigger factor for voters today than views of then-President Joe Biden were at a similar point four years ago.
| Against Trump | For Trump | Trump is not much of a factor | |
|---|---|---|---|
| All registered voters | 42 | 22 | 35 |
| Rep/Lean Rep | 5 | 44 | 50 |
| Dem/Lean Dem | 81 | 1 | 18 |
Democrats overwhelmingly say they consider their vote for Congress this fall a vote against Trump – 81% view their vote this way.
In contrast, half of Republicans say Trump is not much of a factor in their vote, while 44% say their vote is a vote for him.
Views of the parties on key issues
Before the start of Trump’s second term, Americans were more likely to agree with the Republican Party than the Democratic Party on economic policy. Continuing a trend since Trump took office, the public is now about evenly split (37% say they agree with Democratic Party, 36% the Republican Party).
| The Democratic Party | The Republican Party | Neither | R-D advantage | |
|---|---|---|---|---|
| Crime policy | 29 | 43 | 25 | R+14 |
| Immigration policy | 36 | 41 | 21 | R+5 |
| Policies related to the use of military force | 35 | 36 | 27 | R+1 |
| Policies related to AI | 22 | 23 | 51 | R+1 |
| Economic policy | 37 | 36 | 25 | D+1 |
| Foreign policy | 36 | 35 | 28 | D+1 |
| Policies to deal with the budget deficit | 33 | 31 | 33 | D+2 |
| Policies related to LGBT people | 37 | 34 | 27 | D+3 |
| Education policy | 41 | 32 | 25 | D+9 |
| Abortion policy | 42 | 32 | 24 | D+10 |
| Healthcare policy | 42 | 28 | 28 | D+14 |
| Environment and climate policy | 44 | 30 | 24 | D+14 |
Similarly, Republicans no longer hold an advantage on policies to deal with the budget deficit.
For more on Americans’ economic views, including views of the impact of Trump’s economic policies on the economy, jump to “Americans’ evaluations of the economy remain negative.”
Neither party has an advantage on foreign policy or policies related to the use of military force, or on policies related to lesbian, gay or transgender people – a Democratic strength in 2022 and 2023.
And when it comes to policies to deal with artificial intelligence, 51% of adults say they agree with neither party.
Areas where Republicans hold an advantage
Americans continue to be more likely to agree with the Republican Party (43%) than the Democratic Party (29%) on policies to deal with crime.
Republicans also hold a 5 percentage point edge on immigration policy. This compares with a 9-point Republican advantage in September.
Areas where Democrats hold an advantage
Democrats hold 14-point advantages on both healthcare and environmental policy, a 10-point advantage on abortion policy, and a 9-point advantage on education policy.
Other key findings
Trump’s approval rating stands at 34%, while 64% of Americans say they disapprove of his job performance – unchanged since April. About seven-in-ten Republicans (69%) currently approve of his performance, while roughly three-in-ten (29%) disapprove. Democrats continue to overwhelmingly disapprove of his performance (93% disapprove, 6% approve).
| Group | Republican candidate | Democratic candidate | Another candidate | Not sure | NET Another candidate/Not sure | |
|---|---|---|---|---|---|---|
| All registered voters | All | 37 | 43 | 5 | 14 | 20 |
| Approve very strongly (26%) | Among those who ___ of the way Donald Trump is handling his job as president | 88 | 2 | 1 | 8 | 9 |
| Approve not so strongly (11%) | Among those who ___ of the way Donald Trump is handling his job as president | 73 | 2 | 4 | 21 | 25 |
| Disapprove not so strongly (12%) | Among those who ___ of the way Donald Trump is handling his job as president | 31 | 31 | 10 | 28 | 38 |
| Disapprove very strongly (49%) | Among those who ___ of the way Donald Trump is handling his job as president | 5 | 76 | 7 | 12 | 18 |
The narrow slice of registered voters who disapprove of Trump, but not strongly (12%), are split in their midterm preferences: 31% back Republicans, 31% back Democrats. And many (28%) say they are not sure, while 10% back “another candidate.” In contrast, voters who approve of Trump back Republican candidates in the fall by an overwhelming margin, while those who strongly disapprove of Trump largely back Democrats.
Demographic differences in voters’ midterm preferences largely track patterns familiar to past elections. Today, Republican candidates have a 10 percentage point edge among White voters, while Democrats hold wider advantages among Hispanic, Black and Asian voters.
For more on demographic differences in candidate support, jump to “Midterm voting preferences by race and ethnicity, age, and other demographics” and explore the detailed tables.
| Date | Favorable | Unfavorable |
|---|---|---|
| 8/4/19 | 35 | 64 |
| 1/19/20 | 33 | 65 |
| 8/2/20 | 35 | 63 |
| 4/12/21 | 36 | 61 |
| 1/17/22 | 28 | 70 |
| 8/14/22 | 31 | 66 |
| 4/2/23 | 26 | 72 |
| 7/16/23 | 26 | 72 |
| 12/3/23 | 23 | 74 |
| 7/7/24 | 30 | 68 |
| 4/13/25 | 34 | 64 |
| 8/1/25 | 32 | 65 |
| 7/12/26 | 25 | 72 |
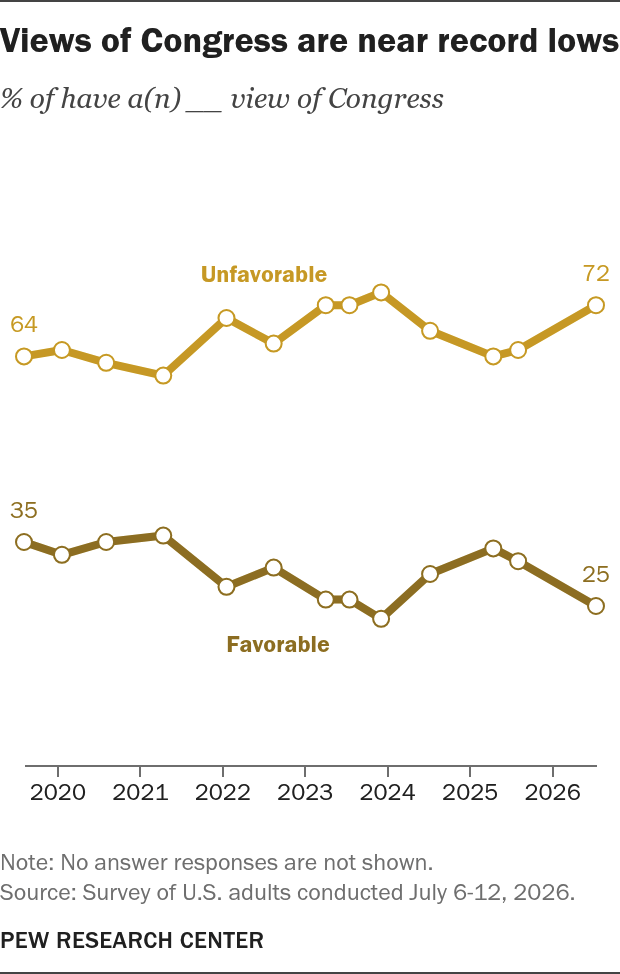
Just a quarter of Americans now hold favorable views of Congress. Current ratings are near record lows and down from 32% last August. Republicans (35%) remain more likely than Democrats (16%) to view Congress positively.


