
This is part of a larger report on Americans and the 2026 midterm elections.
Several months ahead of the 2026 midterm elections, Democrats hold a 6 percentage point edge over Republicans among registered voters on the generic ballot for Congress (43% vs. 37%). Two-in-ten voters say they are not sure (14%) or support another candidate (5%).
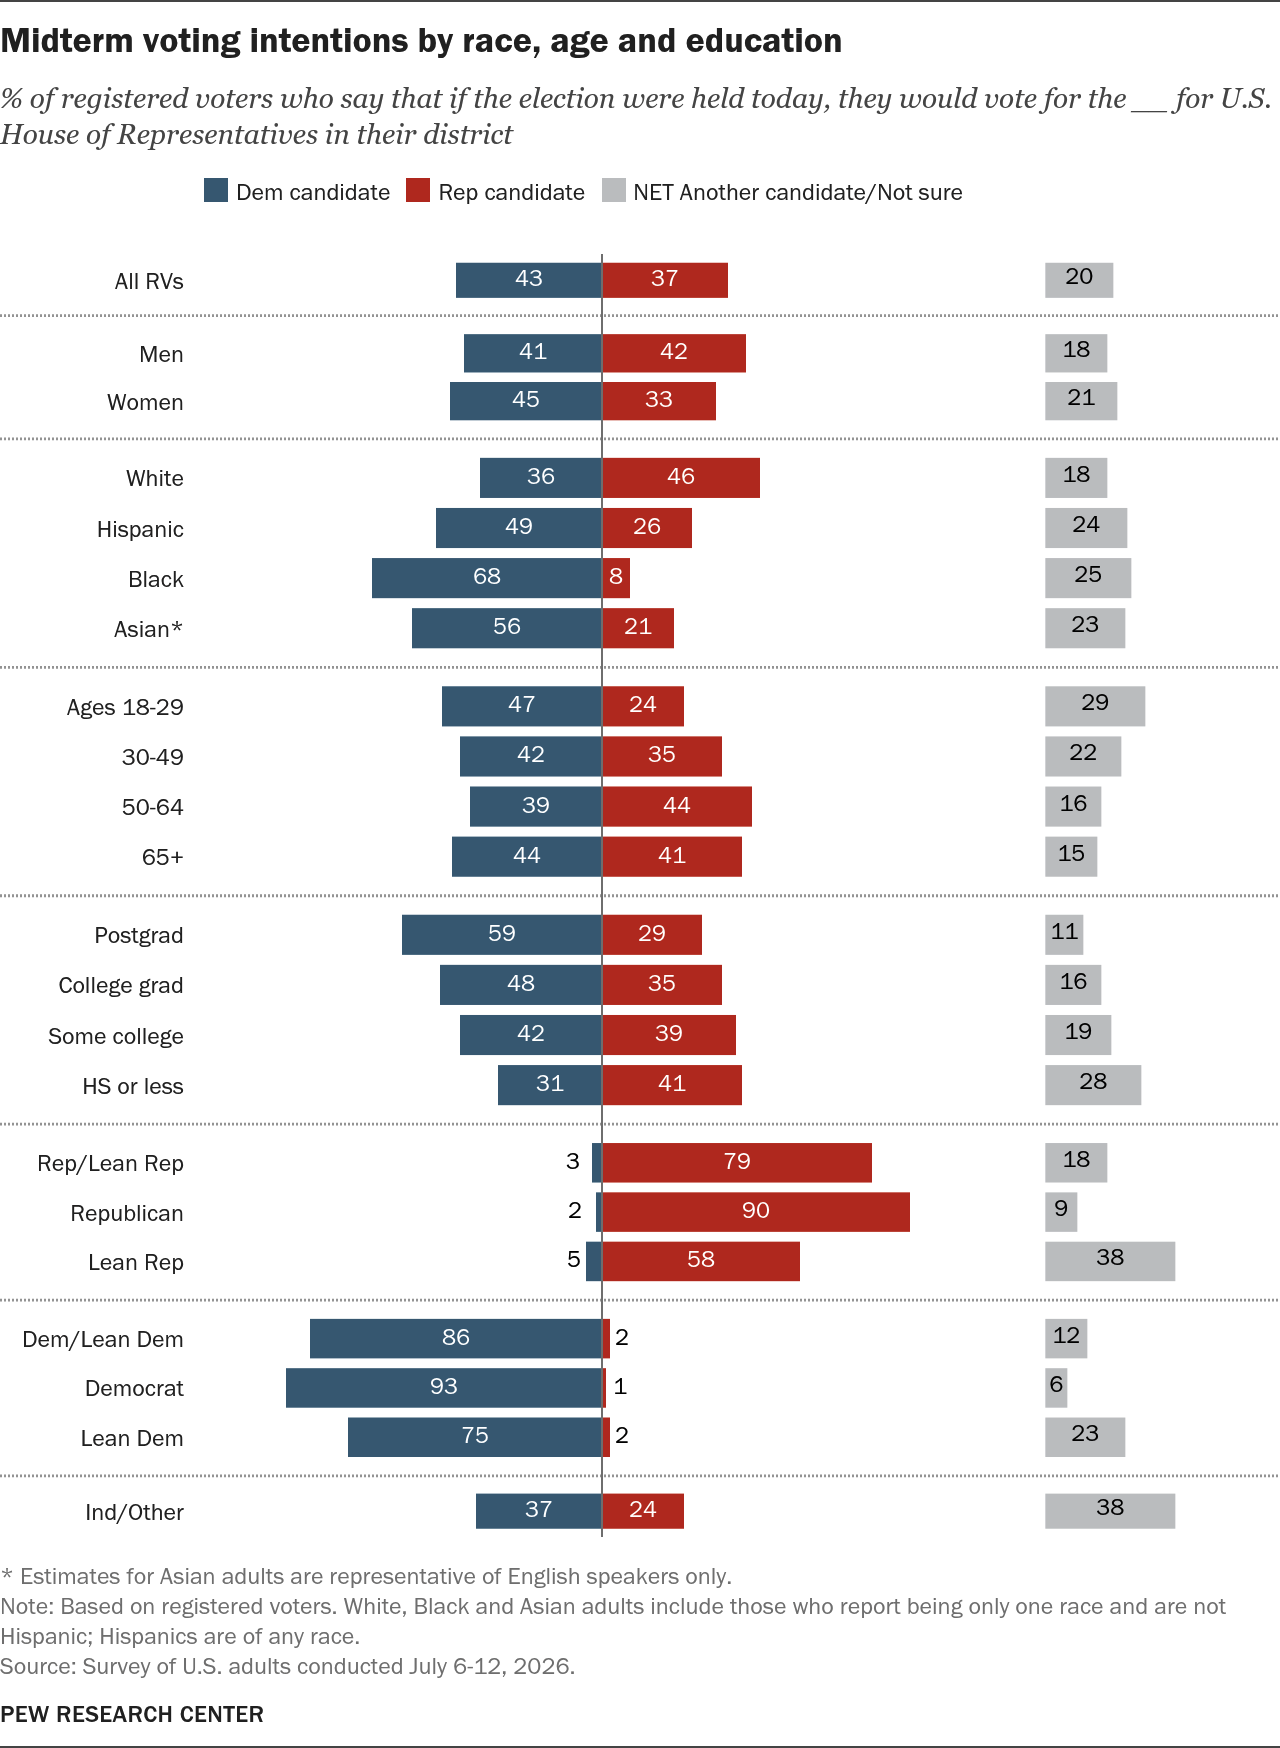
Note: Based on registered voters. White, Black and Asian adults include those who report being only one race and are not Hispanic; Hispanics are of any race.
| group | Dem candidate | Rep candidate | Another candidate | Not sure | NET Another candidate/Not sure | |
|---|---|---|---|---|---|---|
| All RVs | all | 43 | 37 | 5 | 14 | 20 |
| Men | gender | 41 | 42 | 6 | 11 | 18 |
| Women | gender | 45 | 33 | 4 | 17 | 21 |
| White | race/ethnicity | 36 | 46 | 5 | 13 | 18 |
| Hispanic | race/ethnicity | 49 | 26 | 6 | 18 | 24 |
| Black | race/ethnicity | 68 | 8 | 10 | 15 | 25 |
| Asian* | race/ethnicity | 56 | 21 | 6 | 16 | 23 |
| Ages 18-29 | age | 47 | 24 | 9 | 20 | 29 |
| 30-49 | age | 42 | 35 | 7 | 15 | 22 |
| 50-64 | age | 39 | 44 | 3 | 13 | 16 |
| 65+ | age | 44 | 41 | 5 | 11 | 15 |
| Postgrad | education | 59 | 29 | 3 | 8 | 11 |
| College grad | education | 48 | 35 | 6 | 10 | 16 |
| Some college | education | 42 | 39 | 6 | 14 | 19 |
| HS or less | education | 31 | 41 | 6 | 21 | 28 |
| Rep/Lean Rep | partyR | 3 | 79 | 4 | 15 | 18 |
| Republican | partyR | 2 | 90 | <1 | 8 | 9 |
| Lean Rep | partyR | 5 | 58 | 10 | 28 | 38 |
| Dem/Lean Dem | partyD | 86 | 2 | 5 | 7 | 12 |
| Democrat | partyD | 93 | 1 | 1 | 5 | 6 |
| Lean Dem | partyD | 75 | 2 | 11 | 12 | 23 |
| Ind/Other | partyI | 37 | 24 | 12 | 26 | 38 |
Note: Based on registered voters. White, Black and Asian adults include those who report being only one race and are not Hispanic; Hispanics are of any race.
Differences in preferences across demographic groups follow patterns that are similar to other recent elections.
This is an early look at voters’ views. With congressional primaries still ongoing and several months to go until the general election, preferences can change. And turnout in midterm elections tends to be relatively low – much lower than in presidential elections – so the subset of people who actually cast ballots may look different from all registered voters.
Candidate preferences by race and ethnicity
As has been the case in the past several elections, White registered voters say they would choose the Republican congressional candidate over the Democratic candidate if the election were held today (46% vs. 36%).
Among Hispanic voters, 49% say they would vote for the Democratic candidate, 26% for the Republican and 24% say they are not sure (18%) or support another candidate (6%).
Hispanic voters have supported Democrats by sizable margins in the last several midterm elections, and in presidential elections prior to 2024 – but Hispanic voters in the 2024 presidential election were nearly evenly split in their vote preference.
Black voters support Democratic candidates over Republicans by a wide margin in the current survey: 68% vs. 8%, with 25% saying they are not sure or would support another candidate.
Democratic candidates also hold an advantage among Asian voters – 56% vs. 21% who would vote for a GOP candidate. Asian voters have supported Democratic candidates by sizable margins in recent years.
Candidate preferences by age
In recent midterm and presidential elections, voters under 50 have preferred Democratic candidates over Republican ones – though the size of the Democratic advantage has fluctuated. Voters 50 and older have tended to prefer Republican candidates, though that edge has also shifted.
Today, registered voters under 30 prefer a Democrat for Congress over a Republican by nearly two-to-one (47% vs. 24%). These voters are also far more likely than older adults to say they prefer another candidate or are not sure who they will support in November.
Voters 30 to 49 also prefer Democratic candidates by 42% to 35%. While in most recent elections voters in this age group have tended to back Democratic candidates, those who turned out in the 2024 presidential election split their votes about evenly between Donald Trump and Kamala Harris.
Among those 50 to 64, 44% prefer a Republican candidate, while 39% prefer a Democratic candidate.
Candidate preferences by education
Paralleling patterns in partisan identification, college graduates are much more likely than those without a bachelor’s degree to back Democratic candidates.
By about two-to-one, those with a graduate degree prefer Democratic candidates over Republicans (59% to 29%). By a more modest margin, those with a bachelor’s degree but without a higher degree also back Democrats (48% to 35%).
Voters with some college experience are roughly divided in their preferences (42% prefer Democrats, 39% prefer Republicans), while those with no college experience prefer Republican candidates (41% to 31%).
Candidate preferences by party identification
Very few voters who identify with – or lean toward – one of the two major parties say they would vote for the other party’s congressional candidate if the election were held today. But Republicans and Republican-leaning independents are more likely than Democrats and Democratic leaners to say they aren’t sure.
- 79% of Republicans and Republican leaners say they would support the Republican candidate, compared with 3% for the Democrat, 4% for another candidate and 15% who are not sure.
- 86% of Democrats and Democratic leaners say they’d pick the Democrat, while 2% would choose the Republican, 5% another candidate and 7% aren’t sure.
Overall, those who identify as independents or with another party are more likely to say they are “not sure” about their choice for Congress than those who identify as Republicans or Democrats.
But most independents lean to a party, and Republican leaners are currently more than twice as likely to say they are not sure about their vote preference than their Democratic-leaning counterparts (28% vs. 12%).
As a result:
- Republican candidates enjoy a 53 percentage point edge over Democratic candidates among Republican leaners (58% support GOP candidates, 5% support Democrats, 10% back other candidates and 28% say they are not sure).
- Democratic candidates enjoy a far wider 73-point edge over Republican candidates among Democratic leaners (75% support Democratic candidates, 2% support Republicans, 11% back others and 12% aren’t sure).
This difference in the preferences of leaners is the primary driver of Democratic candidates’ 13-point advantage among all voters who identify as independent or with another party.
For more information on groups’ congressional vote preferences, please refer to the detailed tables.


