
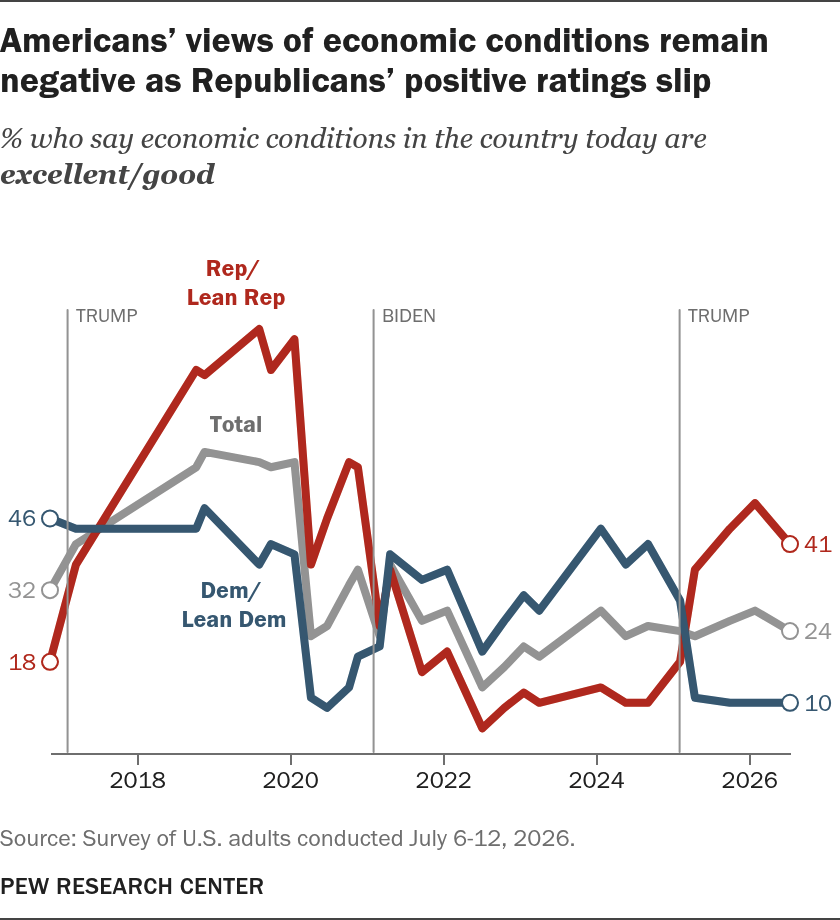
Americans remain in a sour mood about the economy – roughly a quarter (24%) rate economic conditions in the country today as excellent or good, while 41% say they are “only fair” and 35% describe them as poor.
| Date | Total | Rep/Lean Rep | Dem/Lean Dem |
|---|---|---|---|
| 2026-07-12 | 24 | 41 | 10 |
| 2026-01-26 | 28 | 49 | 10 |
| 2025-09-28 | 26 | 44 | 10 |
| 2025-04-14 | 23 | 36 | 11 |
| 2025-02-02 | 24 | 18 | 30 |
| 2024-09-02 | 25 | 10 | 41 |
| 2024-05-19 | 23 | 10 | 37 |
| 2024-01-21 | 28 | 13 | 44 |
| 2023-04-02 | 19 | 10 | 28 |
| 2023-01-18 | 21 | 12 | 31 |
| 2022-10-17 | 17 | 9 | 26 |
| 2022-07-04 | 13 | 5 | 20 |
| 2022-01-17 | 28 | 20 | 36 |
| 2021-09-19 | 26 | 16 | 34 |
| 2021-04-20 | 37 | 36 | 39 |
| 2021-03-01 | 23 | 25 | 21 |
| 2020-11-17 | 36 | 56 | 19 |
| 2020-10-06 | 33 | 57 | 13 |
| 2020-06-23 | 25 | 46 | 9 |
| 2020-04-07 | 23 | 37 | 11 |
| 2020-01-19 | 57 | 81 | 39 |
| 2019-09-29 | 56 | 75 | 41 |
| 2019-08-04 | 57 | 83 | 37 |
| 2018-11-16 | 59 | 74 | 48 |
| 2018-10-07 | 56 | 75 | 44 |
| 2017-03-12 | 41 | 37 | 44 |
| 2016-11-08 | 32 | 18 | 46 |
Positive ratings are slightly lower than in January, when 28% rated the economy as excellent or good. Still, Americans’ economic ratings have hovered around this level for the last few years.
The recent drop is primarily driven by a shift among Republicans and Republican-leaning independents: 41% now rate the economy as excellent or good, down from 49% in January. Just 10% of Democrats and Democratic leaners rate the economy positively, essentially unchanged since early in President Donald Trump’s term.
A new Pew Research Center survey, conducted July 6-12 among 3,554 U.S. adults, also finds that Americans are less likely than they were in January to expect the economy to improve over the course of the next year.
- 23% now say they expect economic conditions to be better a year from now, down from 31% in January.
- 36% say they expect conditions to be worse a year from now, little changed from January (38%).
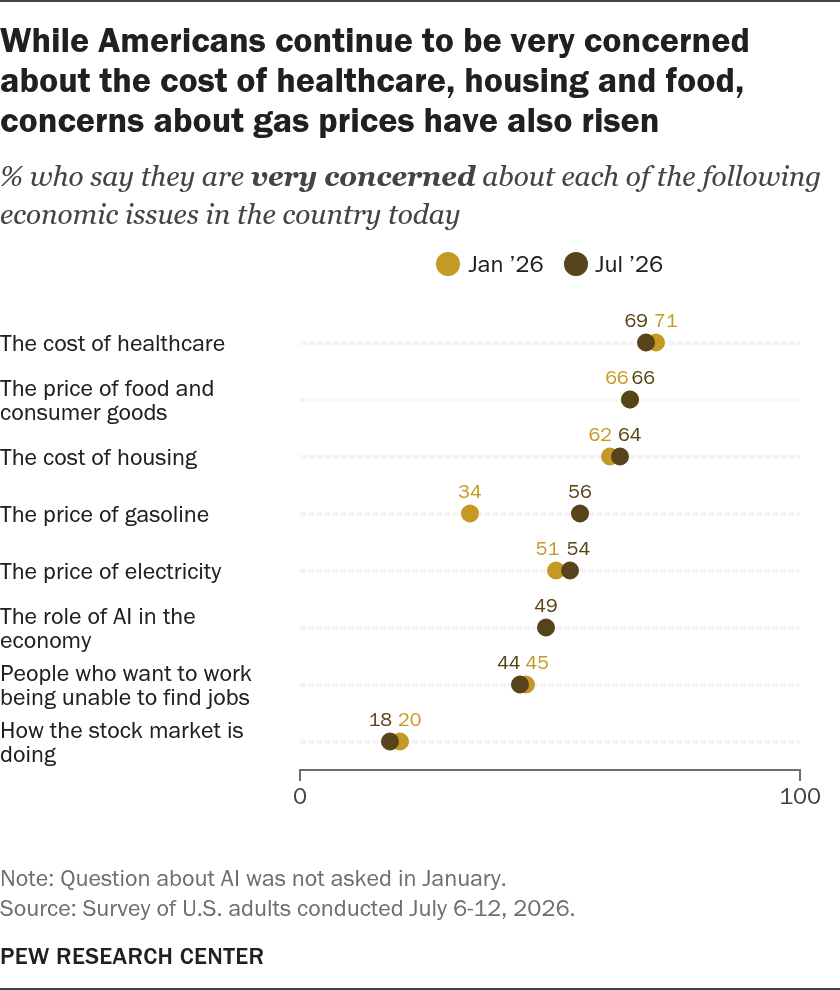
These views come as Americans remain concerned about the costs of healthcare, housing, food and energy. Concerns about gas prices, in particular, have risen sharply since January (before the U.S. military action against Iran). Note: U.S. gas prices had declined somewhat prior to the survey’s field period, but have risen steadily in recent weeks as military actions have escalated in the region and the price of crude oil has risen.
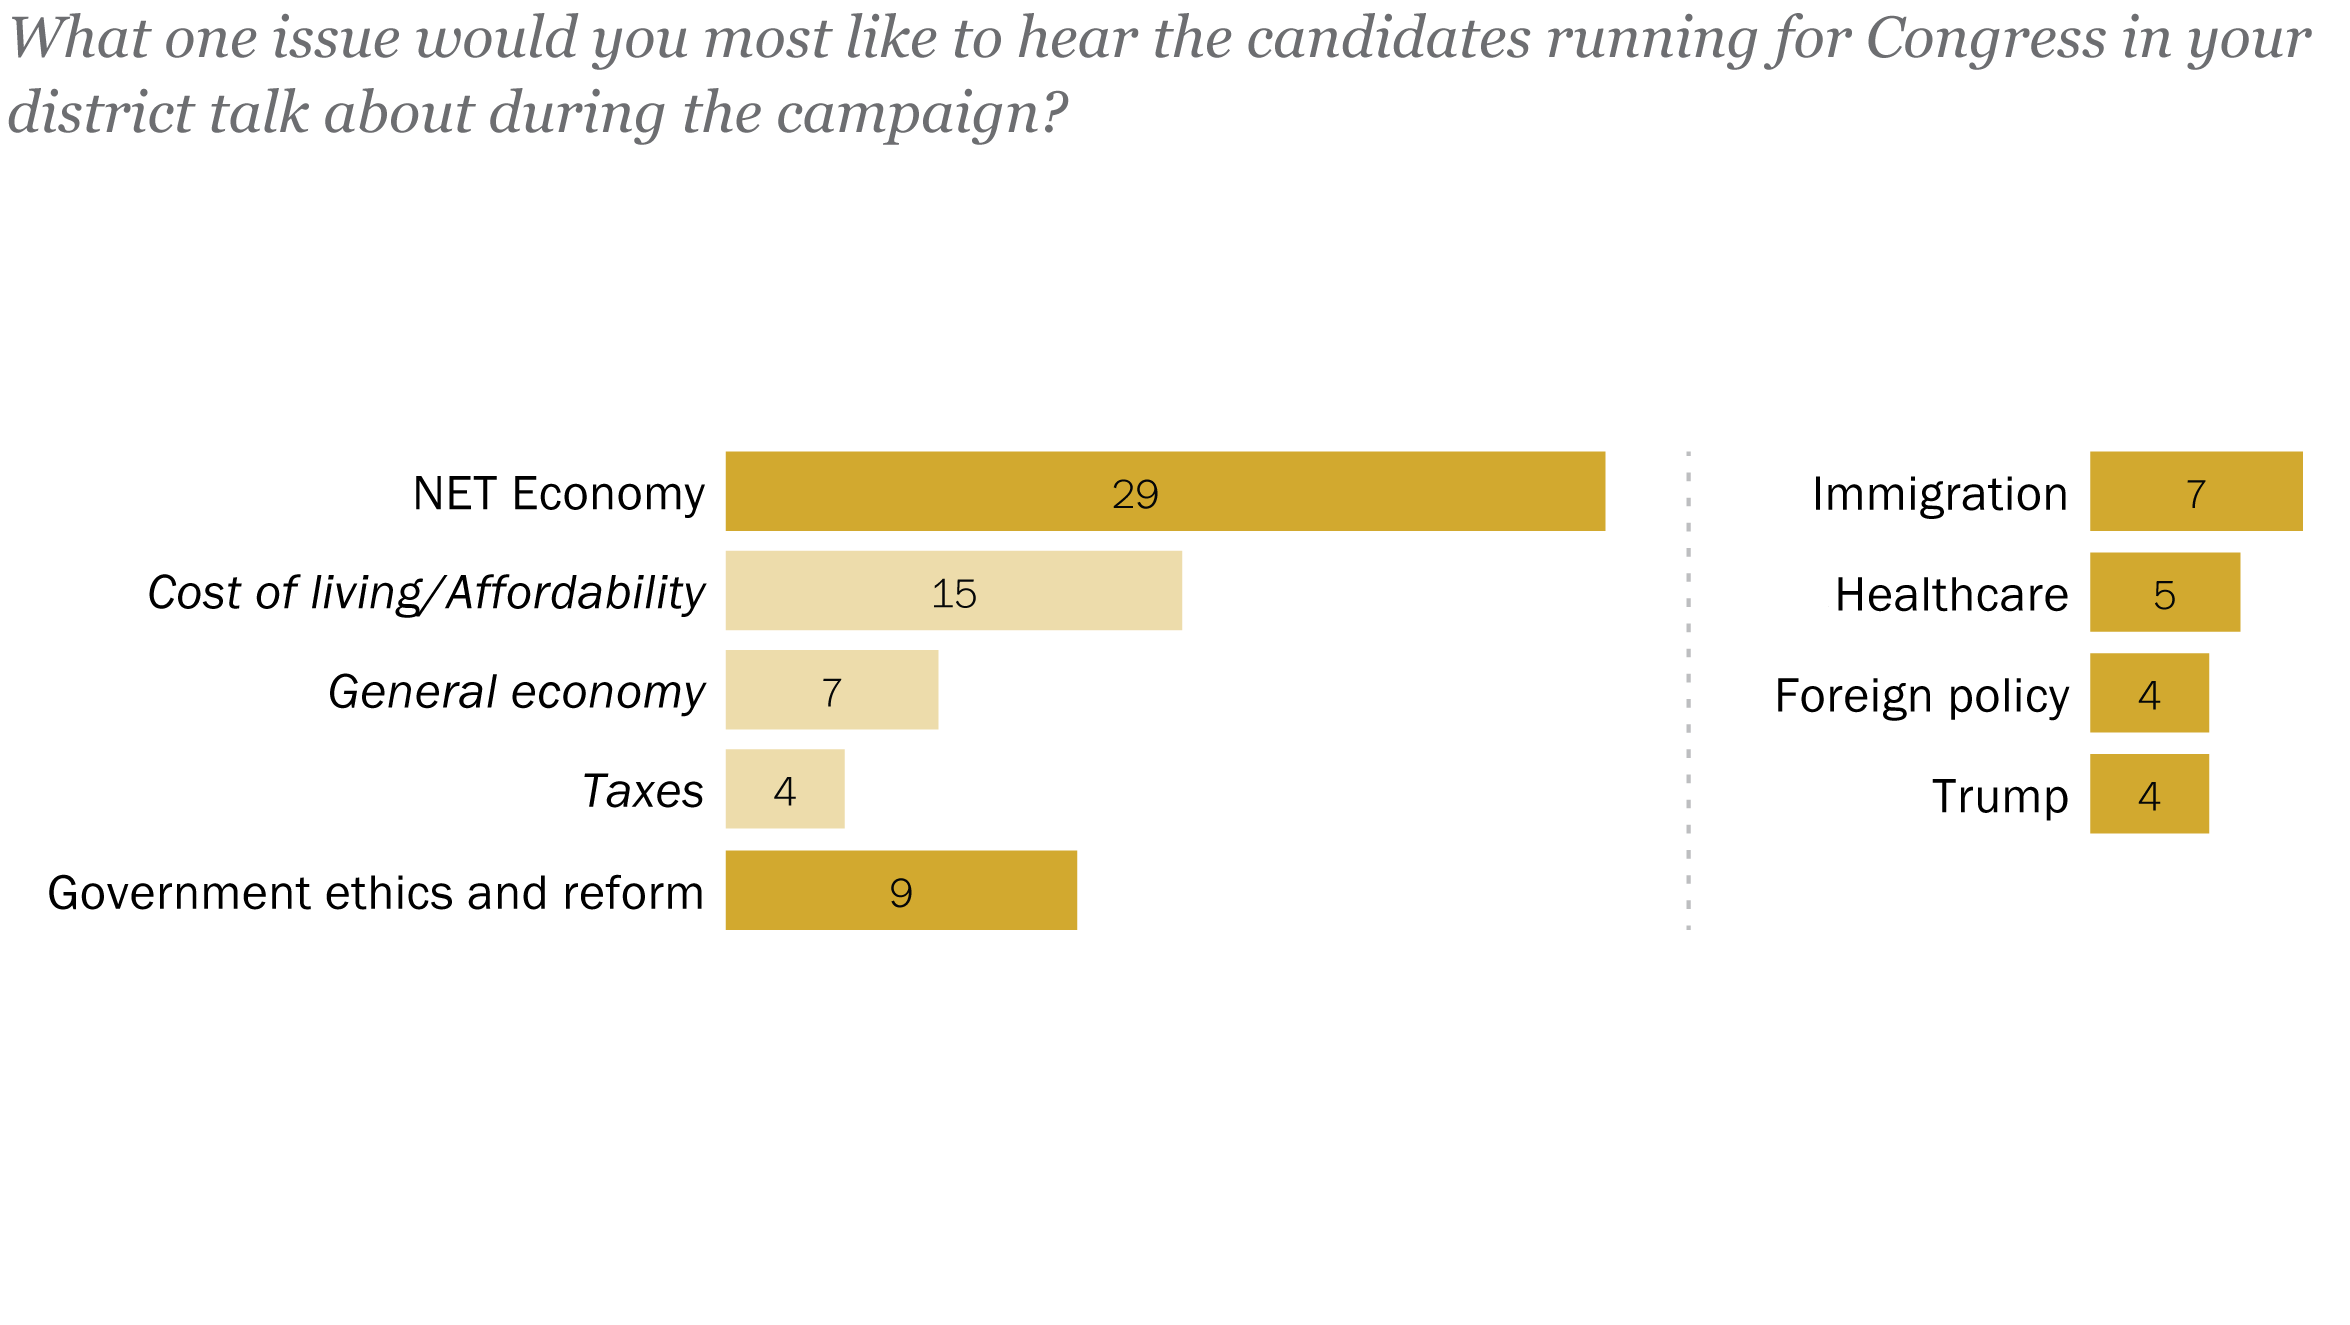
The economy is also front and center in many voters’ minds as the 2026 midterm elections approach. For more on views of the midterms, read the accompanying key findings.
Trump’s economic policies
| Group | Date | Better | Worse | Not had much of an effect |
|---|---|---|---|---|
| Total | Sep ’25 | 24 | 53 | 22 |
| Total | Jan ’26 | 28 | 52 | 19 |
| Total | Jul ’26 | 20 | 60 | 19 |
| Rep/Lean Rep | Sep ’25 | 47 | 19 | 33 |
| Rep/Lean Rep | Jan ’26 | 57 | 18 | 25 |
| Rep/Lean Rep | Jul ’26 | 42 | 28 | 29 |
| Dem/Lean Dem | Sep ’25 | 3 | 87 | 10 |
| Dem/Lean Dem | Jan ’26 | 3 | 85 | 12 |
| Dem/Lean Dem | Jul ’26 | 2 | 89 | 8 |
Six-in-ten Americans now say that Trump’s economic policies have worsened economic conditions in the country. This is up from the 52% who said this in January and the 53% who held this view last fall.
Most Republicans continue to say Trump’s policies have either improved economic conditions (42%) or not had much of an effect (29%).
But GOP views have become less positive since January. The share of Republicans who say Trump’s policies have worsened conditions has risen from 18% to 28%, while the share saying they have improved conditions has fallen from 57% to 42%.
The vast majority of Democrats continue to say Trump’s economic policies have made the economy worse (89% say this today).
Americans’ economic concerns
Large majorities of Americans remain very concerned about the cost of healthcare, food and consumer goods, and housing. And concern about gas prices has risen sharply: 56% now say they are very concerned about this, up from 34% in January.
| % very concerned | Jan ’26 | Jul ’26 |
|---|---|---|
| The cost of healthcare | 71 | 69 |
| The price of food and consumer goods | 66 | 66 |
| The cost of housing | 62 | 64 |
| The price of gasoline | 34 | 56 |
| The price of electricity | 51 | 54 |
| The role of AI in the economy | — | 49 |
| People who want to work being unable to find jobs | 45 | 44 |
| How the stock market is doing | 20 | 18 |
A narrower majority (54%) of adults say they are very concerned about the price of electricity, while 49% say they are very concerned about the role of artificial intelligence (AI) in the economy.
More than four-in-ten (44%) express a high level of concern about people who want to work not being able to find employment.
In contrast, relatively few Americans (18%) say they are very concerned about how the stock market is doing.
Partisan differences on economic concerns
As has been the case since the start of Trump’s second term, Democrats are more likely than Republicans to express concern about most of the economic issues asked about in the survey.
The widest partisan gaps are on unemployment and the costs of healthcare, housing, and food and other goods.

| % very concerned | Rep/Lean Rep | Dem/Lean Dem |
|---|---|---|
| The cost of healthcare | 58 | 78 |
| The price of food and consumer goods | 55 | 75 |
| The cost of housing | 52 | 73 |
| The price of gasoline | 47 | 60 |
| The price of electricity | 48 | 57 |
| The role of AI in the economy | 45 | 53 |
| People who want to work being unable to find jobs | 29 | 57 |
| How the stock market is doing | 18 | 17 |
On other issues – like the price of gasoline, electricity and the role of AI in the economy – Democrats express more concern than Republicans, but by smaller margins.
Roughly equal shares of Democrats (17%) and Republicans (18%) say they are very concerned about how the stock market is doing.
For full trends on economic concerns by party, refer to Additional charts.
Additional charts
| Group | Date | Better | Worse | About the same as now |
|---|---|---|---|---|
| Total | Feb ’25 | 40 | 37 | 23 |
| Total | Apr ’25 | 36 | 45 | 19 |
| Total | Sep ’25 | 29 | 46 | 24 |
| Total | Jan ’26 | 31 | 38 | 30 |
| Total | Jul ’26 | 23 | 36 | 40 |
| Rep/Lean Rep | Feb ’25 | 73 | 9 | 18 |
| Rep/Lean Rep | Apr ’25 | 65 | 15 | 20 |
| Rep/Lean Rep | Sep ’25 | 55 | 19 | 26 |
| Rep/Lean Rep | Jan ’26 | 57 | 14 | 28 |
| Rep/Lean Rep | Jul ’26 | 41 | 19 | 39 |
| Dem/Lean Dem | Feb ’25 | 10 | 64 | 26 |
| Dem/Lean Dem | Apr ’25 | 8 | 74 | 17 |
| Dem/Lean Dem | Sep ’25 | 6 | 73 | 21 |
| Dem/Lean Dem | Jan ’26 | 8 | 62 | 30 |
| Dem/Lean Dem | Jul ’26 | 7 | 53 | 40 |
| People who want to work being unable to find jobs | |||
|---|---|---|---|
| Total | Rep/Lean Rep | Dem/Lean Dem | |
| 7/12/26 | 44 | 29 | 57 |
| 1/26/26 | 45 | 32 | 59 |
| 9/28/25 | 42 | 26 | 57 |
| 4/13/25 | 41 | 28 | 54 |
| 9/2/24 | 40 | 42 | 38 |
| 1/21/24 | 31 | 30 | 32 |
| 4/2/23 | 27 | 22 | 29 |
| 1/24/23 | 30 | 25 | 34 |
| 10/16/22 | 29 | 25 | 33 |
| 7/4/22 | 27 | 26 | 28 |
| 9/19/21 | 29 | 23 | 34 |
| The cost of housing | |||
| Total | Rep/Lean Rep | Dem/Lean Dem | |
| 7/12/26 | 64 | 52 | 73 |
| 1/26/26 | 62 | 54 | 71 |
| 9/28/25 | 61 | 51 | 71 |
| 4/13/25 | 61 | 51 | 71 |
| 9/2/24 | 69 | 72 | 66 |
| 1/21/24 | 64 | 63 | 66 |
| 4/2/23 | 61 | 58 | 64 |
| 1/24/23 | 60 | 55 | 65 |
| 10/16/22 | 60 | 57 | 62 |
| 7/4/22 | 60 | 59 | 61 |
| 9/19/21 | |||
| The price of gasoline and energy | |||
| Total | Rep/Lean Rep | Dem/Lean Dem | |
| 7/12/26 | 60 | 49 | 68 |
| 1/26/26 | 43 | 40 | 47 |
| 9/28/25 | 45 | 36 | 53 |
| 4/13/25 | 46 | 40 | 51 |
| 1/21/24 | 51 | 64 | 40 |
| 1/24/23 | 60 | 72 | 48 |
| 10/16/22 | 69 | 80 | 58 |
| The price of food and consumer goods | |||
| Total | Rep/Lean Rep | Dem/Lean Dem | |
| 7/12/26 | 66 | 55 | 75 |
| 1/26/26 | 66 | 55 | 75 |
| 9/28/25 | 65 | 52 | 77 |
| 4/13/25 | 67 | 57 | 78 |
| 9/2/24 | 74 | 85 | 64 |
| 1/21/24 | 72 | 82 | 63 |
| 4/2/23 | 72 | 78 | 66 |
| 1/24/23 | 75 | 81 | 69 |
| 10/16/22 | 73 | 81 | 66 |
| How the stock market is doing | |||
| Total | Rep/Lean Rep | Dem/Lean Dem | |
| 7/12/26 | 18 | 18 | 17 |
| 1/26/26 | 20 | 20 | 22 |
| 9/28/25 | 19 | 15 | 23 |
| 4/13/25 | 36 | 24 | 49 |
| 9/2/24 | 24 | 31 | 17 |
| 1/21/24 | 18 | 23 | 14 |
| 4/2/23 | 24 | 31 | 18 |
| 1/24/23 | 26 | 34 | 20 |
| 10/16/22 | 32 | 43 | 24 |
| 7/4/22 | 31 | 41 | 23 |
| The cost of healthcare | |||
| Total | Rep/Lean Rep | Dem/Lean Dem | |
| 7/12/26 | 69 | 58 | 78 |
| 1/26/26 | 71 | 61 | 82 |
| The price of gasoline | |||
| Total | Rep/Lean Rep | Dem/Lean Dem | |
| 7/12/26 | 56 | 47 | 60 |
| 1/26/26 | 34 | 30 | 36 |
| The price of electricty | |||
| Total | Rep/Lean Rep | Dem/Lean Dem | |
| 7/12/26 | 54 | 48 | 57 |
| 1/26/26 | 51 | 45 | 56 |


