The American public’s attitudes toward both the Israeli people and the Israeli government have turned more negative in the past few years. Views of the Palestinian people, the Palestinian Authority and Hamas have held fairly steady, according to a new Pew Research Center survey.
As recently as 2022, Americans viewed the Israeli people much more favorably than they viewed the Palestinian people. Following Hamas’ attack on Israel in October 2023 and the ensuing war, however, U.S. public opinion toward Israelis has grown increasingly negative, while views of Palestinians have not changed much. As a result, Americans now view the Palestinian people nearly as favorably as they view the Israeli people.
Meanwhile, Americans continue to view the Israeli and Palestinian political leadership more negatively than they view the Israeli and Palestinian people. Majorities of Americans express an unfavorable view of the Israeli government, the Palestinian Authority (which controls the West Bank) and Hamas (which has controlled Gaza). In recent years, negative views of the Israeli government have risen sharply, while views of the Palestinian Authority and Hamas have changed little.
(The survey was conducted prior to Hamas’ announcement that it was dissolving its government in Gaza.)
Notably, views of the Israeli people and the Israeli government have worsened in recent years in both U.S. political parties, across age groups and in most religious categories.
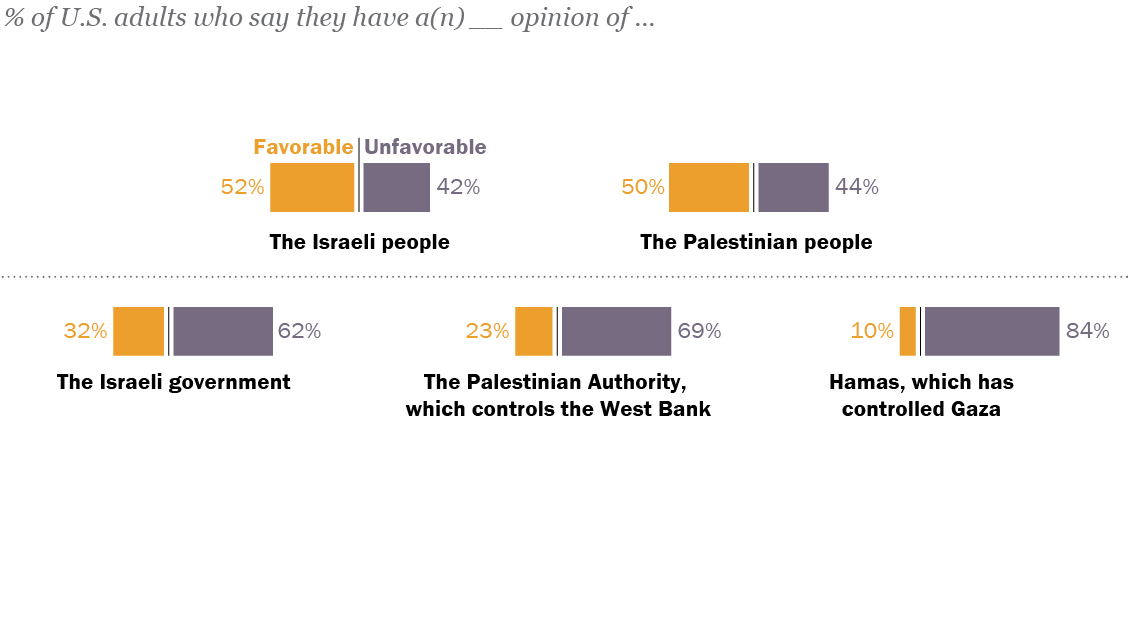
| Group | Response | 2019 | 2022 | 2024 | 2025 | 2026 |
|---|---|---|---|---|---|---|
| The Israeli people | Favorable | 64% | 67% | 64% | 56% | 52% |
| The Israeli people | Unfavorable | 28% | 25% | 28% | 38% | 42% |
| The Israeli people | No answer | 8% | 8% | 8% | 6% | 6% |
| The Palestinian people | Favorable | 46% | 53% | 50% | 52% | 50% |
| The Palestinian people | Unfavorable | 45% | 39% | 41% | 41% | 44% |
| The Palestinian people | No answer | 8% | 8% | 8% | 7% | 7% |
| The Israeli government | Favorable | 41% | 47% | 41% | 35% | 32% |
| The Israeli government | Unfavorable | 51% | 43% | 51% | 59% | 62% |
| The Israeli government | No answer | 9% | 10% | 8% | 6% | 6% |
| The Palestinian Authority, which controls the West Bank | Favorable | NA | NA | 23% | 24% | 23% |
| The Palestinian Authority, which controls the West Bank | Unfavorable | NA | NA | 68% | 68% | 69% |
| The Palestinian Authority, which controls the West Bank | No answer | NA | NA | 9% | 8% | 8% |
| Hamas, which has controlled Gaza | Favorable | NA | NA | 8% | 10% | 10% |
| Hamas, which has controlled Gaza | Unfavorable | NA | NA | 84% | 84% | 84% |
| Hamas, which has controlled Gaza | No answer | NA | NA | 8% | 6% | 7% |
Related: Negative views of Israel, Netanyahu continue to rise among Americans – especially young people
These findings come from a survey of 12,574 Americans conducted May 4-17. That was around two months after the U.S.- and Israeli-led war in Iran began.
Jump ahead to read about differences in Americans’ views by:
How Americans’ views of Israelis, Palestinians and their political leadership vary by party
Republicans and Republican-leaning independents have much more favorable views of the Israeli people and Israeli government than Democrats and Democratic leaners do. On the other hand, Democrats have more favorable views of the Palestinian people, the Palestinian Authority and Hamas than Republicans do. (Few in either party have a favorable view of Hamas.)
Views of the Israeli people and Israeli government have turned more negative among both Republicans and Democrats in recent years. But they have fallen more among Democrats than Republicans, so the partisan gaps in these views have widened since 2022.
Opinions of the Palestinian people have also diverged during this period: Democrats’ views have stayed fairly constant, while Republicans’ views have become more negative.
| Group | Population | 2019 | 2022 | 2024 | 2025 | 2026 |
|---|---|---|---|---|---|---|
| The Israeli people | Rep/lean Rep | 77% | 77% | 76% | 67% | 65% |
| The Israeli people | Dem/lean Dem | 57% | 62% | 58% | 48% | 43% |
| The Palestinian people | Rep/lean Rep | 32% | 40% | 35% | 37% | 33% |
| The Palestinian people | Dem/lean Dem | 58% | 65% | 67% | 70% | 67% |
| The Israeli government | Rep/lean Rep | 61% | 65% | 63% | 55% | 51% |
| The Israeli government | Dem/lean Dem | 26% | 35% | 24% | 18% | 16% |
| The Palestinian Authority, which controls the West Bank | Rep/lean Rep | NA | NA | 14% | 14% | 14% |
| The Palestinian Authority, which controls the West Bank | Dem/lean Dem | NA | NA | 33% | 37% | 33% |
| Hamas, which has controlled Gaza | Rep/lean Rep | NA | NA | 5% | 7% | 6% |
| Hamas, which has controlled Gaza | Dem/lean Dem | NA | NA | 12% | 14% | 13% |
How Americans’ views of Israelis, Palestinians and their political leadership vary by age
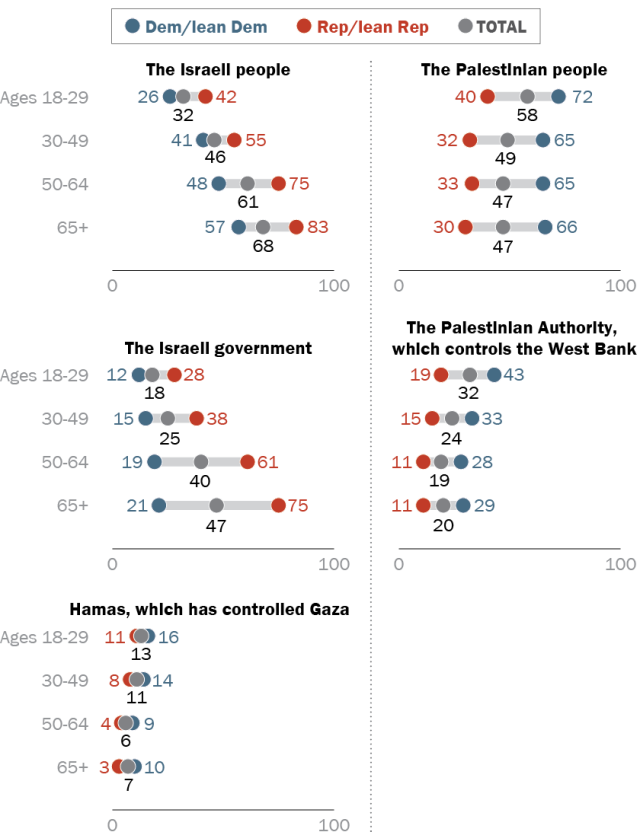
| Group | Age | TOTAL | Rep/lean Rep | Dem/lean Dem |
|---|---|---|---|---|
| The Israeli people | 18-29 | 32% | 42% | 26% |
| The Israeli people | 30-49 | 46% | 55% | 41% |
| The Israeli people | 50-64 | 61% | 75% | 48% |
| The Israeli people | 65+ | 68% | 83% | 57% |
| The Palestinian people | 18-29 | 58% | 40% | 72% |
| The Palestinian people | 30-49 | 49% | 32% | 65% |
| The Palestinian people | 50-64 | 47% | 33% | 65% |
| The Palestinian people | 65+ | 47% | 30% | 66% |
| The Israeli government | 18-29 | 18% | 28% | 12% |
| The Israeli government | 30-49 | 25% | 38% | 15% |
| The Israeli government | 50-64 | 40% | 61% | 19% |
| The Israeli government | 65+ | 47% | 75% | 21% |
| The Palestinian Authority, which controls the West Bank | 18-29 | 32% | 19% | 43% |
| The Palestinian Authority, which controls the West Bank | 30-49 | 24% | 15% | 33% |
| The Palestinian Authority, which controls the West Bank | 50-64 | 19% | 11% | 28% |
| The Palestinian Authority, which controls the West Bank | 65+ | 20% | 11% | 29% |
| Hamas, which has controlled Gaza | 18-29 | 13% | 11% | 16% |
| Hamas, which has controlled Gaza | 30-49 | 11% | 8% | 14% |
| Hamas, which has controlled Gaza | 50-64 | 6% | 4% | 9% |
| Hamas, which has controlled Gaza | 65+ | 7% | 3% | 10% |
U.S. adults under 30 express much more favorable views of the Palestinian people (58%) than of the Israeli people (32%). This pattern is driven largely by young Democrats, who are much more likely to express a positive view of Palestinians (72%) than of Israelis (26%). Republicans under 30 see both groups similarly – a sharp reversal from a few years ago, when they were much more likely to favor Israelis. (Refer to the detailed tables for more on how views have changed by age and party.)
Americans ages 50 and older have significantly more positive views of the Israeli people than of the Palestinian people. This is driven largely by older Republicans, who tend to see Israelis far more favorably than Palestinians. Older Democrats see Palestinians more favorably than Israelis, but by a smaller margin.
Views of Israeli and Palestinian political leadership
Americans of all ages express more favorable attitudes toward the Israeli government than toward Hamas. But adults under 30 view the Palestinian Authority more favorably than the Israeli government.
Democrats differ by age in their views of the Israeli government and Hamas. The youngest Democrats are slightly more likely to view Hamas than the Israeli government favorably. The opposite is true among older Democrats. However, Democrats of all ages have slightly more positive views of the Palestinian Authority than of the Israeli government.
Republicans of all ages are significantly more likely to take a favorable view of the Israeli government than of Hamas and the Palestinian Authority.
How Americans’ views of Israelis, Palestinians and their political leadership vary by religion
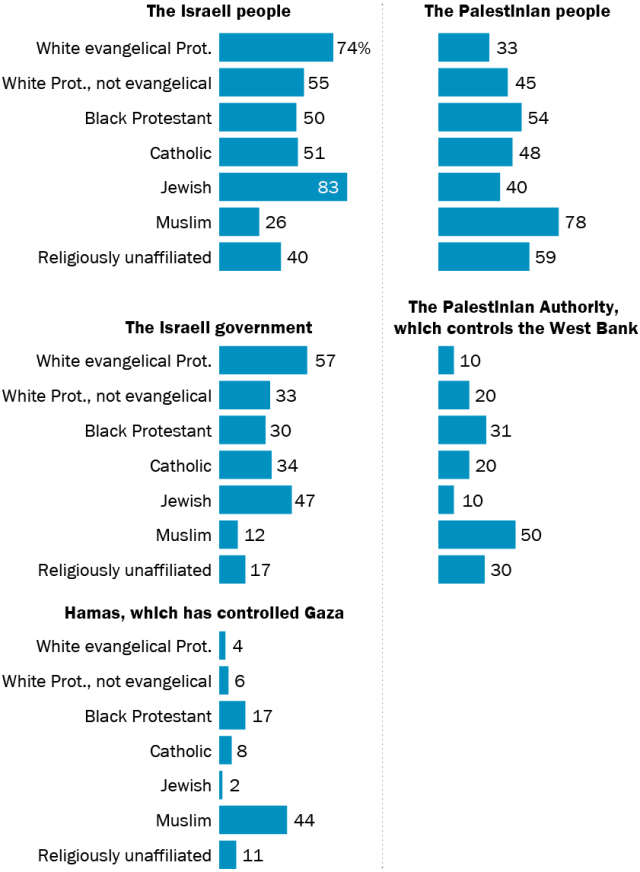
| Group | Religious group | 2026 |
|---|---|---|
| The Israeli people | White evangelical Protestant | 74% |
| The Israeli people | White Protestant, not evangelical | 55% |
| The Israeli people | Black Protestant | 50% |
| The Israeli people | Catholic | 51% |
| The Israeli people | Jewish | 83% |
| The Israeli people | Muslim | 26% |
| The Israeli people | Religiously unaffiliated | 40% |
| The Palestinian people | White evangelical Protestant | 33% |
| The Palestinian people | White Protestant, not evangelical | 45% |
| The Palestinian people | Black Protestant | 54% |
| The Palestinian people | Catholic | 48% |
| The Palestinian people | Jewish | 40% |
| The Palestinian people | Muslim | 78% |
| The Palestinian people | Religiously unaffiliated | 59% |
| The Israeli government | White evangelical Protestant | 57% |
| The Israeli government | White Protestant, not evangelical | 33% |
| The Israeli government | Black Protestant | 30% |
| The Israeli government | Catholic | 34% |
| The Israeli government | Jewish | 47% |
| The Israeli government | Muslim | 12% |
| The Israeli government | Religiously unaffiliated | 17% |
| The Palestinian Authority, which controls the West Bank | White evangelical Protestant | 10% |
| The Palestinian Authority, which controls the West Bank | White Protestant, not evangelical | 20% |
| The Palestinian Authority, which controls the West Bank | Black Protestant | 31% |
| The Palestinian Authority, which controls the West Bank | Catholic | 20% |
| The Palestinian Authority, which controls the West Bank | Jewish | 10% |
| The Palestinian Authority, which controls the West Bank | Muslim | 50% |
| The Palestinian Authority, which controls the West Bank | Religiously unaffiliated | 30% |
| Hamas, which has controlled Gaza | White evangelical Protestant | 4% |
| Hamas, which has controlled Gaza | White Protestant, not evangelical | 6% |
| Hamas, which has controlled Gaza | Black Protestant | 17% |
| Hamas, which has controlled Gaza | Catholic | 8% |
| Hamas, which has controlled Gaza | Jewish | 2% |
| Hamas, which has controlled Gaza | Muslim | 44% |
| Hamas, which has controlled Gaza | Religiously unaffiliated | 11% |
Jews and White evangelical Protestants have more favorable views of the Israeli people and its government than other religious groups do. White evangelical Protestants, in fact, are the only religious group in which a majority (57%) have a favorable view of the Israeli government.
Jewish attitudes toward some of these groups have shifted since 2024:
- 83% of Jews now view the Israeli people favorably, down from 89%.
- 47% of Jews now view the Israeli government favorably, down from 54%.
Meanwhile, Muslims, Black Protestants and religiously unaffiliated Americans – those who identify religiously as atheist, agnostic or “nothing in particular” – have more favorable views of the Palestinian people and the Palestinian Authority than other groups do.
Differences among religious groups by age
Jewish adults under the age of 50 are less likely than older Jews to have favorable views of the Israeli people (76% vs. 88%) and the Israeli government (41% vs. 52%). Since 2024, younger Jews’ views of the Israeli people have grown less favorable, while their views of other groups have held relatively steady. Older Jews’ views of the Israeli people have also declined some, as have their views of the Israeli government. But their views of other groups are relatively stable.
We weren’t able to survey enough Muslims to show how their views differ by age.
Note: Here are the questions used for this analysis, along with responses and the survey methodology.