

Left-Out Left are a Democratic-oriented group marked by low expectations of the political system and a feeling that they are not well-represented. They largely doubt that political action will meaningfully improve their lives. And while they like the Democratic Party considerably more than the Republican Party, their evaluations of Democrats are lukewarm at best.

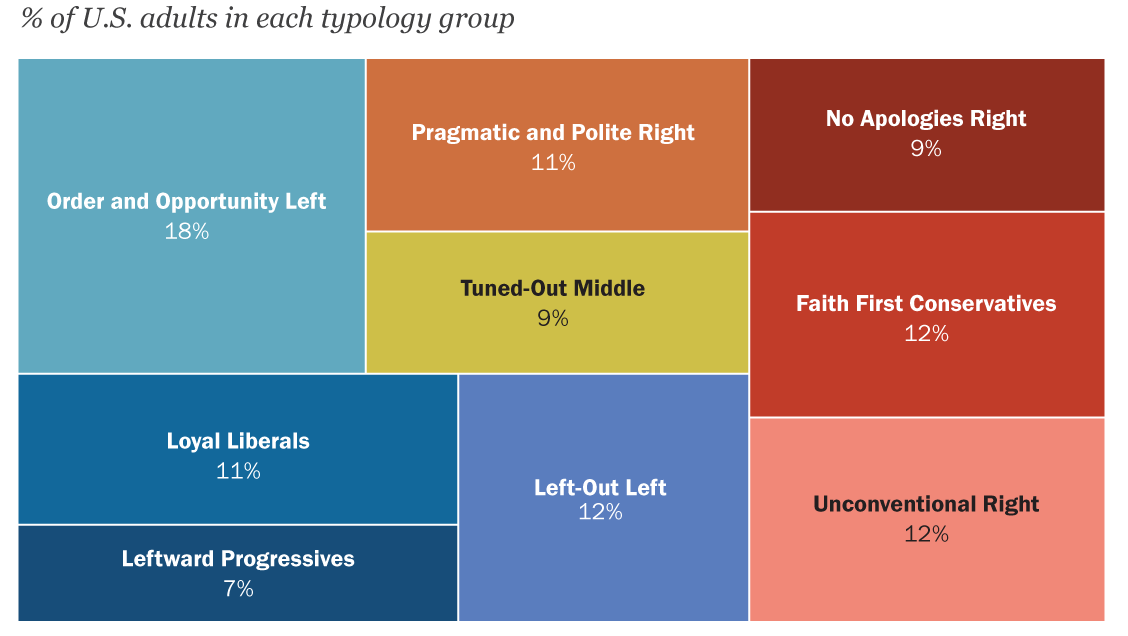
Left-Out Left are one of nine groups in Pew Research Center’s 2026 Political Typology. To learn more about the typology, start with the overview. To find which group is your best fit, take the quiz.
Left-Out Left are liberal in their orientation toward the role of government in supporting social welfare. They say the government has a responsibility to ensure that Americans have healthcare coverage, adequate income in retirement and a high-quality K-12 education. They also have doubts about the fairness of the economic system and the power and profits of large corporations.
They hold left-leaning, though somewhat moderate, views on gender and sexuality. They are broadly accepting of same-sex marriage and have fairly progressive views on gender roles – but they hold these views much less strongly than groups to their left. Their views are more mixed when it comes to gender identity. Most are at least somewhat comfortable with people using pronouns like “they” rather than “he” or “she” to describe themselves, but a clear majority have reservations about transgender athletes competing on sports teams that don’t match their sex at birth.
Left-Out Left are:
- Relatively young – 74% are younger than 50.
- Racially and ethnically diverse – 46% are White, 25% are Hispanic, 14% are Black and 7% are Asian.
- Largely working class – 65% describe themselves as working class, and 70% do not have a bachelor’s degree.
- Deeply skeptical and disaffected – 78% lack confidence in the future of the political system in the country.
Political affiliation, voting and engagement
Though Left-Out Left have a clear Democratic tilt, most are not strongly tied to the Democratic Party. More than three-in-ten (36%) identify as Democrats, and 38% are independents who lean toward the Democratic Party. An additional 12% are independents who lean toward the GOP, but very few (3%) identify as Republicans. About one-in-ten do not lean toward either party (11%).
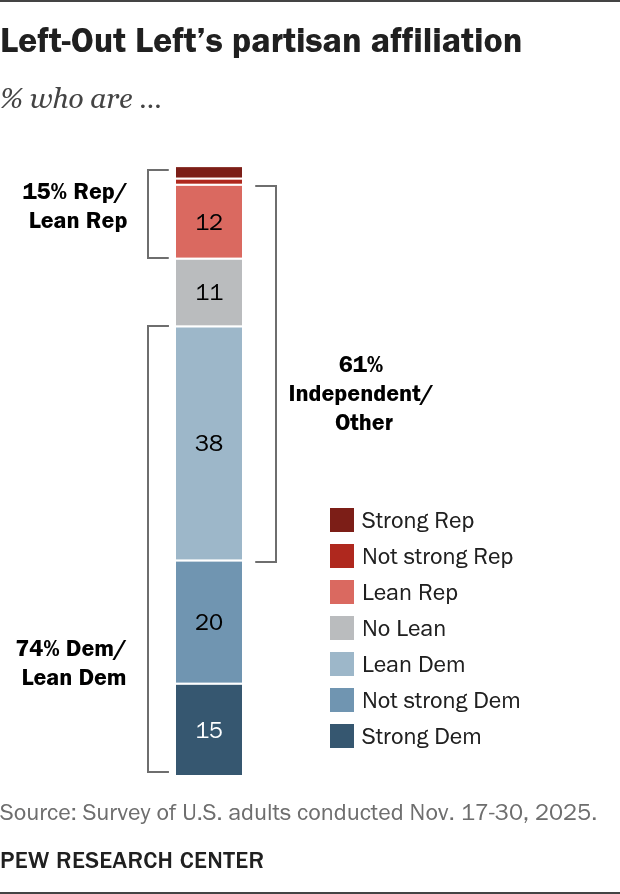
| Strong Dem | Not strong Dem | Lean Dem | No Lean | Lean Rep | Not strong Rep | Strong Rep | |
|---|---|---|---|---|---|---|---|
| Left-Out Left | 15% | 20% | 38% | 11% | 12% | 1% | 2% |
A majority describe themselves as moderate (55%), with an additional 33% identifying as liberal.
Many have unfavorable views of both parties (42%). But they have more intensely negative views of the GOP than the Democrats (74% give Republicans a “cold” rating on a feeling thermometer, while 35% say the same of Democrats).
Left-Out Left are generally less politically engaged:
- 42% voted in the 2024 presidential election. Of those who voted, most supported Kamala Harris (83%).
- Just 18% say they follow what’s going on in politics most of the time (a third of Americans overall say this).
- 59% say it really matters which party wins control of Congress in the 2026 elections, on par with the 60% of the public overall that says this.
Key attitudes and beliefs
Left-Out Left are downbeat about the state of politics today. More than half wish there were more political parties to choose from, and 57% say the country can’t solve many of its problems.
| Leftward Progressives | |
| Loyal Liberals | |
| Left-Out Left |
| Order and Opportunity Left | |
| Tuned-Out Middle | |
| Pragmatic and Polite Right |
| Unconventional Right | |
| Faith First Conservatives | |
| No Apologies Right |
This country can’t solve many of its important problems
They have confidence in the police to act in the public’s best interest
Abortion should be legal in all or most cases
They favor keeping large numbers of immigrants in detention centers while their cases are decided
They are bothered a lot by the feeling wealthy people don’t pay their fair share in federal taxes
Someone can be a man or a woman even if that is different from their sex at birth
| Typology group | This country can’t solve many of its important problems | They have confidence in the police to act in the public’s best interest | Abortion should be legal in all or most cases | They favor keeping large numbers of immigrants in detention centers while their cases are decided | They are bothered a lot by the feeling wealthy people don’t pay their fair share in federal taxes | Someone can be a man or a woman even if that is different from their sex at birth |
|---|---|---|---|---|---|---|
| Leftward Progressives | 53% | 29% | 98% | 1% | 92% | 96% |
| Loyal Liberals | 40% | 66% | 95% | 3% | 91% | 83% |
| Left-Out Left | 57% | 49% | 83% | 12% | 78% | 45% |
| Order and Opportunity Left | 37% | 70% | 70% | 19% | 69% | 27% |
| Tuned-Out Middle | 40% | 67% | 49% | 34% | 50% | 28% |
| Pragmatic and Polite Right | 38% | 85% | 51% | 33% | 61% | 15% |
| Unconventional Right | 31% | 79% | 56% | 54% | 48% | 11% |
| Faith First Right | 20% | 86% | 16% | 73% | 35% | 2% |
| No Apologies Conservatives | 13% | 87% | 26% | 86% | 21% | 1% |
Many express concerns about wealthy people not paying their fair share of taxes, and a sizable share hold negative views of billionaires (46% say they are bad for the country).
Left-Out Left have moderate, and nuanced, views on immigration policy. Roughly four-in-ten (38%) view border security as extremely or very important for the United States. A majority think there should be a path to legal status for most immigrants in the country illegally, and they do not support many of the restrictive immigration policies of the current administration.
Left out and left behind

| Leftward Progressives | Loyal Liberals | Left-Out Left | Order & Opportunity Left | Tuned-Out Middle | Pragmatic & Polite Right | Unconventional Right | Faith First Conservatives | No Apologies Right | General public | |
|---|---|---|---|---|---|---|---|---|---|---|
| In recent elections, there has been a candidate who shares their views at least sometimes | 70% | 85% | 53% | 71% | 77% | 71% | 73% | 76% | 82% | 73% |
| Voting gives people like them some say about how government runs things | 67% | 78% | 43% | 58% | 48% | 63% | 48% | 69% | 71% | 60% |
By several measures, Left-Out Left feel on the outskirts of politics.
They are far less likely than those in other groups to say there has been a candidate who shares their views in recent elections: 53% say this, compared with at least 70% of those in other groups.
And they are the only group in which fewer than half say voting gives people like them a say in how government runs things.
More broadly, people in this group are highly skeptical of politicians. Three-quarters say few or no elected officials ran to serve the public – the highest of any typology group. They also doubt that many officials actually ran to address issues that they care about, while saying all or most ran to make a lot of money.
Jump to the detailed tables to learn more about Left Out Left and the other typology groups.


