
Traditional public opinion polls are often marked by the diverse views they show within a population. While the broad contours of public sentiment are often clear, there are very few opinions that are universally held. By the same token, most of the answer choices on a typical survey question – from the extreme to the middle-of-the-road – are selected by at least a modest number of respondents.
In our analysis of synthetic polling, AI respondents tended to eliminate a great deal of this diversity. On some questions, the model assumed most Americans’ views are far more extreme than they actually are. On others, it assigned the vast majority of respondents to the middle category in a set of choices. And across questions of all types, our AI survey-takers collectively avoided certain answer choices in ways that have no parallel among their human counterparts.
Even if the model’s results point in the same general direction as true public opinion, they ultimately paint a picture that is less diverse and more one-note than what we see in actual polls of human respondents.
This analysis is part of a larger evaluation of AI-generated synthetic samples in public opinion research. Read a summary of the main findings and refer to the methodology for more details on how we conducted our synthetic poll and compared it with real survey results.
How synthetic polls represent attitudes and opinions
On numerous questions in our surveys, our synthetic poll gave the appearance of a public that is far more lockstep – and often far more certain – in its attitudes than it actually is.
A question about whether the United States or China benefits more from trade between the two countries is a good example. Our synthetic poll estimated that fully 98% of Americans think China benefits more from that relationship. That’s 56 percentage points higher than the real share of U.S. adults who feel this way. It also obscures notable shares who feel that the U.S. benefits more (10%), who say both countries benefit equally (24%), and who say they aren’t sure (19%).
And on a series of questions about the changing influence of different countries on the global stage, the model tended to gravitate toward certain answer choices for no apparent reason. Our AI poll estimated that:
- 88% of Americans think India has been getting stronger in recent years (while the actual share is 30%).
- 77% say Canada has been getting weaker (actually 23%).
- 100% say China has been getting stronger (actually 62%).
- 92% say Iran’s influence has stayed the same (actually 33%).
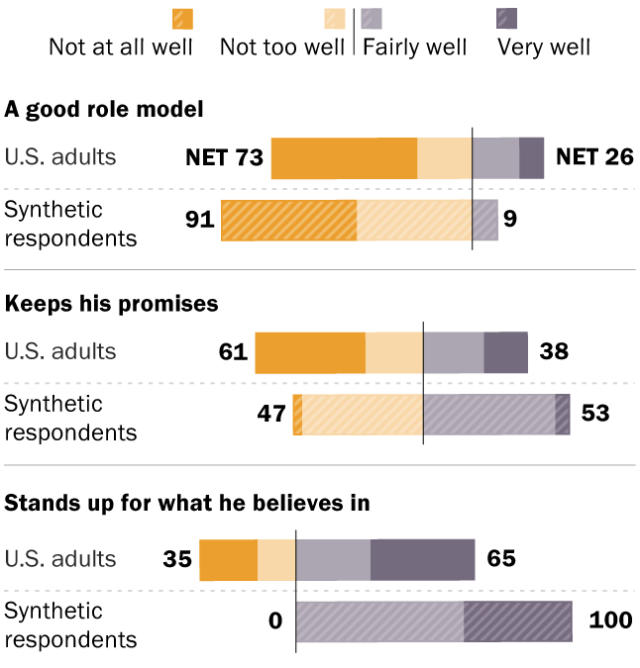
“Can AI Stand In for Human Survey-Takers? Not Really”
| Item | Response | U.S. adults | Synthetic respondents |
|---|---|---|---|
| A good role model | Very well | 9 | 0 |
| A good role model | Fairly well | 17 | 9 |
| A good role model | Not too well | 20 | 42 |
| A good role model | Not at all well | 53 | 49 |
| Keeps his promises | Very well | 16 | 5 |
| Keeps his promises | Fairly well | 22 | 48 |
| Keeps his promises | Not too well | 21 | 44 |
| Keeps his promises | Not at all well | 40 | 3 |
| Stands up for what he believes in | Very well | 38 | 39 |
| Stands up for what he believes in | Fairly well | 27 | 61 |
| Stands up for what he believes in | Not too well | 14 | 0 |
| Stands up for what he believes in | Not at all well | 21 | 0 |
“Can AI Stand In for Human Survey-Takers? Not Really”
Broadly speaking, our model had a tendency to steer away from choices at the end of scales (like “very well” or “not at all well”) and toward middle choices like “somewhat.” On a series of questions about President Donald Trump’s personal characteristics, 0% of our AI respondents said that phrases like “honest,” “mentally sharp” or “cares about the needs of ordinary people” describe him very well. In reality, anywhere from one-in-ten to one-in-four Americans say these describe the president very well.
At the same time, this trend was not always consistent across questions – or even within the same set of questions. When presented with a list of 13 different issues facing the country, a substantially larger share of AI respondents than human panelists described several as a “very big problem.” There were only four issues for which the more extreme option was chosen by our human panelists more often.
How synthetic polls represent reported behaviors
AI-generated survey responses also fail to capture the full diversity of experiences humans report about their own lives. This can be seen clearly in a series of questions we asked about Americans’ sleep and travel habits.
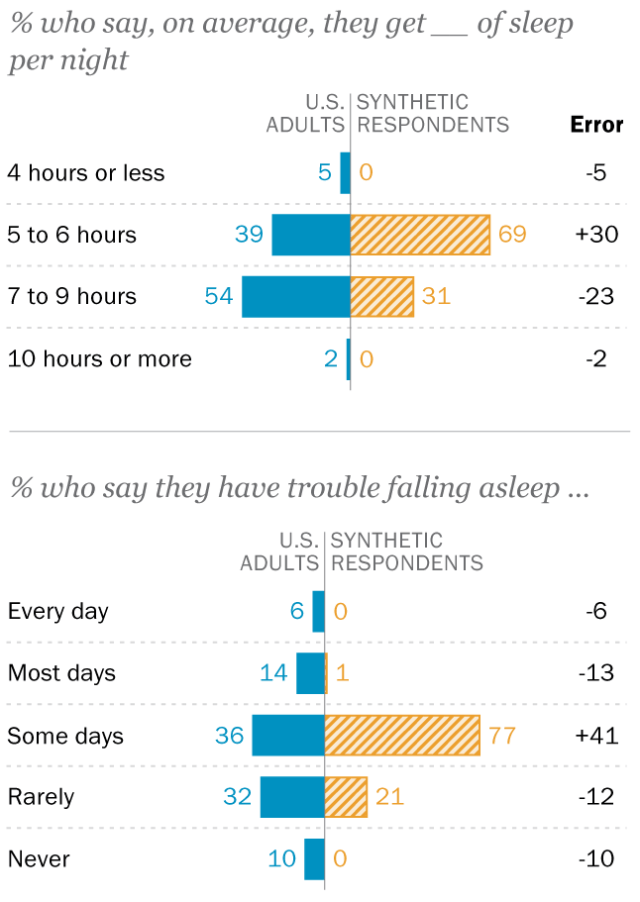
“Can AI Stand In for Human Survey-Takers? Not Really”
| Hours of sleep | 4 hours of sleep or less | 5 to 6 hours of sleep | 7 to 9 hours of sleep | 10 hours of sleep or more | |
|---|---|---|---|---|---|
| U.S. adults | 5 | 39 | 54 | 2 | |
| Synthetic respondents | 0 | 69 | 31 | 0 | |
| Trouble falling asleep | Every day | Most days | Some days | Rarely | Never |
| U.S. adults | 6 | 14 | 36 | 33 | 10 |
| Synthetic respondents | 0 | 1 | 77 | 21 | 0 |
“Can AI Stand In for Human Survey-Takers? Not Really”
On a question about how often people have trouble falling asleep, fully 98% of synthetic respondents say they experience this some days or rarely. Although a majority of Americans choose one of these two options, 30% in total say this happens to them every day, most days or never. The synthetic poll also lumps the vast majority of Americans into the “some days” category on a similar question about how often they have trouble staying asleep.
When it comes to how much sleep they get per night, the synthetic poll overstated the share of Americans who get five to six hours of sleep per night while understating the share who get seven to nine hours of sleep. The synthetic poll also estimated that no Americans get very little (four hours or less) or quite a bit (10 hours or more) of sleep in a night – but in reality, nearly one-in-ten Americans fall into one of these categories.
And on a question about the number of countries people have visited outside the United States, the synthetic poll was fairly close to the actual population on most response options. But it estimated that just 1% of Americans have visited 10 or more countries. In reality, 13% of U.S. adults say that they have done this.
Synthetic respondents often avoid certain answer choices entirely
On a typical Pew Research Center survey, it’s rare for a single answer choice on a given question to get zero responses. This did not happen on any of the questions across the three original survey waves we evaluated for this study.
These “zero selection” response options occurred much more often in our AI survey. Fully 47% of questions in our synthetic poll had at least one answer choice that was not selected by a single synthetic respondent.
This disparity between the human and synthetic respondents is also visible at other thresholds:
- Just 1% of questions in our human poll had a response option that was selected by fewer than 1% of respondents, versus 66% of questions on the synthetic poll.
- 27% of questions in the human poll had a response option selected by fewer than 5% of respondents, versus 77% of questions on the synthetic poll.


