
Three-in-ten Americans now approve of the way Donald Trump is handling his job as president, while 68% disapprove.
Trump’s approval rating has dropped substantially over the course of his second term – his current rating is comparable to the lowest rating of his first term (29% according to a Pew Research Center survey conducted in the days between Jan. 6, 2021, and the end of his first term).
Confidence in Trump’s handling of several key issues, including the economy, foreign policy and immigration, is also lower than at the beginning of his term. Also, most Americans (69%) say they have little confidence in Trump to keep his business interests separate from his presidential decision-making.
This is part of a larger report on the attitudes and dynamics shaping the 2026 midterm elections.
Trump’s approval among his 2024 voters
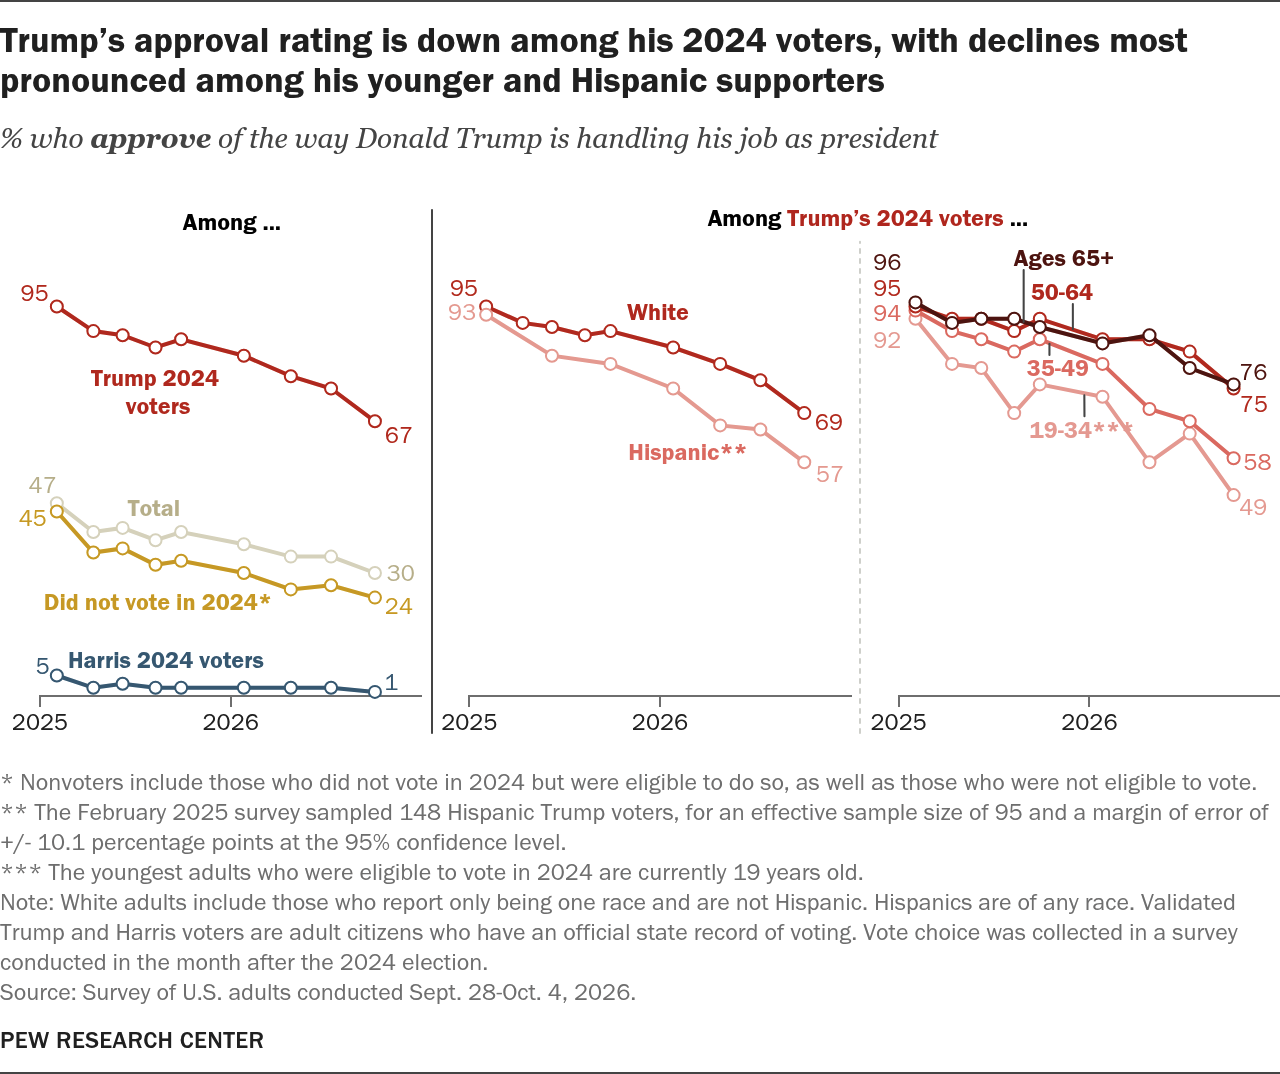
The decline in Trump’s approval ratings is particularly pronounced among those who voted for him in 2024, and among those who did not vote:
- 67% of Trump’s 2024 voters now approve of his performance, down from 75% in July, 83% at the beginning of this year and 95% early in his second term.
- Today, 24% of those who did not vote in 2024 approve of Trump’s performance.
Among Trump’s own 2024 voters, his approval rating is down particularly among Hispanic voters and younger voters:
** The February 2025 survey sampled 148 Hispanic Trump voters, for an effective sample size of 95 and a margin of error of +/- 10.1 percentage points at the 95% confidence level.
*** The youngest adults who were eligible to vote in 2024 are currently 19 years old.
Note: White adults include those who report only being one race and are not Hispanic. Hispanics are of any race. Validated Trump and Harris voters are adult citizens who have an official state record of voting. Vote choice was collected in a survey conducted in the month after the 2024 election.
| Date | Panel | Total | Trump 2024 voters | Harris 2024 voters | Did not vote in 2024 | White | Hispanic | Ages 19-34 | Ages 35-49 | Ages 50-64 | Ages 65+ |
|---|---|---|---|---|---|---|---|---|---|---|---|
| 2026-10-04 | Overall | 30 | 67 | 1 | 24 | — | — | — | — | — | — |
| 2026-07-12 | Overall | 34 | 75 | 2 | 27 | — | — | — | — | — | — |
| 2026-04-26 | Overall | 34 | 78 | 2 | 26 | — | — | — | — | — | — |
| 2026-01-26 | Overall | 37 | 83 | 2 | 30 | — | — | — | — | — | — |
| 2025-09-28 | Overall | 40 | 87 | 2 | 33 | — | — | — | — | — | — |
| 2025-08-10 | Overall | 38 | 85 | 2 | 32 | — | — | — | — | — | — |
| 2025-06-08 | Overall | 41 | 88 | 3 | 36 | — | — | — | — | — | — |
| 2025-04-13 | Overall | 40 | 89 | 2 | 35 | — | — | — | — | — | — |
| 2025-02-02 | Overall | 47 | 95 | 5 | 45 | — | — | — | — | — | — |
| 2026-10-04 | Race | — | — | — | — | 69 | 57 | — | — | — | — |
| 2026-07-12 | Race | — | — | — | — | 77 | 65 | — | — | — | — |
| 2026-04-26 | Race | — | — | — | — | 81 | 66 | — | — | — | — |
| 2026-01-26 | Race | — | — | — | — | 85 | 75 | — | — | — | — |
| 2025-09-28 | Race | — | — | — | — | 89 | 81 | — | — | — | — |
| 2025-08-10 | Race | — | — | — | — | 88 | — | — | — | — | |
| 2025-06-08 | Race | — | — | — | — | 90 | 83 | — | — | — | — |
| 2025-04-13 | Race | — | — | — | — | 91 | — | — | — | — | |
| 2025-02-02 | Race | — | — | — | — | 95 | 93 | — | — | — | — |
| 2026-10-04 | Age | — | — | — | — | — | — | 49 | 58 | 75 | 76 |
| 2026-07-12 | Age | — | — | — | — | — | — | 64 | 67 | 84 | 80 |
| 2026-04-26 | Age | — | — | — | — | — | — | 57 | 70 | 87 | 88 |
| 2026-01-26 | Age | — | — | — | — | — | — | 73 | 81 | 87 | 86 |
| 2025-09-28 | Age | — | — | — | — | — | — | 76 | 87 | 92 | 90 |
| 2025-08-10 | Age | — | — | — | — | — | — | 69 | 84 | 89 | 92 |
| 2025-06-08 | Age | — | — | — | — | — | — | 80 | 87 | 92 | 92 |
| 2025-04-13 | Age | — | — | — | — | — | — | 81 | 89 | 92 | 91 |
| 2025-02-02 | Age | — | — | — | — | — | — | 92 | 94 | 95 | 96 |
** The February 2025 survey sampled 148 Hispanic Trump voters, for an effective sample size of 95 and a margin of error of +/- 10.1 percentage points at the 95% confidence level.
*** The youngest adults who were eligible to vote in 2024 are currently 19 years old.
Note: White adults include those who report only being one race and are not Hispanic. Hispanics are of any race. Validated Trump and Harris voters are adult citizens who have an official state record of voting. Vote choice was collected in a survey conducted in the month after the 2024 election.
- 57% of Trump’s 2024 Hispanic backers now approve of his performance in office, compared with 69% of White 2024 Trump voters.
- 49% of 2024 Trump voters ages 19 to 34 and 58% of those 35 to 49 approve, compared with 76% of 2024 Trump voters ages 50 and older.
Hardly any of those who voted for Kamala Harris in 2024 (1%) approve of Trump’s performance in office – this is little changed over the course of his term.
For more on Trump’s job approval rating among demographic groups, explore the detailed tables.
Confidence in Trump on key issues declines
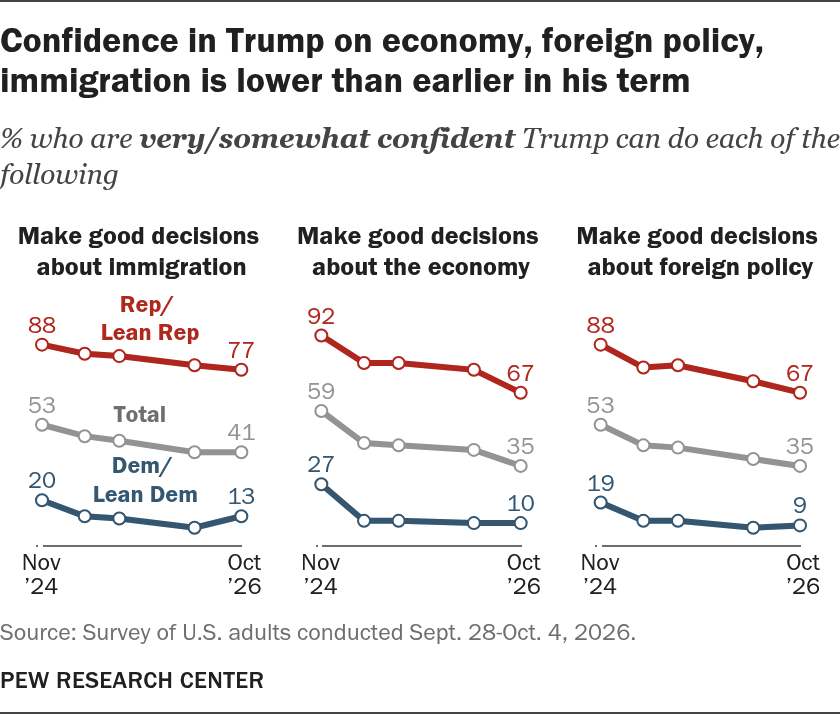
Public confidence in Trump on several key issues has declined over his term
For example, 35% of Americans now say they are very or somewhat confident in Trump to make good decisions about economic policy – down 7 percentage points since April and 10 percentage points since April 2025.
| Date | Statement | Total | Rep/Lean Rep | Dem/Lean Dem | panel |
|---|---|---|---|---|---|
| 2024-11-17 | Make good decisions about immigration | 53 | 88 | 20 | 1 |
| 2025-04-13 | Make good decisions about immigration | 48 | 84 | 13 | 1 |
| 2025-08-10 | Make good decisions about immigration | 46 | 83 | 12 | 1 |
| 2026-04-26 | Make good decisions about immigration | 41 | 79 | 8 | 1 |
| 2026-10-04 | Make good decisions about immigration | 41 | 77 | 13 | 1 |
| 2024-11-17 | Make good decisions about the economy | 59 | 92 | 27 | 2 |
| 2025-04-13 | Make good decisions about the economy | 45 | 80 | 11 | 2 |
| 2025-08-10 | Make good decisions about the economy | 44 | 80 | 11 | 2 |
| 2026-04-26 | Make good decisions about the economy | 42 | 77 | 10 | 2 |
| 2026-10-04 | Make good decisions about the economy | 35 | 67 | 10 | 2 |
| 2024-11-17 | Make good decisions about foreign policy | 53 | 88 | 19 | 3 |
| 2025-04-13 | Make good decisions about foreign policy | 44 | 78 | 11 | 3 |
| 2025-08-10 | Make good decisions about foreign policy | 43 | 79 | 11 | 3 |
| 2026-04-26 | Make good decisions about foreign policy | 38 | 72 | 8 | 3 |
| 2026-10-04 | Make good decisions about foreign policy | 35 | 67 | 9 | 3 |
Two-thirds of Republicans now express confidence in Trump on this issue, down from 77% in April of this year and 80% in April of last year. One-in-ten Democrats express confidence on this issue – little changed over his term.
Public confidence in Trump on foreign policy and immigration is also lower than it was earlier in his term.
Americans’ confidence in Trump on working with Democrats, governing is down
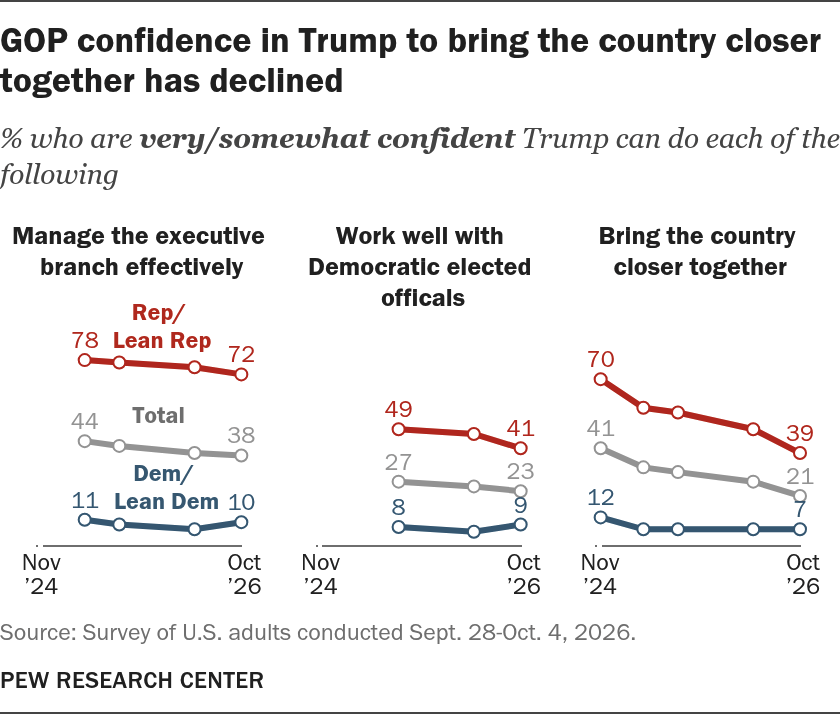
About two-in-ten Americans (21%) now say they have confidence in Trump to bring the country closer together. This is a drop from 33% who said this at the beginning of his term, with the decline driven largely by changing GOP views. About four-in-ten Republicans (39%) now say they have confidence in Trump to do this, down 19 points from April 2025.
| Date | Statement | Total | Rep/Lean Rep | Dem/Lean Dem | |
|---|---|---|---|---|---|
| 2025-04-13 | Manage the executive branch effectively | 44 | 78 | 11 | 1 |
| 2025-08-10 | Manage the executive branch effectively | 42 | 77 | 9 | 1 |
| 2026-04-26 | Manage the executive branch effectively | 39 | 75 | 7 | 1 |
| 2026-10-04 | Manage the executive branch effectively | 38 | 72 | 10 | 1 |
| 2025-08-10 | Work well with Democratic elected officals | 27 | 49 | 8 | 2 |
| 2026-04-26 | Work well with Democratic elected officals | 25 | 47 | 6 | 2 |
| 2026-10-04 | Work well with Democratic elected officals | 23 | 41 | 9 | 2 |
| 2024-11-17 | Bring the country closer together | 41 | 70 | 12 | 3 |
| 2025-04-13 | Bring the country closer together | 33 | 58 | 7 | 3 |
| 2025-08-10 | Bring the country closer together | 31 | 56 | 7 | 3 |
| 2026-04-26 | Bring the country closer together | 27 | 49 | 7 | 3 |
| 2026-10-04 | Bring the country closer together | 21 | 39 | 7 | 3 |
Public opinion of Trump’s ability to manage the executive branch and work well with Democrats has decreased modestly since early in his term: 38% of Americans, including 72% of Republicans, now say they have confidence in Trump to manage the executive branch. Fewer (23%) see him as able to work well with Democrats.
Full trends on confidence in Trump on other issues can be found in the appendix.
How confident are Americans that Trump keeps his business interests separate from his presidential role?
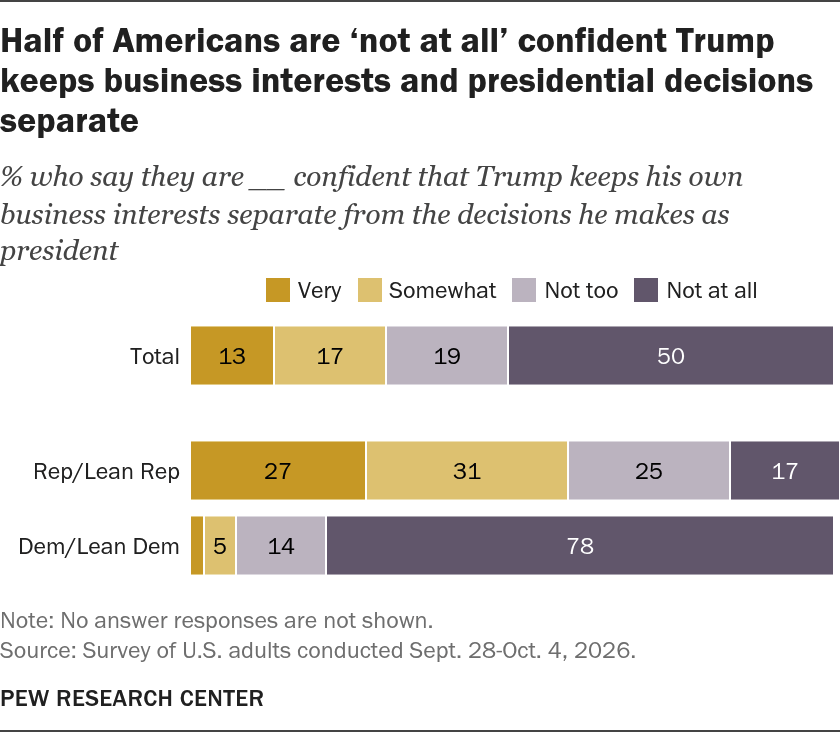
Three-in-ten Americans say they are very or somewhat confident that Trump keeps his business interests separate from the decisions he makes as president. More than twice that share (69%) say they are not too or not at all confident in this.
Views among Republicans
| Group | Very | Somewhat | Not too | Not at all | Grouping |
|---|---|---|---|---|---|
| Total | 13 | 17 | 19 | 50 | total |
| Rep/Lean Rep | 27 | 31 | 25 | 17 | x |
| Dem/Lean Dem | 2 | 5 | 14 | 78 | x |
A majority of Republicans (58%) express at least some confidence that Trump keeps his business interests and presidential actions separate, including 27% who are very confident.
Views among Democrats
Just 7% of Democrats are very or somewhat confident that Trump keeps his business interests and decisions as president separate. Nearly eight-in-ten Democrats (78%) say they are not at all confident.


