
Pew Research Center conducted this study to understand how Americans voted in 2022 and how their turnout and vote choices differed from 2016, 2018 and 2020. For this analysis, we surveyed U.S. adults online and verified their turnout in the four general elections using commercial voter files that aggregate publicly available official state turnout records. Panelists who said they voted and for whom a record of voting was located are considered validated voters; all others are presumed not to have voted.
The analysis in this report relies on two slightly different sets of data drawn from the same pool of panelists.
Comparisons of 2022, 2020, 2018 and 2016
Much of this report describes the 2022 vote broken down by various groups in the population, taken from the 2022 post-election survey (described below), with similar reporting from post-election surveys conducted after the 2016 presidential, 2018 congressional and 2020 presidential elections. Estimates for 2016 and 2018 in this part of the report are identical to those published in Pew Research Center’s earlier reports and rely solely on the relevant post-election surveys at the time.
Results from 2020 reported here and in the online detailed tables may be slightly different than those in the 2020 version of the report because we revised our statistical approach for the 2020 survey. We did this to give us more confidence in the precision of our estimates for some of the groups of voters we discuss in this report. The new weighting made no difference in any substantive conclusions from the 2020 report. More detail about the revision of the 2020 estimates can be found at the end of this Methodology chapter.
Analysis of individual-level change over time
The other part of this report (Chapter 1) examines change and continuity in turnout and vote choice among individual panelists. For this analysis we attempted to measure voter turnout and vote choice for the 2016, 2018, 2020 and 2022 elections for all panelists who took the 2022 and 2020 post-election surveys, including respondents who were not members of the panel at the time of the earlier surveys.
The post-election surveys used in this report were conducted Nov. 29-Dec. 12, 2016; Nov. 7-16, 2018; Nov. 12-17, 2020; and Nov. 16-27, 2022. Everyone who took part is a member of the Center’s ATP. The surveys are weighted to be representative of the U.S. adult population by gender, race, ethnicity, partisan affiliation, education, and many other characteristics, as described below.
The American Trends Panel survey methodology
The American Trends Panel (ATP), created by Pew Research Center, is a nationally representative panel of randomly selected U.S. adults. Panelists participate via self-administered web surveys. Panelists who do not have internet access at home are provided with a tablet and wireless internet connection. Interviews are conducted in both English and Spanish. The panel is being managed by Ipsos.
This report is based on interviews from four separate waves of the panel, ATP Waves 23, 39, 78 and 117, conducted Nov. 29-Dec. 12, 2016; Nov. 7-16, 2018; Nov. 12-17, 2020; and Nov. 16-27, 2022, respectively. Panelists participate via self-administered web surveys. Panelists who do not have internet access are provided with a tablet and wireless internet connection. Interviews are conducted in both English and Spanish. At the time of the Nov. 29-Dec. 12, 2016, survey, the panel was managed by Abt Associates, and it is currently being managed by Ipsos, which oversaw data collection for the 2018 and 2020 surveys.
This report focuses on the 2022 election, relying on data from the panel wave conducted Nov. 16-27, 2022, supplemented with data from the other three post-election waves along with panelist profile data (collected in annual surveys of all members of the panel) and additional surveys. A total of 11,377 panelists responded out of 12,402 who were sampled, for a response rate of 92%. The cumulative response rate accounting for nonresponse to the recruitment surveys and attrition is 4%. The break-off rate among panelists who logged on to the survey and completed at least one item is 1%. The margin of sampling error for the full sample of 11,377 respondents is plus or minus 1.5 percentage points.
Panel recruitment
The ATP was created in 2014, with the first cohort of panelists invited to join the panel at the end of a large, national, landline and cellphone random-digit-dial survey that was conducted in both English and Spanish. Two additional recruitments were conducted using the same method in 2015 and 2017, respectively. Across these three surveys, a total of 19,718 adults were invited to join the ATP, of whom 9,942 (50%) agreed to participate.
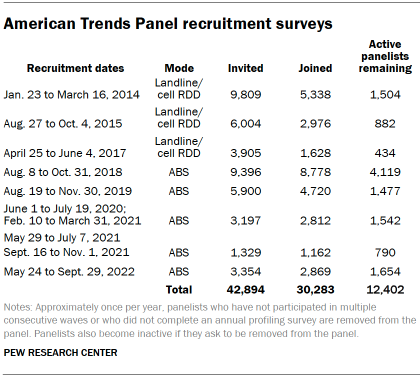
In August 2018, the ATP switched from telephone to address-based recruitment. Invitations were sent to a stratified, random sample of households selected from the U.S. Postal Service’s Delivery Sequence File. Sampled households receive mailings asking a randomly selected adult to complete a survey online. A question at the end of the survey asks if the respondent is willing to join the ATP. In 2020 and 2021 another stage was added to the recruitment. Households that did not respond to the online survey were sent a paper version of the questionnaire, $5 and a postage-paid return envelope. A subset of the adults who returned the paper version of the survey were invited to join the ATP. This subset of adults received a follow-up mailing with a $10 pre-incentive and invitation to join the ATP.
Across the five address-based recruitments, a total of 23,176 adults were invited to join the ATP, of whom 20,341 agreed to join the panel and completed an initial profile survey. In each household, one adult was selected and asked to go online to complete a survey, at the end of which they were invited to join the panel. Of the 30,283 individuals who have ever joined the ATP, 12,402 remained active panelists and continued to receive survey invitations at the time this survey was conducted.
The U.S. Postal Service’s Delivery Sequence File has been estimated to cover as much as 98% of the population, although some studies suggest that the coverage could be in the low 90% range.1 The American Trends Panel never uses breakout routers or chains that direct respondents to additional surveys.
Vote choice measures for panelists who did not participate in the 2016, 2018 or 2020 surveys
In addition to the comparisons of how different groups in the population voted over time, the current report focuses on how individual panelists’ turnout and vote choice changed over time. A large number of people who participated in the 2022 post-election survey had not been on the panel or did not respond to the 2016, 2018 or 2020 post-election surveys at the time they were conducted. For these panelists, their vote choices for 2016, 2018 or 2020 were measured after the fact.
For panelists who did not take the 2016 post-election survey, 2016 vote choice was measured on either of three annual profile surveys, depending on when they joined the panel. These were conducted May 30-Oct. 23, 2017; Aug. 20-Oct. 28, 2018; and Aug. 3-16, 2020. In all cases, the vote choice question asked whether panelists voted for Hillary Clinton, Donald Trump or someone else. People who joined the panel in 2021 or 2022 were not asked about turnout and participation in the 2016 election.
For panelists who did not take the 2018 post-election survey, 2018 vote choice was measured in the 2020 annual profile survey, conducted Aug. 3-16, 2020. The vote choice question for the U.S. House of Representatives asked whether panelists voted for the Democratic Party’s candidate, the Republican Party’s candidate, or another candidate. As with the 2016 findings, these were used to supplement the 2018 post-election survey for the analysis of individual-level change.
For panelists who joined the ATP in 2021 or 2022, 2020 vote choice was measured on the NPORS surveys conducted May 28-Aug. 25, 2021, and May 23-Sept. 6, 2022. The vote choice question asked panelists who said that they voted in 2020 whether they voted for Joe Biden, Donald Trump, or another candidate. For panelists who were in the panel in November 2020 but who did not take the post-election survey, vote choice was measured in surveys conducted June 14-27, 2021, and Oct. 10-16, 2022.
Panelists who did not take any survey in which 2020 vote choice was measured (N=68), panelists who refused to answer the vote choice question (N=153) and panelists who declined to provide their names and thus could not be matched to a voter record (N=92) were removed from the analysis of the 2022 vote, leaving 11,064 panelists for analysis. In addition, panelists who did not take the 2020 post-election survey (N=3,580) were removed from the analysis of individual-level change over time, leaving 7,484 panelists for that portion of the report.
An effort was made to match the panelists to three commercial voter files: one that serves conservative and Republican organizations and campaigns; one that serves progressive and Democratic organizations and campaigns; and one that is nonpartisan. People for whom a registration record could not be found are included in the files but likely underrepresent nonvoters. Because of a law passed in 2018, Utah residents can opt to keep their voter registration and vote history data private. Consequently, Utah residents in the ATP are considered to be voters if they reported having voted when asked in the post-election survey.
Out of the 11,064 panelists in this analysis, 10,696 were voting eligible, and 10,157 (95%) were matched to at least one of these files. A turnout record for 2022 (or self-report for Utah) was located for 7,626 panelists. Panelists who provided names but could not be matched or for whom no 2022 turnout record could be located were considered to be validated nonvoters (3,099 panelists). When also including those who said they did not vote on the survey, the total number of validated nonvoters is 3,198.
The 2020 survey
The 2020 survey was conducted Nov. 12-17, 2020, among 11,818 panelists. Noncitizens and those who refused the citizenship question (N=450), validated voters who refused to answer the vote choice question (N=84) and panelists who declined to provide their names and thus could not be matched to a voter record (N=139) were removed, leaving 11,145 panelists for analysis.
The 2020 survey was also matched to three commercial voter files, and Utah residents were also considered to be voters if they self-reported having voted.
Overall, 97% of voting eligible panelists were matched to at least one of these files and a turnout record for 2020 (or self-report for Utah) was located for 9,668 panelists. Panelists who could not be matched or for whom no 2020 turnout record could be located were considered to be validated nonvoters (1,477 panelists).
Here are additional details about the administration of this survey.
The 2018 survey
The 2018 post-election survey was conducted Nov. 7-16, 2018, among 10,640 panelists. Noncitizens, those who refused to answer the vote choice question and panelists who declined to provide their names and thus could not be matched to a voter record were removed, leaving 10,144 panelists for analysis. An effort was made to match the panelists to two commercial voter files. Overall, 94% of panelists were matched to at least one file and a turnout record for 2018 was located for 7,585 panelists. Panelists who could not be matched or for whom no 2018 turnout record could be located were considered to be validated nonvoters (2,559 panelists).
The 2016 survey
The 2016 survey was conducted Nov. 29-Dec. 12, 2016, among 4,183 respondents. Noncitizens, those who refused to answer the vote choice question and panelists who declined to provide their names and thus for whom a match to a voter record could not be attempted were removed from the analysis, leaving 3,770 panelists for analysis. An effort was made to match the panelists to five commercially available databases that contain information about voter registration and turnout for nearly every U.S. adult. In total, 91% of panelists were located in at least one of the files. Panelists who were verified as having voted in at least one of the commercial voter databases were considered to be validated voters (3,014 individuals) and are included in the tabulations. Panelists for whom no turnout record was located were considered to be nonvoters (756 individuals).
The validation process is discussed in detail in a more general report about commercial voter files published in February 2018, “Commercial Voter Files and the Study of U.S. Politics.”
The 2016 vote choices reported here are based on panelists who said that they voted and were verified as having done so. Those who refused to state their vote choice or who reported voting for a candidate other than Hillary Clinton, Donald Trump, Gary Johnson or Jill Stein were excluded from the analysis.
The resulting sample of verified voters mirrored the election results very closely. After the validation was done and the sample was limited to those for whom a turnout record could be located, 48% reported voting for Clinton and 45% for Trump. By comparison, the official national vote tally was 48% for Clinton and 46% for Trump.
Weighting for the 2022 post-election survey and for the longitudinal analysis
The ATP data is weighted in a multistep process that accounts for multiple stages of sampling and nonresponse that occur at different points in the survey process.
First, each panelist begins with a base weight that reflects their probability of selection for their initial recruitment survey. These weights are then rescaled and adjusted to account for changes in the design of ATP recruitment surveys from year to year.
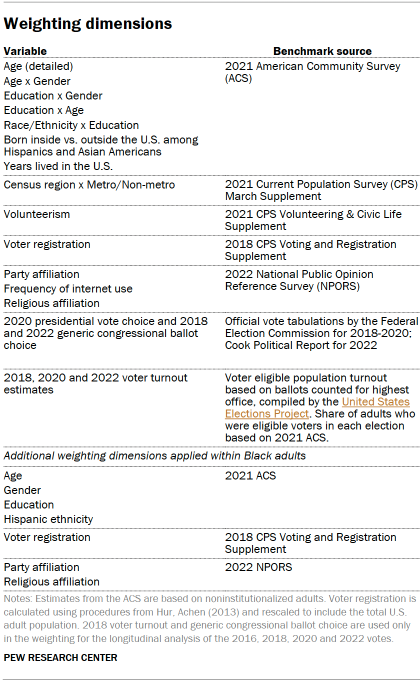
Finally, the weights are calibrated to align with the population benchmarks in the accompanying table to correct for nonresponse to recruitment surveys and panel attrition. If only a subsample of panelists was invited to participate in the wave, this weight is adjusted to account for any differential probabilities of selection.
Among the panelists who completed the survey, this weight is then calibrated again to align with the population benchmarks identified in the accompanying table and trimmed at the 1st percentile to reduce the loss in precision stemming from variance in the weights. Sampling errors and tests of statistical significance take into account the effect of weighting.
Two separate weights are used in this report, one for the analysis of the 2022 vote and one for the longitudinal analysis of the 2016, 2018, 2020 and 2022 votes. Only the longitudinal weight is aligned to 2018 voter turnout and generic congressional ballot estimates.
A final adjustment was applied to the trimmed weights to ensure that turnout and the popular vote margin for 2018, 2020 and 2022 exactly matched the weighting benchmark.
The following table shows the unweighted sample sizes and the error attributable to sampling that would be expected at the 95% level of confidence for different groups in the survey.
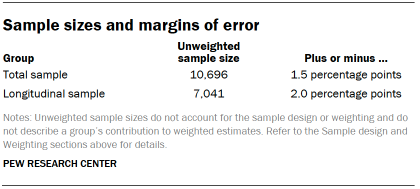
In addition to sampling error, one should bear in mind that question wording and practical difficulties in conducting surveys can introduce error or bias into the findings of opinion polls.
Revision of the 2020 data
Additionally, we revised our statistical approach for the 2020 survey. That produced new results that slightly changed the numbers we reported about the 2020 election but changed no substantive findings in our report. There was nothing inaccurate about the 2020 results, but we chose to use a slightly different survey weighting approach that increases the precision of our estimates for some of the groups of voters we discussed in the report, especially those that are difficult to reach and interview.
Although the revised numbers for 2020 appear in the current report and in the accompanying online data tables, the report on the 2020 election has not been changed, and the data tables provided with that report are still available.


