
How we did this
Pew Research Center conducted this study to understand how Americans voted in 2018 and how their turnout and vote choices differed from 2016. For this analysis, we surveyed U.S. adults online and verified their turnout in the two elections using commercial voter files that aggregate official state turnout records.
We surveyed 10,640 U.S. adults online in November 2018 and 4,183 adults in November and December 2016. Everyone who took part is a member of Pew Research Center’s American Trends Panel (ATP), an online survey panel recruited through national, random sampling of telephone numbers or, since 2018, residential addresses. This way nearly all U.S. adults have a chance of selection. The surveys are weighted to be representative of the U.S. adult population by gender, race, ethnicity, partisan affiliation, education and many other characteristics. Read more about the ATP’s methodology. Verification of voter turnout involved matching the panelists to two or more commercial voter files. Panelists for whom a record of voting was located are considered validated voters; all others are presumed not to have voted.
Here are the questions used for this report and its methodology.
Compared with Hillary Clinton’s 2-point popular vote advantage over Donald Trump in the 2016 presidential election, the Democratic Party expanded its margin over the Republican Party to 9 points in votes cast for the U.S. House of Representatives in 2018, a gain of 7 percentage points. This increased support was sufficient for the Democratic Party to gain the majority in the House with a net pickup of 41 seats. Voter turnout as a share of the eligible population was 49%, the highest for a midterm election in 100 years. A new analysis of verified voters from Pew Research Center’s American Trends Panel examines what 2016 voters and nonvoters did in the 2018 midterm elections and offers a detailed portrait of the demographic composition and vote choices of the 2018 electorate. It provides an update and comparison with findings from our study of the 2016 electorate.
Compared with how Clinton fared in 2016, Democratic candidates for Congress in 2018 made gains from several sources. Among Americans who voted in both elections, Clinton’s 2016 voters supported Democrats in 2018 at a slightly higher rate than Trump’s voters supported Republican candidates. Slightly more of Clinton’s than Trump’s voters turned out to vote in 2018. In combination, party loyalty, defection and turnout differences among 2016 voters accounted for a little less than half of the Democratic gains over Clinton’s two-point margin.
Nonvoters in 2016 who turned out in 2018 voted heavily for Democratic candidates, accounting for about half of the Democratic gains. Additionally, a small share of the gains came from people who voted for third-party candidates in 2016; they favored Democratic candidates over Republican candidates in 2018 by a narrow margin.
Voting patterns in 2018 reflected a great deal of continuity with 2016, though Democratic candidates in 2018 did better among a few groups, notably men, young people and secular voters. Voting patterns among several other large groups changed less, including Black voters, voters ages 65 and older, Protestants, regular churchgoers and women.
Given their relatively lower turnout, midterm elections are not necessarily predictive of what will happen in the next presidential election, when many more American voters will take part.
This analysis is based on interviews with 10,640 members of Pew Research Center’s American Trends Panel conducted Nov. 7-16, 2018, shortly after the general election. It also draws on interviews conducted among 3,770 of the panelists from Nov. 29 to Dec. 12, 2016, after the general election that year and interviews conducted Aug. 20 to Oct. 28, 2018 among all members of the panel at that time. Researchers attempted to match the panelists to two different commercial voter files that contain official records of voter registration and turnout for 2016 and 2018. For the panelists interviewed in 2016, their 2016 vote history is based on verification with three additional commercial voter files, as described in an earlier report. (For more details, see “Methodology.”) This process of verifying voter turnout helps to correct for the tendency of some people to overreport voting and is generally regarded as providing a more accurate picture of the electorate.
Where the 2018 Democratic advantage came from: 2016 nonvoters, higher turnout by Clinton voters, and vote switching
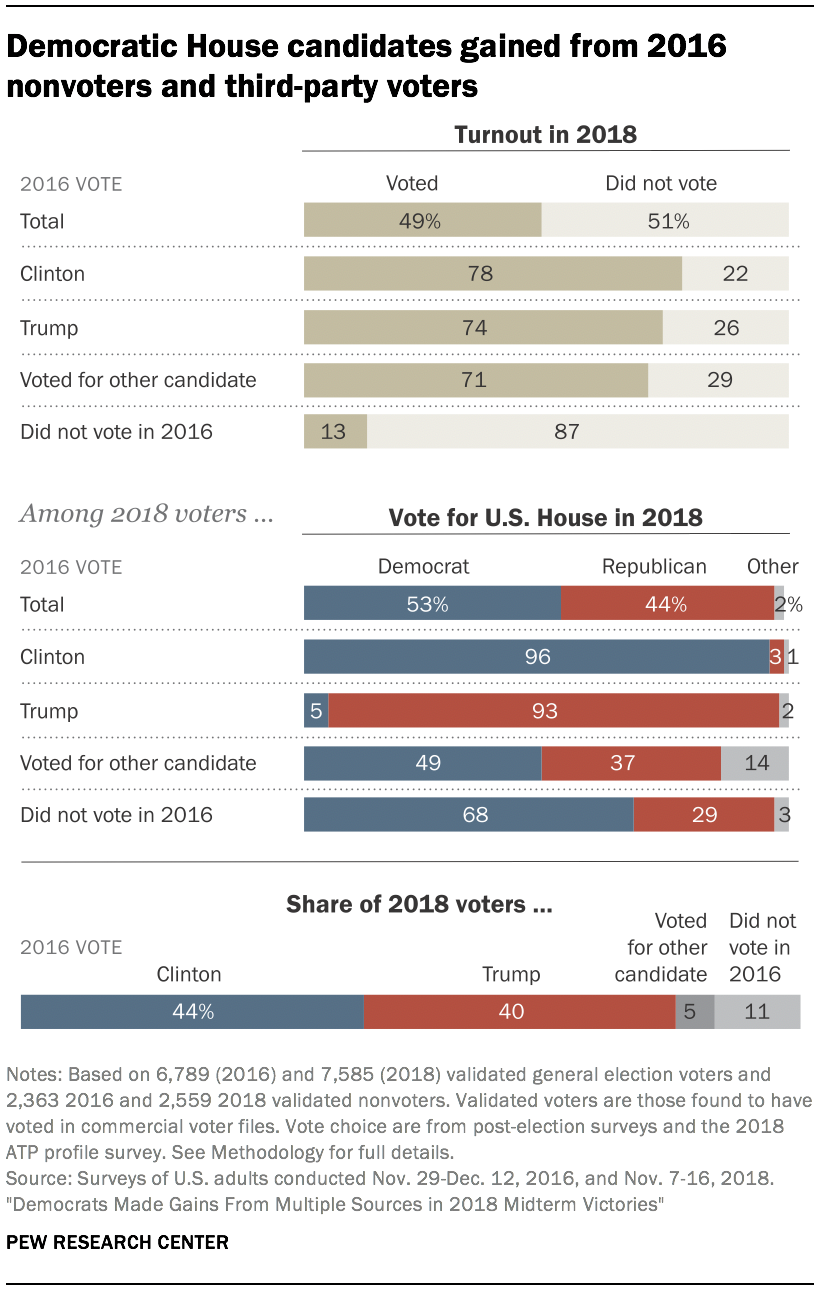
Midterm elections consistently experience lower turnout than presidential elections. Yet while the 2018 turnout of 49% did not match turnout in the 2016 presidential election (59%), it was far higher than usual. Midway through President Trump’s first term in office, both Democrats and Republicans were energized. A large majority of people who voted in 2016 (76%) also voted in 2018. But somewhat more of Clinton’s 2016 voters (78%) than Trump’s 2016 voters (74%) turned out in 2018. Overwhelming majorities of both Trump’s and Clinton’s 2016 voters remained loyal to their respective parties in their 2018 U.S. House vote, though Clinton’s 2016 voters who turned out in 2018 were slightly more loyal to Democratic 2018 candidates (96%) than Trump’s 2016 voters were to 2018 GOP candidates (93%). Among the share who voted for someone other than Trump or Clinton in 2016, 71% voted in 2018. These voters favored Democratic candidates over Republican candidates by a margin of 49% to 37%.
Voters in 2018 who did not vote in 2016 were a small group (about 11% of all 2018 voters) but an important part of why the Democratic Party made gains. Among the 2016 nonvoters who voted in 2018, Democratic House candidates led Republican House candidates by a more than a two-to-one (68% to 29%) margin.
Of everyone eligible by citizenship and age to vote in 2018, 44% voted in both the 2016 and 2018 elections; 36% voted in neither; 14% were drop-off voters (voting in 2016 but not in 2018) and a small share (6%) were new voters – voting in 2018 but not in 2016.
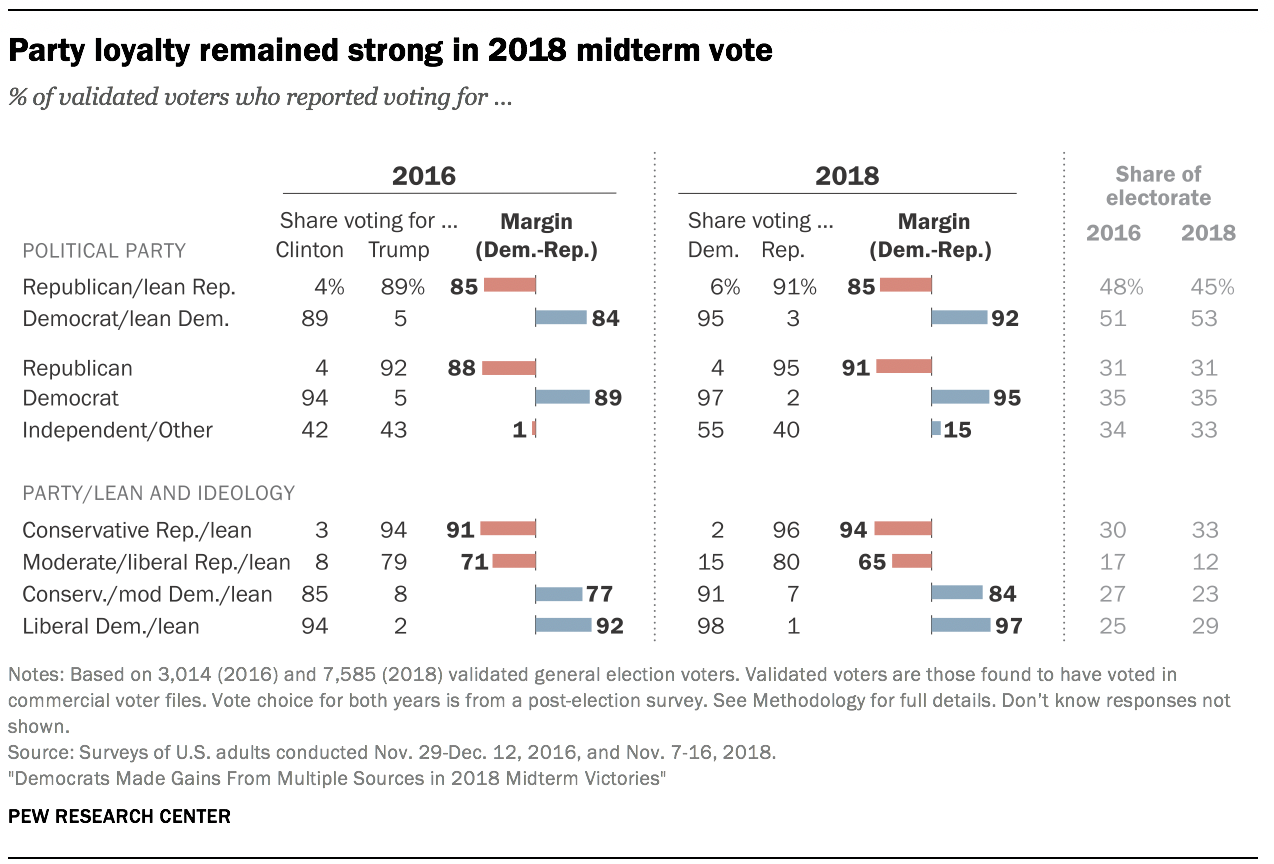
Few defections from party affiliation
As they did in 2016, Republicans and Democrats voted almost unanimously for House candidates of their own party in 2018. Among those who do not initially identify with either party (including leaners, members of third parties and “pure” independents), Democratic candidates picked up 13 percentage points of support in 2018 over Clinton’s levels. Democratic candidates also made gains among Republicans and leaners who describe themselves as moderate or liberal (from 8% for Clinton to 15% for Democratic House candidates).
Democrats did better in 2018 than 2016 among men, young voters
Among most groups, voting patterns in 2018 were generally similar to those in 2016, albeit with most reflecting somewhat greater support for Democratic candidates for the U.S. House compared with Hillary Clinton. Men, young people and secular voters were notably more supportive of Democratic candidates in 2018 than these groups had been in 2016.
Democratic gains among men resulted in some narrowing of the gender gap. In the 2016 election, Donald Trump won men by 11 points (52% to 41%) and Hillary Clinton won women by 15 (54% to 39%), for a difference of 26 points. In 2018, women supported Democratic candidates by a similar margin (18 points, 58% to 40%) but the GOP advantage among men vanished (50% voted Democratic, 48% Republican). Trump carried White men by 30 points in 2016 (62% to 32%), a Republican advantage that shrank to just 12 points in 2018 (55% to 43%).
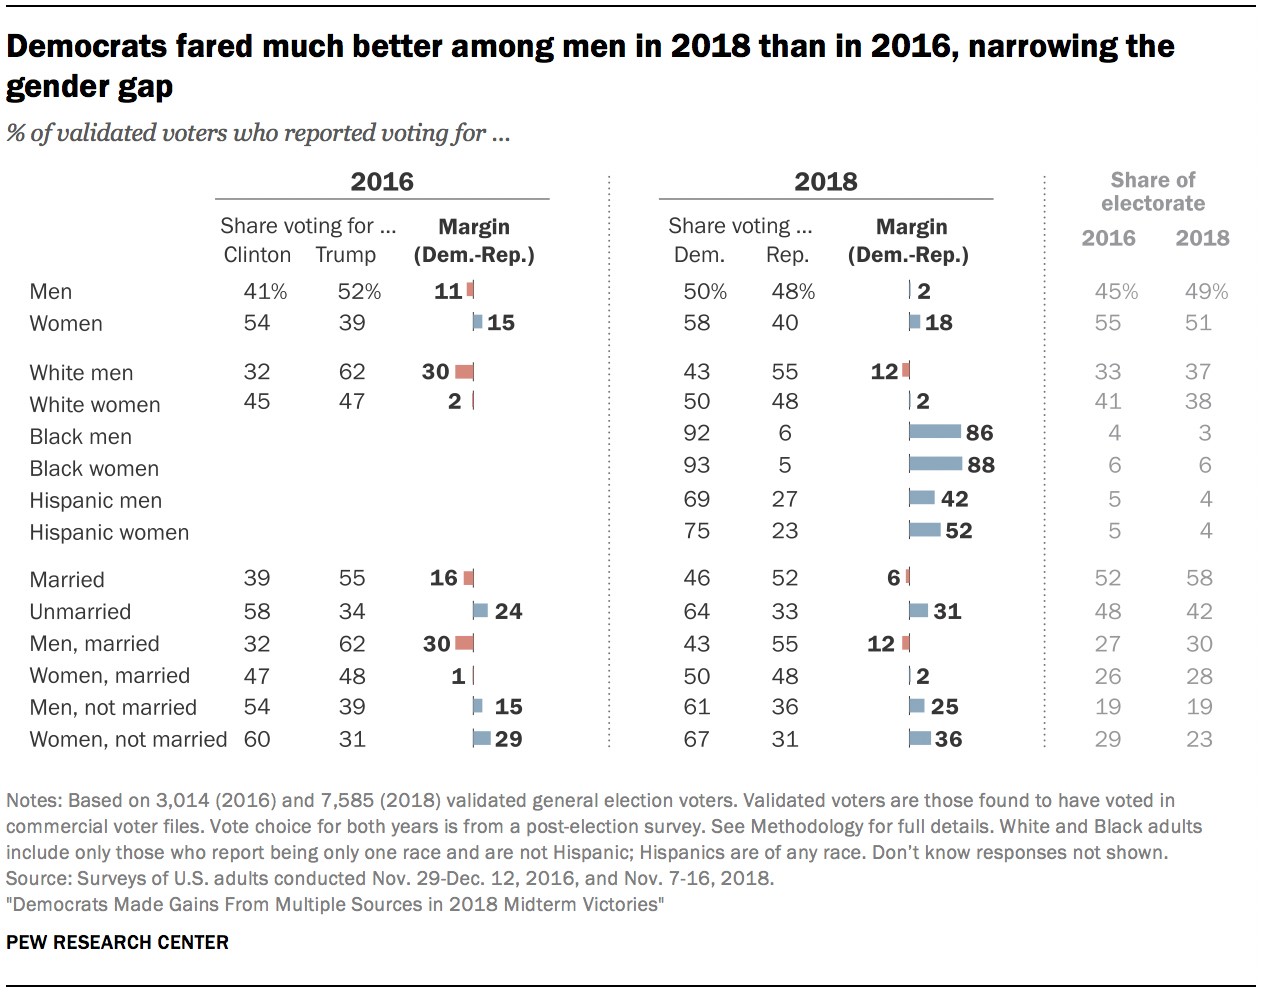
Much as the gender gap shrank from 2016 to 2018, so did the marriage gap. Married voters in 2016 voted for Trump by a 55% to 39% margin but supported GOP House candidates in 2018 by only a 6-point margin, 52% to 46%. Unmarried voters were strongly Democratic in both years (58% to 34% for Clinton in 2016 and 64% to 33% for Democratic House candidates in 2018). Much of the decline in the marriage gap came from men. Trump won married men by a 30-point margin in 2016, but this group backed GOP House candidates by 12 points in 2018. Married women were evenly divided between the parties in both elections. Among unmarried voters, women were more supportive of Democratic candidates in 2018 than they had been of Hillary Clinton in 2016.
Young voters ages 18-29 were solid supporters of Clinton in 2016, but as a group were even more Democratic in 2018. In 2016, voters ages 18-29 voted for Clinton over Trump by a 58% to 28% margin, with 14% casting votes for third party candidates. In 2018, this group’s votes went 72% for Democratic candidates and 23% for Republican candidates. Young voters, however, were significantly underrepresented in the electorate due to low turnout (as they usually are). In 2018, they made up 11% of all voters, significantly below their 21% share of the voting eligible population. Nonetheless, 37% of young voters in 2018 had not voted in the 2016 election, a far higher share than in any other age group.
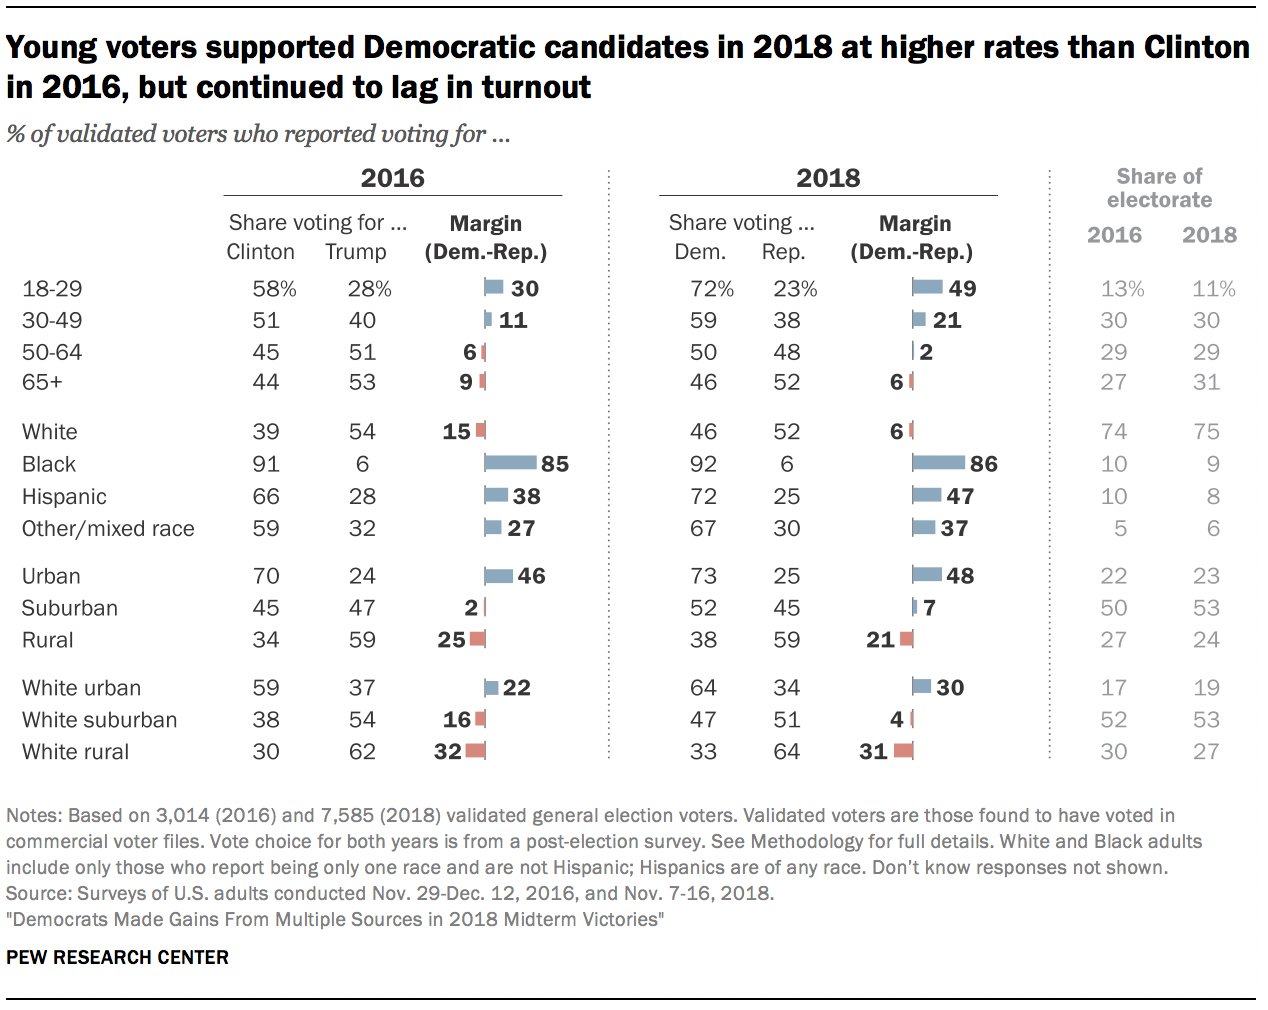
By contrast, older voters continued to be the Republican Party’s most loyal age group. Trump carried voters ages 65 and older by a 9-point margin in 2016; Republican candidates for the House won this group by 6 points in 2018 (52% to 46%). Older voters were nearly one-third of all voters in 2018 (31%), about three times the share of those ages 18-29, despite making up about the same overall share of the voting eligible population.
Support for Republican candidates among Black voters in 2018 was minimal (92% Democratic vs. 6% Republican in 2018, similar to the 91% to 6% margin for Clinton in 2016). Republicans had more support among Hispanic than Black voters, but there were still lopsided majorities for Democratic candidates (72% vs. 25% in 2018 and 66% for Clinton and 28% for Trump in 2016). There were too few Asian American voters in the sample to yield a reliable estimate, but among Asian and other voters of color collectively the 2018 vote was 67% Democratic and 30% Republican. White voters backed GOP candidates over Democrats by 6 points in 2018 (52% to 46%), though this represents a narrowing of Trump’s 15-point margin over Clinton among White voters.
Geography remained a strong correlate of vote choice in 2018, with urban voters breaking Democratic by about a three-to-one margin (73% to 25%), similar to their split in 2016 (70% Clinton, 24% Trump). Republicans had about a two-to-one advantage over the Democrats with rural voters in both presidential voting and in 2018. Meanwhile, the Democrats made gains among suburban voters. While Trump and Clinton had roughly divided the suburban vote in 2016 down the middle (47% Trump, 45% Clinton), Democratic House candidates won the suburban vote by 7 percentage points two years later (52% to 45%).
Voters of color generally voted Democratic regardless of where they lived, though Republican candidates received 37% of the votes of suburban Hispanics and 12% support among rural Black voters. White urban voters supported Democratic candidates by a roughly two-to-one margin (64% to 34%) while rural White adults were a near mirror image (64% Republican, 33% Democratic). Suburban White voters, who favored Trump by 16 points in 2016, were more divided in 2018 (51% Republican, 47% Democratic).
Already a strong Democratic group, those unaffiliated with a religious tradition became more so
In 2018, voters were highly politically polarized by religious affiliation and attendance at worship services, as they have been for many years in the U.S. Solid majorities of Protestants supported Republican candidates in 2018, while Catholics were more divided and the less religious were strongly Democratic in their votes.
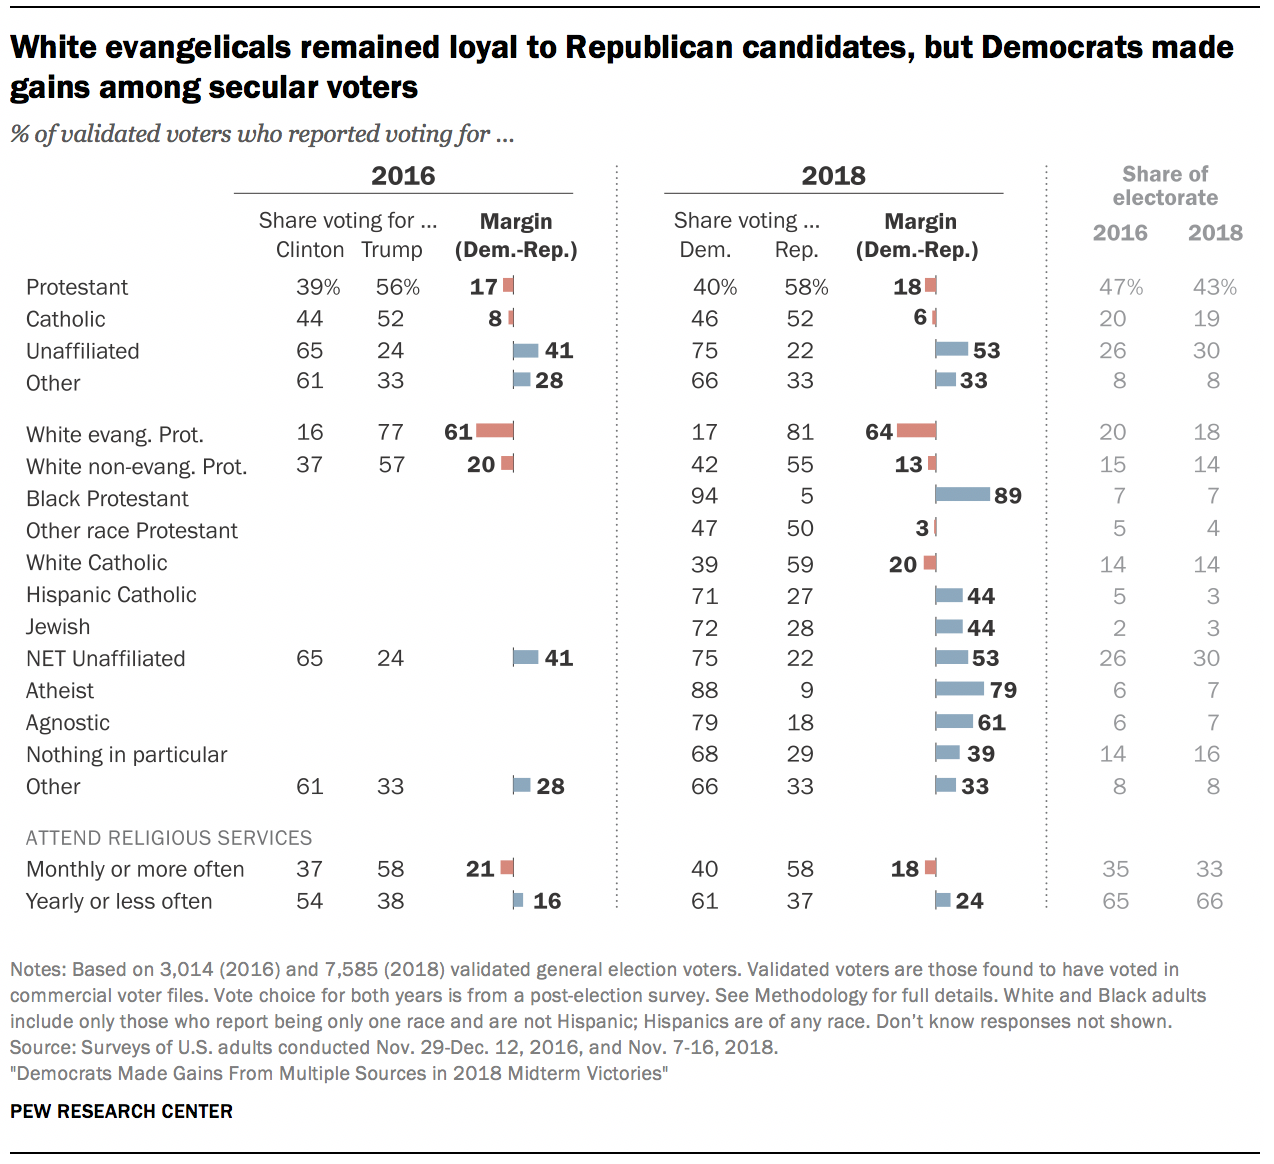
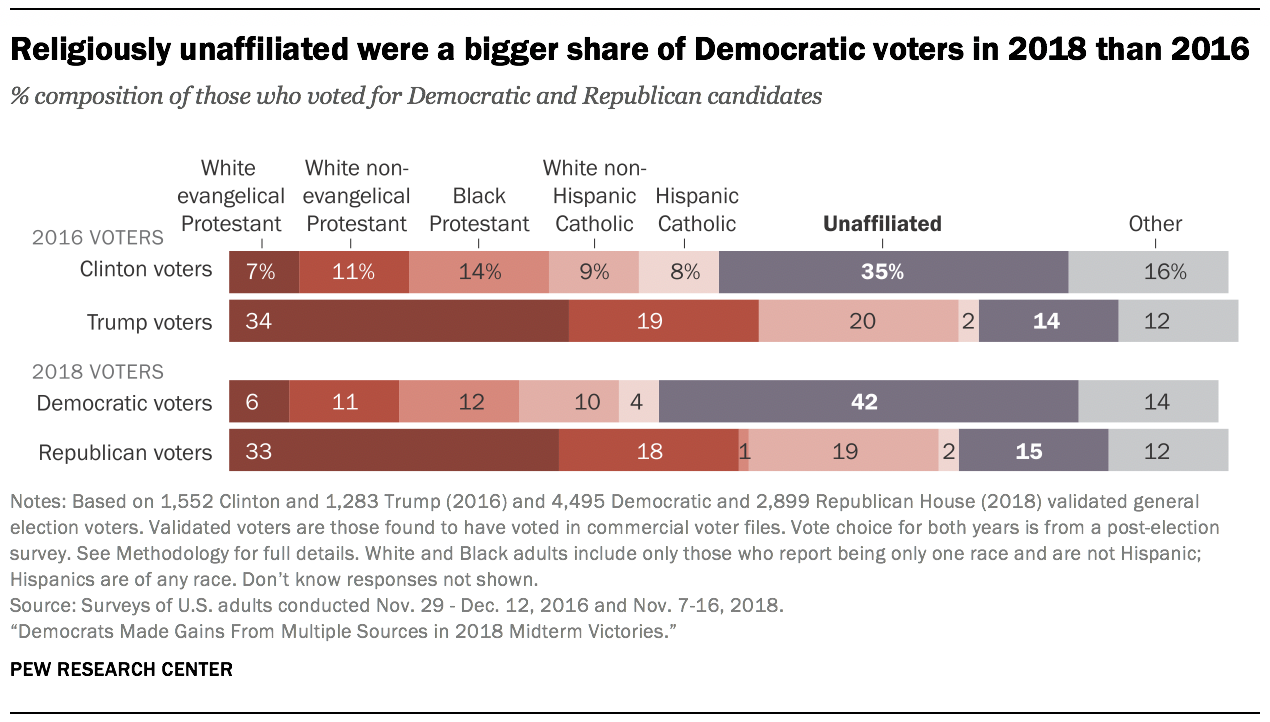
The Republican Party’s most supportive demographic group (other than voters who identify as Republican or who are conservative) were White evangelical Protestants (81% voted Republican and 17% voted Democratic). This margin was very similar to 2016 (77% Trump vs. 16% Clinton). A sizable majority of White Catholics also supported Republicans (59% to 39%), with White non-evangelical Protestants close behind (55% to 42%).
Unaffiliated voters – and especially atheists and agnostics – were even more supportive of Democratic candidates in 2018 than they had been of Hillary Clinton, with at least some of the change coming from those who had supported Gary Johnson or Jill Stein in 2016. The margins among voters who describe their religious affiliation as “nothing in particular” were fairly similar in 2016 and 2018. Atheists (7% of voters in 2018) supported Democratic candidates by an overwhelming 88% to 9% margin, rivaling Black support for the Democrats. Agnostics (also 7% of voters) were not far behind, supporting Democratic candidates by a 79% to 18% margin.
The solid support for Democratic candidates among the unaffiliated is also reflected in voting patterns by attendance at worship services. Among those who attend a few times a year or less often, 61% voted Democratic and 37% voted Republican. In 2016, this group voted 54% to 38% for Clinton. By contrast, voters who attend services monthly or more often voted 58% to 40% Republican in 2018. Two years earlier, they voted for Trump by a 58% to 37% margin.
Democrats made modest gains in 2018 among non-college White voters
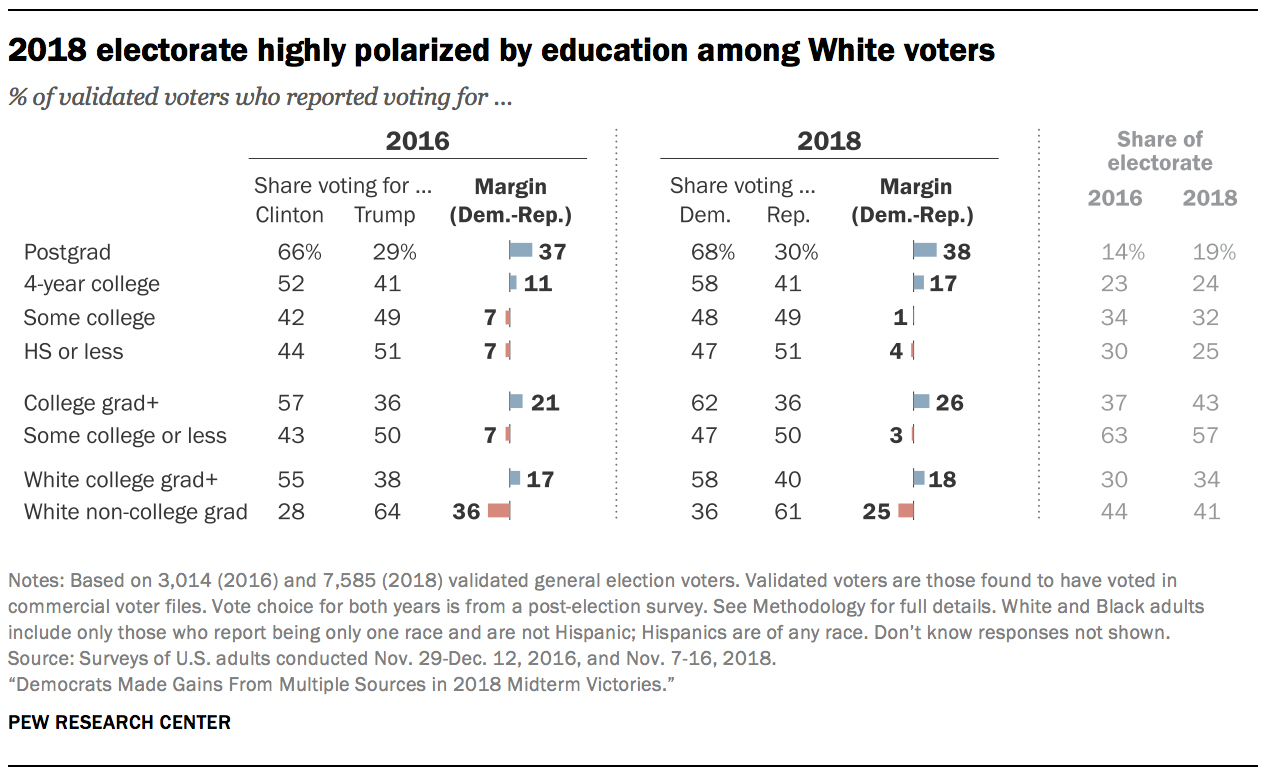
Perhaps the most important political trend reflected in the 2016 outcome was the continued movement of working-class White voters toward the GOP. Hillary Clinton lost White voters who did not have a college degree by a wide 36 percentage points (64% for Trump vs. 28% for Clinton). But in 2018, Democratic candidates managed to narrow the gap somewhat, losing this group by 61% to 36%, a 25-point margin.
At the same time, the Democratic Party maintained a wide margin among college-educated White adults. In 2016, Democrats won this group by 17 points (55% to 38%) and in 2018 by a nearly identical 18-point margin (58% to 40%).
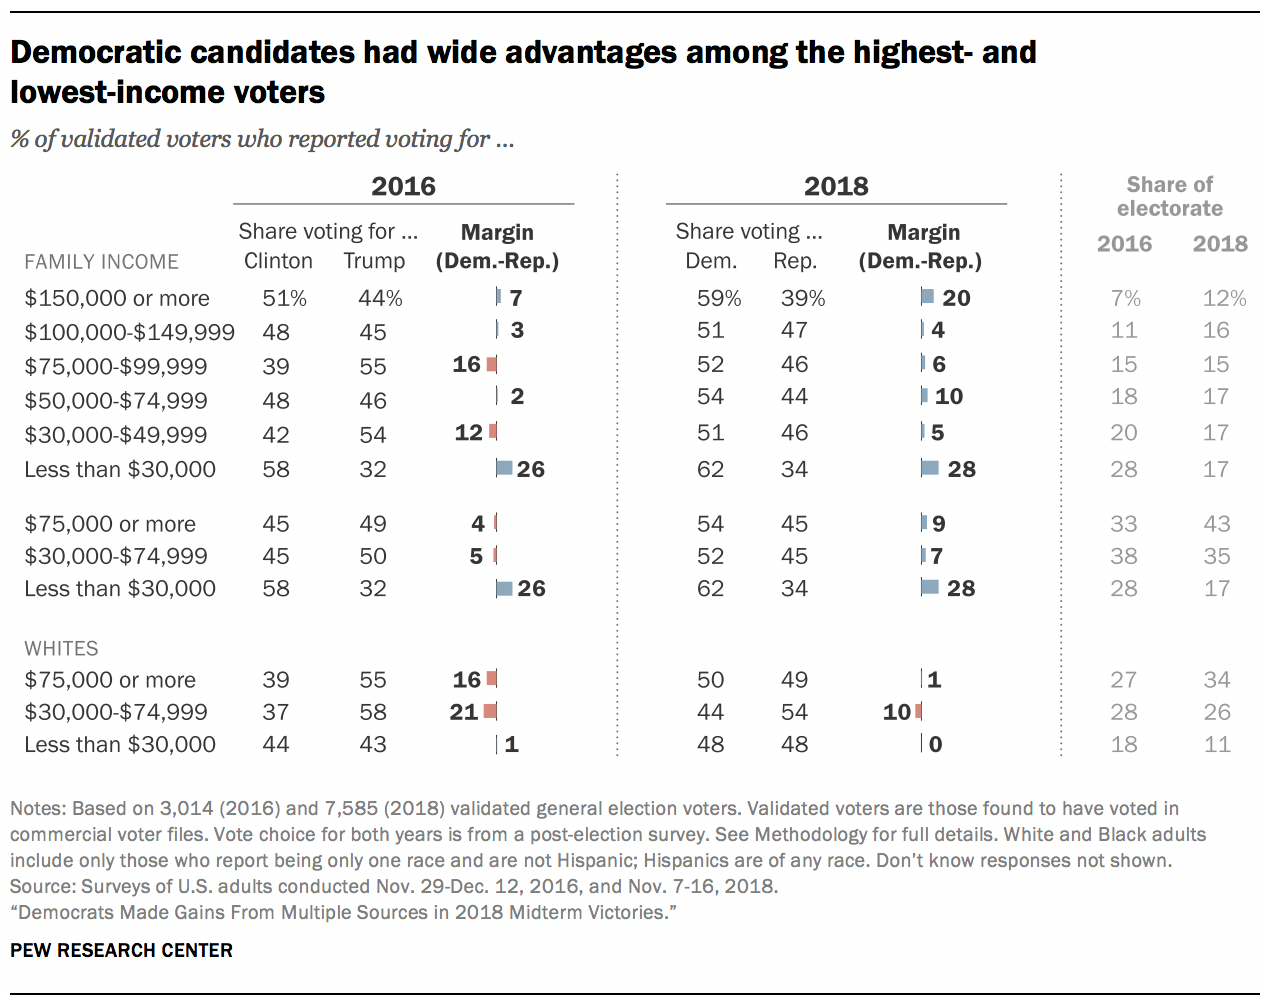
Democratic candidates in 2018 did well among both the highest- and lowest- income voters. Voters reporting annual family incomes of $150,000 or higher voted for Democratic candidates by a 59% to 39% margin. At the other extreme, those with incomes below $30,000 voted 62% to 34% Democratic. Even among White low-income voters, Democratic and Republican candidates battled to a tie (48% each). Among White voters with incomes between $30,000 and $74,999, Republican candidates had a 54% to 44% majority.
The parties’ coalitions, 2018 vs. 2016
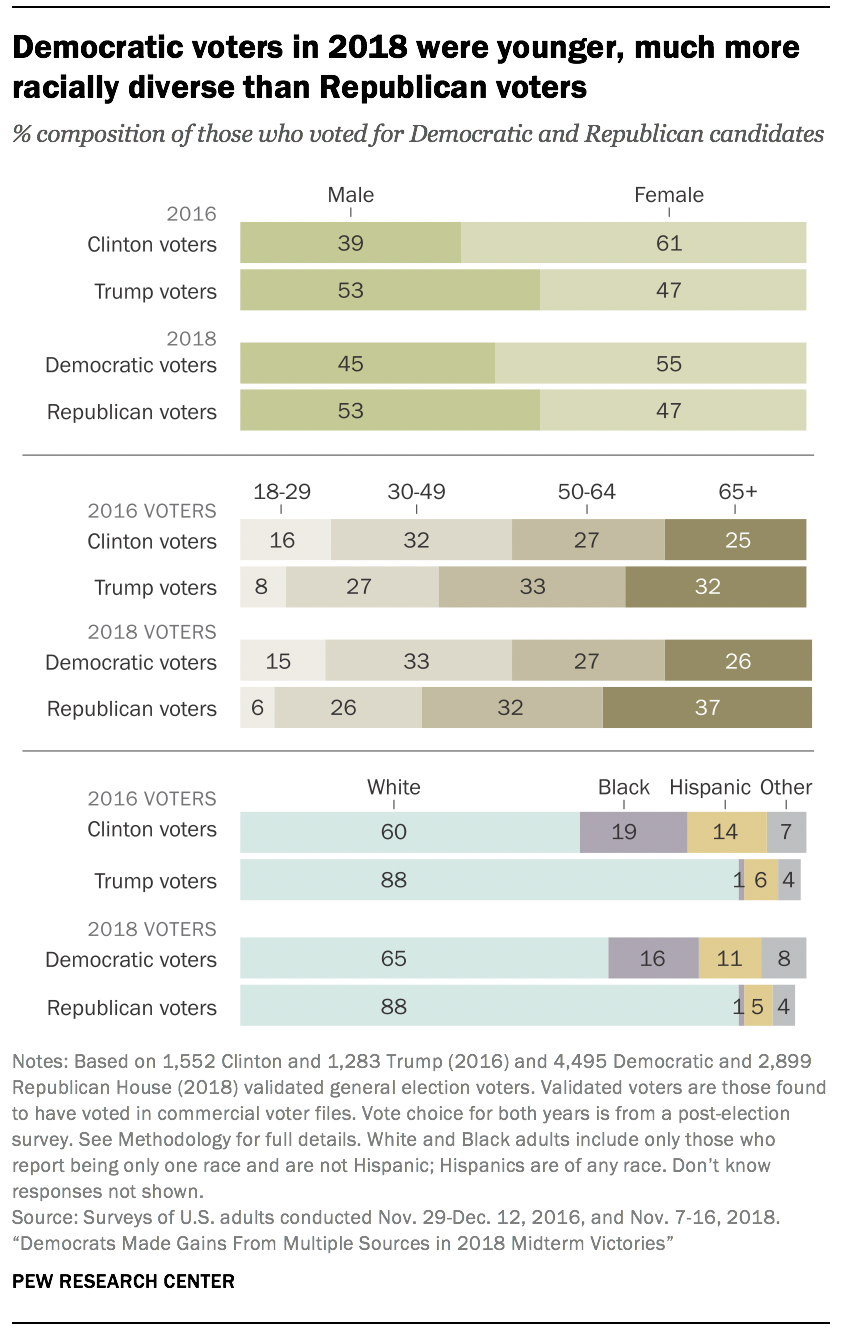
People who voted for Democratic vs. Republican candidates for the House in 2018 were quite different demographically, in ways consistent with previous elections including 2016. The Republican coalition is more likely to be older, male, White, somewhat less educated and Protestant or Catholic.
In 2016, men made up only 39% of Hillary Clinton’s voters. This share grew to 45% for Democratic House candidates in 2018. But other than a slight increase in the share of Republican voters ages 65 and older, there was little change in the respective age profiles of the two parties’ voters. Nearly half of those who voted for Democratic candidates were under 50 years of age, compared with almost a third (32%) of Republican voters.
Non-Hispanic White adults made up nearly nine-in-ten Republican voters (88%), compared with just two-thirds (65%) of Democratic voters. Only 1% of voters who chose Republican House candidates were Black (16% of Democratic voters were Black). Hispanics were 11% of the Democratic voter coalition, compared with 5% for the Republican coalition.
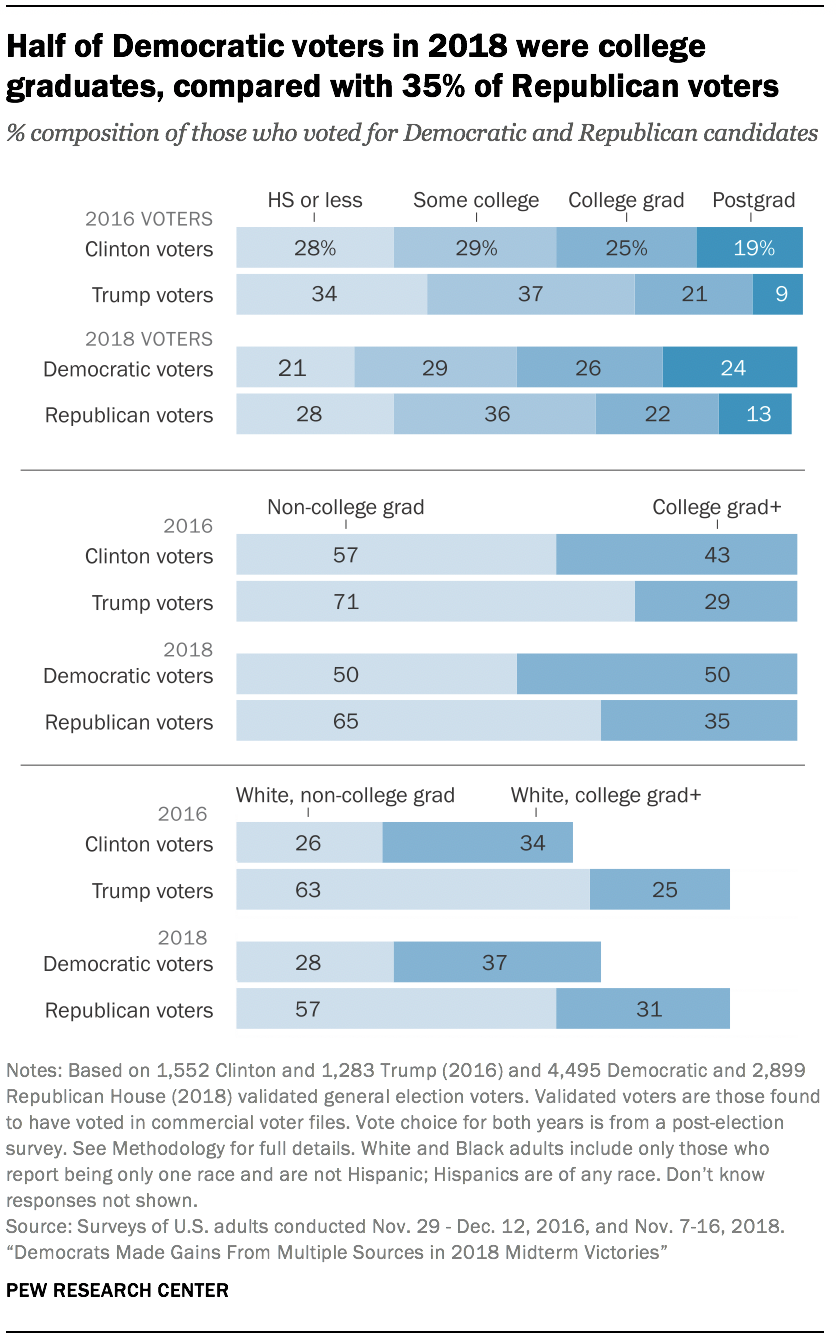
Half of Democratic voters in 2018 had a four-year college degree or more, compared with 35% of Republican voters. Voters with postgraduate degrees made up nearly a quarter (24%) of the Democratic electorate, compared with 13% among Republican voters. Combining this with the racial profile of the parties’ supporters, 57% of GOP voters were White adults with no college degree, compared with 28% among Democratic voters.
Protestants made up a majority of those voting Republican in 2018, just as they did in 2016. Overall, 57% of GOP House voters were Protestant, compared with just a third (32%) of Democratic voters. Catholics made up a slightly higher share of Republican voters as well (22% vs. 16% of Democratic voters). Voters who were unaffiliated with any religious tradition (atheists, agnostics and those who describe themselves as “nothing in particular”) make up 42% of Democratic voters but just 15% of Republican voters.
The demographic profile of voters and nonvoters is very different
The roughly half of Americans who voted in 2018 differ from the voting-eligible adult population in some key respects. There were sizeable, if familiar, demographic and political differences in who did and did not turn out.
Compared with citizens who did not vote, voters were older, more likely to be college educated, better off financially, more likely to be White Protestants or Catholics and more Republican in party affiliation and candidate preference. These differences are regular features of U.S. elections, as a comparison with voters and nonvoters in 2016 makes clear.
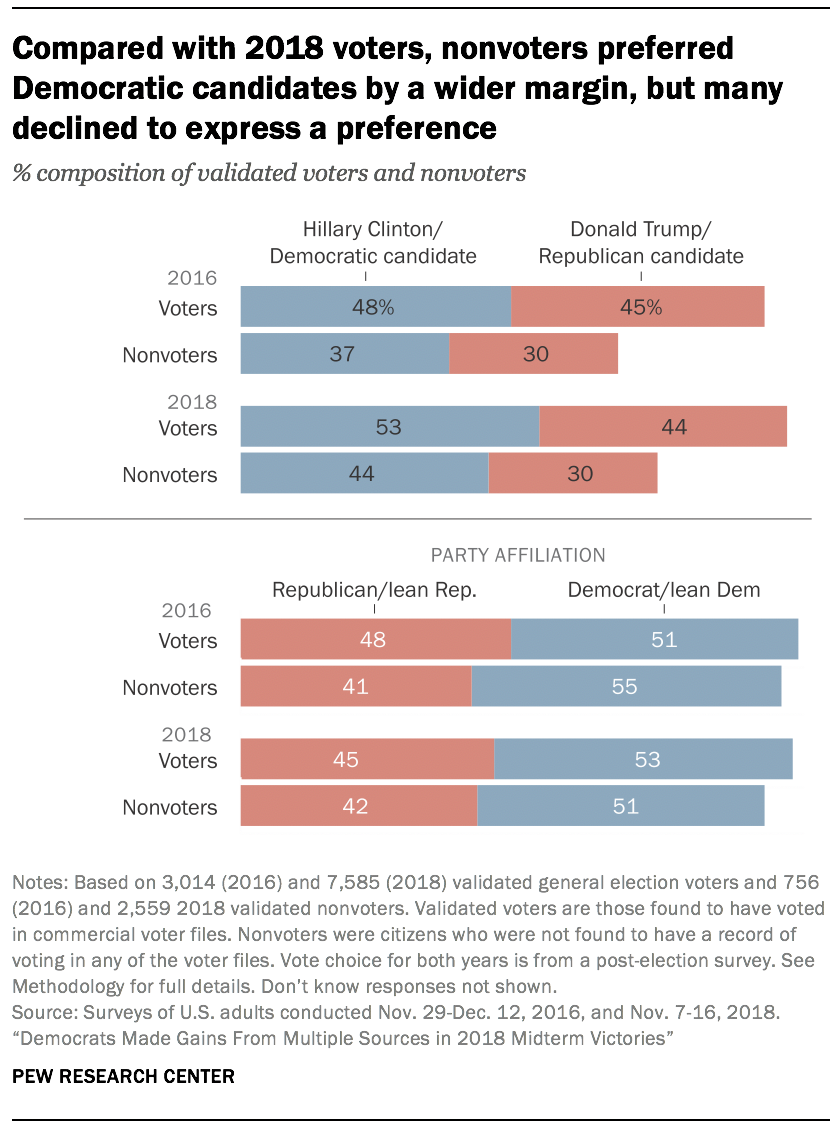
All citizen panelists – whether voters or nonvoters – were asked which U.S. House candidate they supported in the general election. Nonvoters tend to express more uncertainty about the choice, owing in large part to the fact that many of them pay little attention to politics. But among those who did express a preference, Democratic candidates led Republican candidates by 14 percentage points (44% to 30%) a larger margin than among voters (9 points, 53% to 44%).
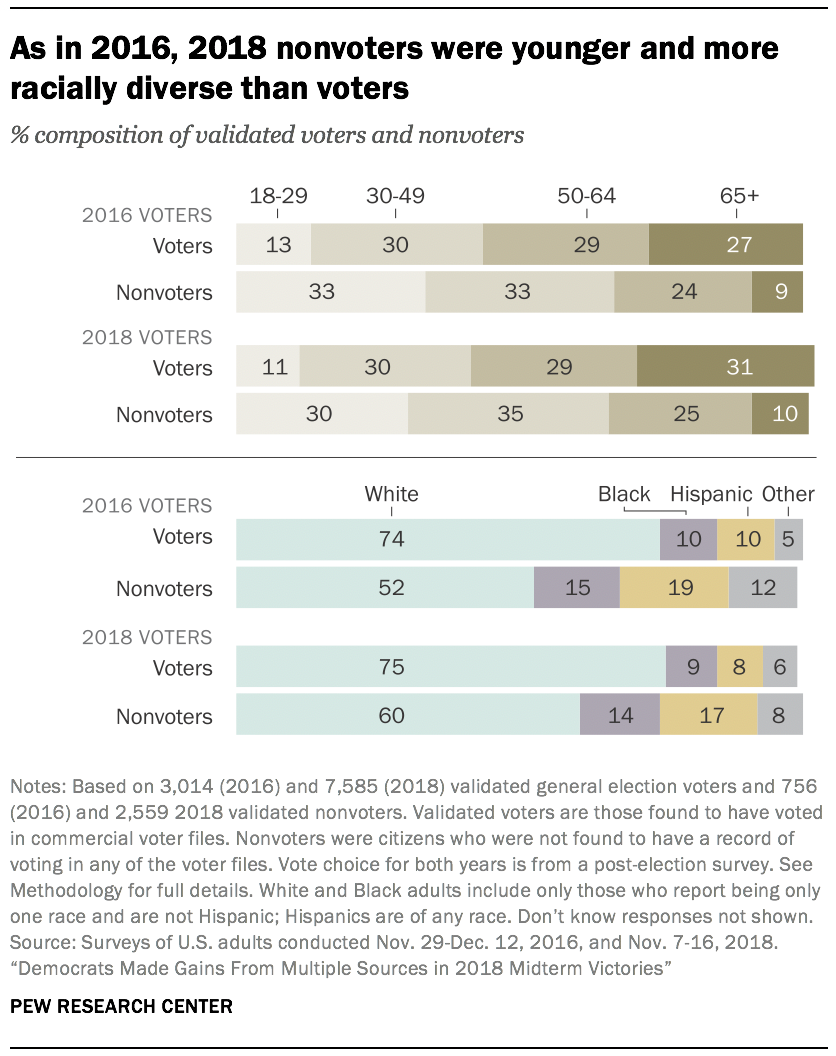
Demographically, the contrast between voters and nonvoters is most stark on age, race, education and income. Voters in 2018 were considerably older than nonvoters: 31% of voters but just 10% of nonvoters were ages 65 and older. At the other end of the age spectrum, just 11% of voters were under 30 years of age; 30% of nonvoters fell into this category. These gaps are quite similar to those seen in 2016.
Similarly, three-quarters of voters (75%) were non-Hispanic White adults, while 60% of nonvoters were White. Hispanics, in particular, were underrepresented as voters. Just 8% of 2018 voters were Hispanic. Among the voting-eligible nonvoters, 17% were Hispanic. Black adults were 9% of voters but 14% of nonvoters.
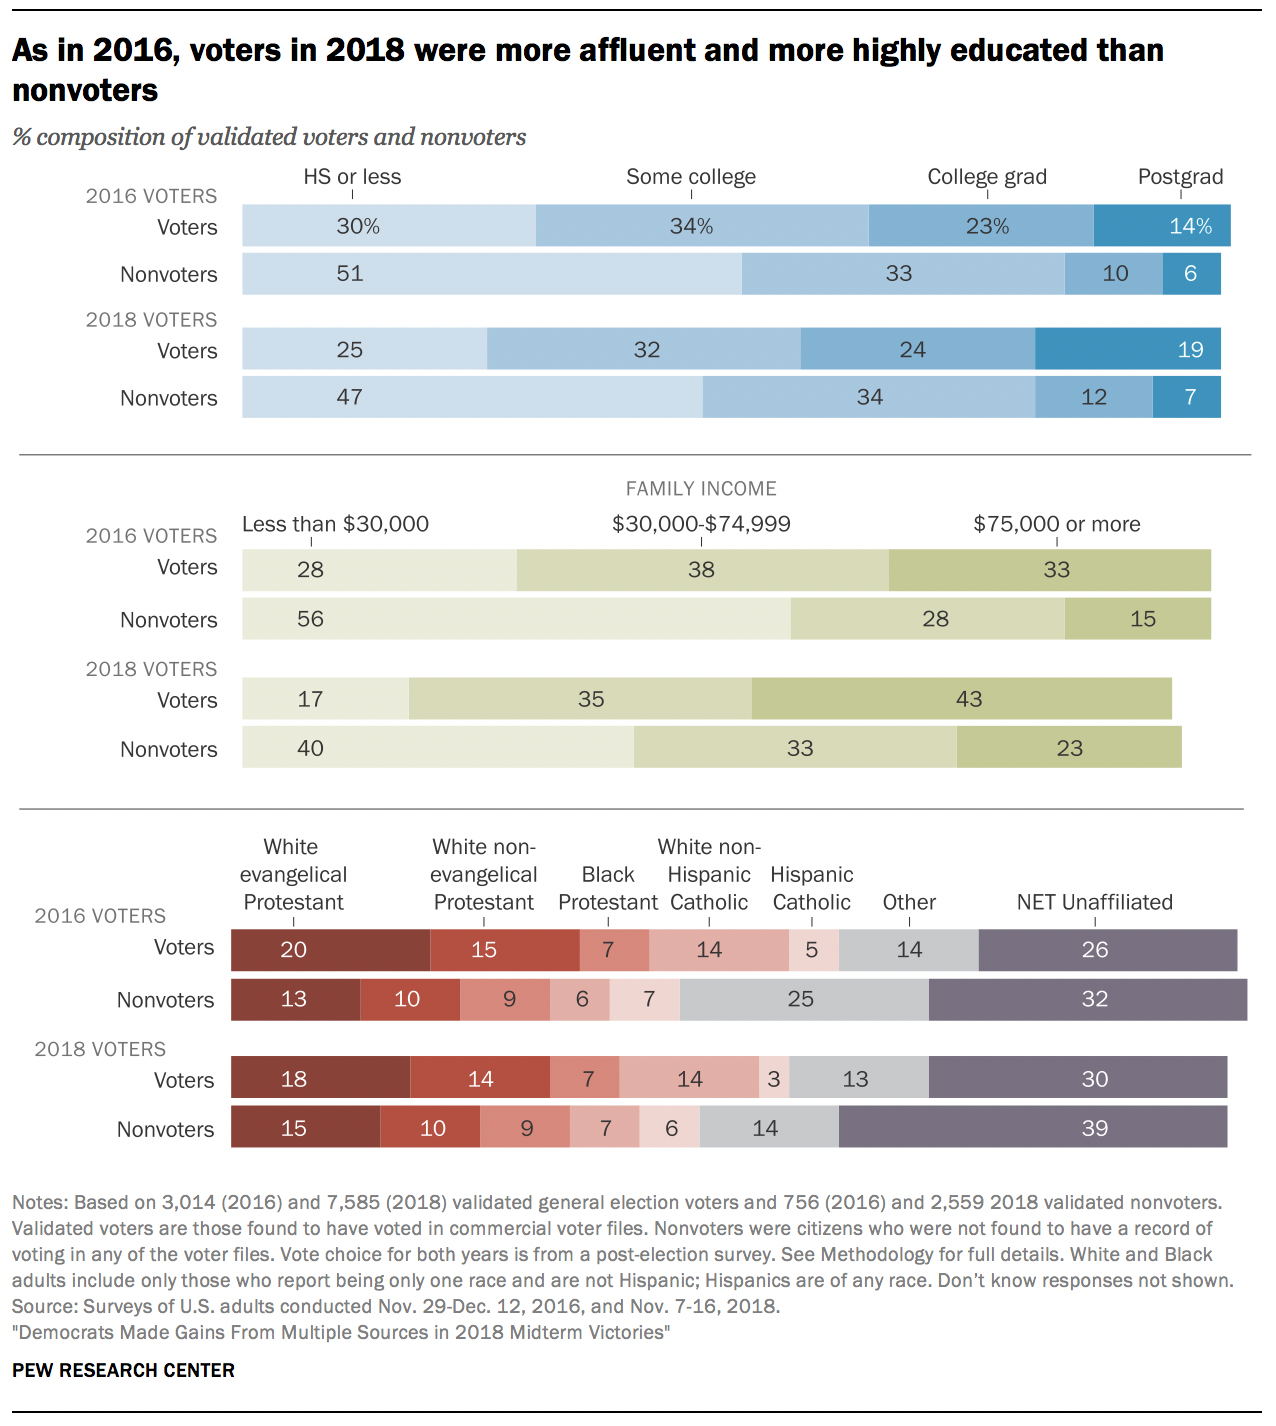
Voters tend to be more highly educated and more affluent than nonvoters. One-quarter of voters had only a high school education, but 47% of nonvoters did so. More than four-in-ten voters (43%) were college graduates, compared with only 19% of nonvoters. The differences by income were similarly substantial. Just 17% of voters had annual family incomes of less than $30,000. Among nonvoters, 40% did so.
White Protestants and White Catholics make up nearly half of all voters (46%) but just 32% of nonvoters. People who describe their religious affiliation as “nothing in particular” are underrepresented among voters, constituting 28% of all nonvoters but just 16% of voters.


