

Inflation in the United States reached its highest level in three years in April, according to the Bureau of Labor Statistics (BLS). And many Americans are feeling the pinch: In a Pew Research Center survey also conducted in April, 66% of U.S. adults said inflation is a very big problem facing the nation, up from 63% last year.
With many Americans worried about prices, it’s worth looking at whether workers’ wages have been rising quickly enough to keep up. Like a lot of things in economics, however, there’s not one definitive answer. Determining whether wages have kept up with inflation depends on many factors: how you define wages, which set of workers you examine, how you measure inflation and which time period you choose to analyze.
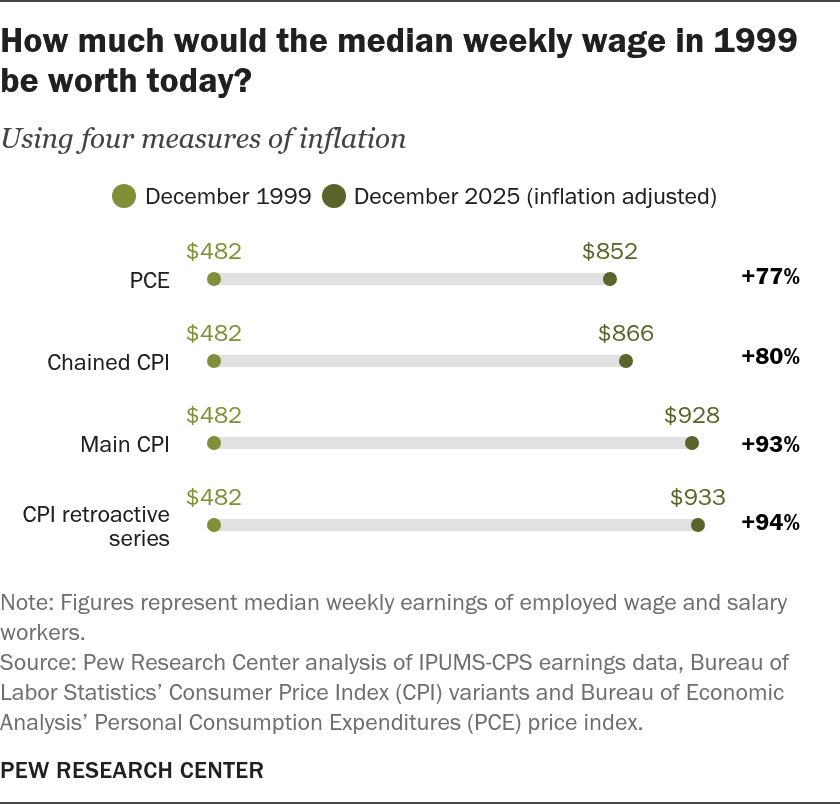
In this analysis, we’ll show how changing just one of those factors – how you measure inflation – can significantly alter the overall picture. Without adjusting for inflation, median weekly wages more than doubled between the end of 1999 and the end of 2025, from $482 to $1,040. Factor in inflation, though, and real buying power over that span rose by anywhere from 11% to 22%, depending on which price index you use.
Measuring inflation with the main Consumer Price Index
The most frequently reported inflation measure is the Consumer Price Index – officially, the “Consumer Price Index for All Urban Consumers,” or CPI-U.
| Inflation index | Median weekly earnings in December 1999 | Inflation adjusted to December 2025 | Percent change |
|---|---|---|---|
| Main CPI | $482 | $928 | +93% |
| Chained CPI | $482 | $865.77 | +80% |
| CPI retroactive series | $482 | $933.14 | +94% |
| PCE | $482 | $851.72 | +77% |
- Using the CPI-U, the median weekly wage of $482 in December 1999 was equivalent to about $928 in December 2025. Over that span, the median wage’s real buying power grew by 12.1%.
The BLS has been gathering consumer price data and calculating inflation rates in one form or another since World War I, with official estimates going back even further to 1913. Today, the CPI-U is based on a monthly survey of retail prices for hundreds of specific goods and services, collectively known as the “market basket.”
The CPI-U is valued not just for its long history, which makes comparisons over time easier, but also for its timeliness, with fresh readings every month. And it has a close connection with household spending on a wide range of goods and services. If you want to know how the price of milk has changed since the 1950s, it’s hard to beat the CPI-U.
Related: What’s inside the consumer price index?
The CPI-U tends to produce higher inflation readings than other measures, and some economists have argued that it overstates actual inflation. One criticism is that the CPI-U is slow to reflect changes in consumer buying habits. For instance, if steak prices rise and consumers respond by switching to buying cheaper chicken, the market basket that underpins the index may have too much steak in it and not enough chicken, pushing up the reported inflation rate.
For many decades, the BLS only updated the makeup of its market basket every 10 or 15 years. The agency now updates its basket annually, but the criticisms have persisted (as have other critiques, such as its way of estimating shelter costs). Other analysts have defended the CPI’s basic methodology as fundamentally sound but have suggested additional ways to improve its timeliness.
Measuring inflation with other versions of the Consumer Price Index
The Consumer Price Index has several other variants, some of which try to address the perceived shortcomings of the main index. Some of the more prominent alternatives are the “Chained Consumer Price Index” (C-CPI-U) and the “Consumer Price Index retroactive series using current methods” (R-CPI-U-RS).

| Date | Main CPI | CPI retroactive series | Chained CPI | PCE |
|---|---|---|---|---|
| 1971-01-01 | 5.29% | 4.44% | ||
| 1971-02-01 | 5.00% | 4.33% | ||
| 1971-03-01 | 4.71% | 4.41% | ||
| 1971-04-01 | 4.16% | 4.30% | ||
| 1971-05-01 | 4.40% | 4.40% | ||
| 1971-06-01 | 4.64% | 4.59% | ||
| 1971-07-01 | 4.36% | 4.52% | ||
| 1971-08-01 | 4.62% | 4.55% | ||
| 1971-09-01 | 4.08% | 4.24% | ||
| 1971-10-01 | 3.81% | 3.88% | ||
| 1971-11-01 | 3.28% | 3.69% | ||
| 1971-12-01 | 3.27% | 3.64% | ||
| 1972-01-01 | 3.27% | 3.84% | ||
| 1972-02-01 | 3.51% | 3.95% | ||
| 1972-03-01 | 3.50% | 3.76% | ||
| 1972-04-01 | 3.49% | 3.51% | ||
| 1972-05-01 | 3.23% | 3.31% | ||
| 1972-06-01 | 2.71% | 3.01% | ||
| 1972-07-01 | 2.95% | 3.07% | ||
| 1972-08-01 | 2.94% | 3.07% | ||
| 1972-09-01 | 3.19% | 3.37% | ||
| 1972-10-01 | 3.42% | 3.33% | ||
| 1972-11-01 | 3.67% | 3.42% | ||
| 1972-12-01 | 3.41% | 3.35% | ||
| 1973-01-01 | 3.65% | 3.24% | ||
| 1973-02-01 | 3.87% | 3.37% | ||
| 1973-03-01 | 4.59% | 3.96% | ||
| 1973-04-01 | 5.06% | 4.57% | ||
| 1973-05-01 | 5.53% | 4.85% | ||
| 1973-06-01 | 6.00% | 5.29% | ||
| 1973-07-01 | 5.73% | 5.30% | ||
| 1973-08-01 | 7.38% | 6.20% | ||
| 1973-09-01 | 7.36% | 6.15% | ||
| 1973-10-01 | 7.80% | 6.63% | ||
| 1973-11-01 | 8.25% | 7.18% | ||
| 1973-12-01 | 8.71% | 7.72% | ||
| 1974-01-01 | 9.39% | 8.43% | ||
| 1974-02-01 | 10.02% | 9.12% | ||
| 1974-03-01 | 10.39% | 9.60% | ||
| 1974-04-01 | 10.09% | 9.56% | ||
| 1974-05-01 | 10.71% | 10.10% | ||
| 1974-06-01 | 10.86% | 10.41% | ||
| 1974-07-01 | 11.51% | 10.82% | ||
| 1974-08-01 | 10.86% | 10.70% | ||
| 1974-09-01 | 11.95% | 11.41% | ||
| 1974-10-01 | 12.06% | 11.57% | ||
| 1974-11-01 | 12.20% | 11.50% | ||
| 1974-12-01 | 12.34% | 11.46% | ||
| 1975-01-01 | 11.80% | 11.09% | ||
| 1975-02-01 | 11.23% | 10.41% | ||
| 1975-03-01 | 10.25% | 9.51% | ||
| 1975-04-01 | 10.21% | 9.11% | ||
| 1975-05-01 | 9.47% | 8.48% | ||
| 1975-06-01 | 9.39% | 8.24% | ||
| 1975-07-01 | 9.72% | 8.37% | ||
| 1975-08-01 | 8.60% | 7.71% | ||
| 1975-09-01 | 7.91% | 7.13% | ||
| 1975-10-01 | 7.44% | 6.99% | ||
| 1975-11-01 | 7.38% | 6.87% | ||
| 1975-12-01 | 6.94% | 6.62% | ||
| 1976-01-01 | 6.72% | 6.36% | ||
| 1976-02-01 | 6.29% | 5.93% | ||
| 1976-03-01 | 6.07% | 5.73% | ||
| 1976-04-01 | 6.05% | 5.61% | ||
| 1976-05-01 | 6.20% | 5.69% | ||
| 1976-06-01 | 5.97% | 5.49% | ||
| 1976-07-01 | 5.35% | 5.13% | ||
| 1976-08-01 | 5.71% | 5.25% | ||
| 1976-09-01 | 5.49% | 5.32% | ||
| 1976-10-01 | 5.46% | 5.26% | ||
| 1976-11-01 | 4.88% | 5.06% | ||
| 1976-12-01 | 4.86% | 5.07% | ||
| 1977-01-01 | 5.22% | 5.28% | ||
| 1977-02-01 | 5.91% | 5.97% | ||
| 1977-03-01 | 6.44% | 6.34% | ||
| 1977-04-01 | 6.95% | 6.72% | ||
| 1977-05-01 | 6.73% | 6.75% | ||
| 1977-06-01 | 6.87% | 6.88% | ||
| 1977-07-01 | 6.83% | 6.89% | ||
| 1977-08-01 | 6.62% | 6.80% | ||
| 1977-09-01 | 6.60% | 6.60% | ||
| 1977-10-01 | 6.39% | 6.54% | ||
| 1977-11-01 | 6.72% | 6.67% | ||
| 1977-12-01 | 6.70% | 6.59% | ||
| 1978-01-01 | 6.84% | 6.60% | ||
| 1978-02-01 | 6.43% | 6.26% | ||
| 1978-03-01 | 6.55% | 6.42% | ||
| 1978-04-01 | 6.50% | 6.60% | ||
| 1978-05-01 | 6.97% | 6.83% | ||
| 1978-06-01 | 7.41% | 6.92% | ||
| 1978-07-01 | 7.70% | 6.95% | ||
| 1978-08-01 | 7.84% | 7.00% | ||
| 1978-09-01 | 8.31% | 7.20% | ||
| 1978-10-01 | 8.93% | 7.55% | ||
| 1978-11-01 | 8.89% | 7.55% | ||
| 1978-12-01 | 9.02% | 7.80% | 7.53% | |
| 1979-01-01 | 9.28% | 8.16% | 7.70% | |
| 1979-02-01 | 9.86% | 8.51% | 7.78% | |
| 1979-03-01 | 10.09% | 8.74% | 7.92% | |
| 1979-04-01 | 10.49% | 8.86% | 8.23% | |
| 1979-05-01 | 10.85% | 9.07% | 8.57% | |
| 1979-06-01 | 10.89% | 9.19% | 8.76% | |
| 1979-07-01 | 11.26% | 9.62% | 8.99% | |
| 1979-08-01 | 11.82% | 9.95% | 9.27% | |
| 1979-09-01 | 12.18% | 10.37% | 9.61% | |
| 1979-10-01 | 12.07% | 10.50% | 9.63% | |
| 1979-11-01 | 12.61% | 10.44% | 9.77% | |
| 1979-12-01 | 13.29% | 10.85% | 10.18% | |
| 1980-01-01 | 13.91% | 11.13% | 10.50% | |
| 1980-02-01 | 14.18% | 11.58% | 11.10% | |
| 1980-03-01 | 14.76% | 11.83% | 11.60% | |
| 1980-04-01 | 14.73% | 11.54% | 11.02% | |
| 1980-05-01 | 14.41% | 11.24% | 10.74% | |
| 1980-06-01 | 14.38% | 11.04% | 10.52% | |
| 1980-07-01 | 13.13% | 10.77% | 10.54% | |
| 1980-08-01 | 12.87% | 10.86% | 10.61% | |
| 1980-09-01 | 12.60% | 10.93% | 10.66% | |
| 1980-10-01 | 12.77% | 10.86% | 10.64% | |
| 1980-11-01 | 12.65% | 10.97% | 10.78% | |
| 1980-12-01 | 12.52% | 10.79% | 10.57% | |
| 1981-01-01 | 11.83% | 10.60% | 10.47% | |
| 1981-02-01 | 11.41% | 10.46% | 10.39% | |
| 1981-03-01 | 10.49% | 10.10% | 9.81% | |
| 1981-04-01 | 10.00% | 9.94% | 9.72% | |
| 1981-05-01 | 9.78% | 9.71% | 9.36% | |
| 1981-06-01 | 9.55% | 9.47% | 9.11% | |
| 1981-07-01 | 10.76% | 9.57% | 8.92% | |
| 1981-08-01 | 10.80% | 9.41% | 8.70% | |
| 1981-09-01 | 10.95% | 9.16% | 8.35% | |
| 1981-10-01 | 10.14% | 8.95% | 7.98% | |
| 1981-11-01 | 9.59% | 8.67% | 7.68% | |
| 1981-12-01 | 8.92% | 8.31% | 7.32% | |
| 1982-01-01 | 8.39% | 7.93% | 6.93% | |
| 1982-02-01 | 7.62% | 7.03% | 6.18% | |
| 1982-03-01 | 6.78% | 6.31% | 5.71% | |
| 1982-04-01 | 6.51% | 5.76% | 5.31% | |
| 1982-05-01 | 6.68% | 5.95% | 5.46% | |
| 1982-06-01 | 7.06% | 6.34% | 5.80% | |
| 1982-07-01 | 6.44% | 6.30% | 5.79% | |
| 1982-08-01 | 5.85% | 5.76% | 5.46% | |
| 1982-09-01 | 5.04% | 5.43% | 5.11% | |
| 1982-10-01 | 5.14% | 5.48% | 5.23% | |
| 1982-11-01 | 4.59% | 5.32% | 4.98% | |
| 1982-12-01 | 3.83% | 5.02% | 4.81% | |
| 1983-01-01 | 3.71% | 4.72% | 4.68% | |
| 1983-02-01 | 3.49% | 4.42% | 4.54% | |
| 1983-03-01 | 3.60% | 4.35% | 4.41% | |
| 1983-04-01 | 3.90% | 5.10% | 4.83% | |
| 1983-05-01 | 3.55% | 4.86% | 4.51% | |
| 1983-06-01 | 2.58% | 4.20% | 4.15% | |
| 1983-07-01 | 2.46% | 3.91% | 4.12% | |
| 1983-08-01 | 2.56% | 4.03% | 4.24% | |
| 1983-09-01 | 2.86% | 4.08% | 4.32% | |
| 1983-10-01 | 2.85% | 3.86% | 3.91% | |
| 1983-11-01 | 3.27% | 3.72% | 3.74% | |
| 1983-12-01 | 3.79% | 3.78% | 3.64% | |
| 1984-01-01 | 4.19% | 4.11% | 3.61% | |
| 1984-02-01 | 4.60% | 4.57% | 4.13% | |
| 1984-03-01 | 4.80% | 4.70% | 4.34% | |
| 1984-04-01 | 4.56% | 4.33% | 4.26% | |
| 1984-05-01 | 4.23% | 4.11% | 4.10% | |
| 1984-06-01 | 4.22% | 4.03% | 3.90% | |
| 1984-07-01 | 4.20% | 3.95% | 3.68% | |
| 1984-08-01 | 4.29% | 4.07% | 3.56% | |
| 1984-09-01 | 4.27% | 3.98% | 3.34% | |
| 1984-10-01 | 4.26% | 3.97% | 3.40% | |
| 1984-11-01 | 4.05% | 3.91% | 3.40% | |
| 1984-12-01 | 3.95% | 3.84% | 3.64% | |
| 1985-01-01 | 3.53% | 3.37% | 3.70% | |
| 1985-02-01 | 3.52% | 3.29% | 3.49% | |
| 1985-03-01 | 3.70% | 3.54% | 3.56% | |
| 1985-04-01 | 3.69% | 3.52% | 3.31% | |
| 1985-05-01 | 3.77% | 3.57% | 3.43% | |
| 1985-06-01 | 3.76% | 3.56% | 3.52% | |
| 1985-07-01 | 3.55% | 3.43% | 3.41% | |
| 1985-08-01 | 3.35% | 3.17% | 3.43% | |
| 1985-09-01 | 3.14% | 3.09% | 3.47% | |
| 1985-10-01 | 3.23% | 3.08% | 3.39% | |
| 1985-11-01 | 3.51% | 3.39% | 3.55% | |
| 1985-12-01 | 3.80% | 3.57% | 3.60% | |
| 1986-01-01 | 3.89% | 3.75% | 3.56% | |
| 1986-02-01 | 3.11% | 3.00% | 3.09% | |
| 1986-03-01 | 2.26% | 2.07% | 2.46% | |
| 1986-04-01 | 1.59% | 1.40% | 2.10% | |
| 1986-05-01 | 1.49% | 1.33% | 2.05% | |
| 1986-06-01 | 1.77% | 1.57% | 2.15% | |
| 1986-07-01 | 1.58% | 1.39% | 1.92% | |
| 1986-08-01 | 1.57% | 1.38% | 1.72% | |
| 1986-09-01 | 1.75% | 1.56% | 1.88% | |
| 1986-10-01 | 1.47% | 1.38% | 1.89% | |
| 1986-11-01 | 1.28% | 1.07% | 1.78% | |
| 1986-12-01 | 1.10% | 0.89% | 1.58% | |
| 1987-01-01 | 1.46% | 1.19% | 1.59% | |
| 1987-02-01 | 2.10% | 1.90% | 1.94% | |
| 1987-03-01 | 3.03% | 2.81% | 2.44% | |
| 1987-04-01 | 3.78% | 3.59% | 3.03% | |
| 1987-05-01 | 3.86% | 3.58% | 3.10% | |
| 1987-06-01 | 3.65% | 3.45% | 3.11% | |
| 1987-07-01 | 3.93% | 3.63% | 3.32% | |
| 1987-08-01 | 4.28% | 4.04% | 3.60% | |
| 1987-09-01 | 4.36% | 3.96% | 3.61% | |
| 1987-10-01 | 4.53% | 4.13% | 3.75% | |
| 1987-11-01 | 4.53% | 4.19% | 3.76% | |
| 1987-12-01 | 4.43% | 4.07% | 3.81% | |
| 1988-01-01 | 4.05% | 3.75% | 3.73% | |
| 1988-02-01 | 3.94% | 3.50% | 3.52% | |
| 1988-03-01 | 3.93% | 3.49% | 3.60% | |
| 1988-04-01 | 3.90% | 3.47% | 3.72% | |
| 1988-05-01 | 3.89% | 3.52% | 3.75% | |
| 1988-06-01 | 3.96% | 3.51% | 3.80% | |
| 1988-07-01 | 4.13% | 3.73% | 4.07% | |
| 1988-08-01 | 4.02% | 3.59% | 3.96% | |
| 1988-09-01 | 4.17% | 3.75% | 4.12% | |
| 1988-10-01 | 4.25% | 3.80% | 4.13% | |
| 1988-11-01 | 4.25% | 3.79% | 4.17% | |
| 1988-12-01 | 4.42% | 3.91% | 4.30% | |
| 1989-01-01 | 4.67% | 4.12% | 4.43% | |
| 1989-02-01 | 4.83% | 4.29% | 4.63% | |
| 1989-03-01 | 4.98% | 4.44% | 4.66% | |
| 1989-04-01 | 5.12% | 4.64% | 4.84% | |
| 1989-05-01 | 5.36% | 4.79% | 4.92% | |
| 1989-06-01 | 5.17% | 4.66% | 4.71% | |
| 1989-07-01 | 4.98% | 4.54% | 4.45% | |
| 1989-08-01 | 4.71% | 4.19% | 4.15% | |
| 1989-09-01 | 4.34% | 3.89% | 3.88% | |
| 1989-10-01 | 4.49% | 4.04% | 3.94% | |
| 1989-11-01 | 4.66% | 4.15% | 3.93% | |
| 1989-12-01 | 4.65% | 4.20% | 3.91% | |
| 1990-01-01 | 5.20% | 4.72% | 4.16% | |
| 1990-02-01 | 5.26% | 4.87% | 4.27% | |
| 1990-03-01 | 5.23% | 4.84% | 4.28% | |
| 1990-04-01 | 4.71% | 4.27% | 3.80% | |
| 1990-05-01 | 4.36% | 3.93% | 3.66% | |
| 1990-06-01 | 4.67% | 4.24% | 3.89% | |
| 1990-07-01 | 4.82% | 4.39% | 3.90% | |
| 1990-08-01 | 5.62% | 5.18% | 4.58% | |
| 1990-09-01 | 6.16% | 5.69% | 4.98% | |
| 1990-10-01 | 6.29% | 5.82% | 5.17% | |
| 1990-11-01 | 6.27% | 5.81% | 5.08% | |
| 1990-12-01 | 6.11% | 5.70% | 4.87% | |
| 1991-01-01 | 5.65% | 5.13% | 4.48% | |
| 1991-02-01 | 5.31% | 4.74% | 4.08% | |
| 1991-03-01 | 4.90% | 4.31% | 3.71% | |
| 1991-04-01 | 4.89% | 4.25% | 3.68% | |
| 1991-05-01 | 4.95% | 4.40% | 3.87% | |
| 1991-06-01 | 4.70% | 4.07% | 3.59% | |
| 1991-07-01 | 4.45% | 3.75% | 3.50% | |
| 1991-08-01 | 3.80% | 3.12% | 3.05% | |
| 1991-09-01 | 3.39% | 2.74% | 2.78% | |
| 1991-10-01 | 2.92% | 2.23% | 2.38% | |
| 1991-11-01 | 2.99% | 2.33% | 2.48% | |
| 1991-12-01 | 3.06% | 2.38% | 2.64% | |
| 1992-01-01 | 2.60% | 2.12% | 2.39% | |
| 1992-02-01 | 2.82% | 2.26% | 2.60% | |
| 1992-03-01 | 3.19% | 2.61% | 2.82% | |
| 1992-04-01 | 3.18% | 2.70% | 2.91% | |
| 1992-05-01 | 3.02% | 2.55% | 2.63% | |
| 1992-06-01 | 3.09% | 2.54% | 2.63% | |
| 1992-07-01 | 3.16% | 2.64% | 2.81% | |
| 1992-08-01 | 3.15% | 2.63% | 2.71% | |
| 1992-09-01 | 2.99% | 2.47% | 2.52% | |
| 1992-10-01 | 3.20% | 2.72% | 2.70% | |
| 1992-11-01 | 3.05% | 2.61% | 2.67% | |
| 1992-12-01 | 2.90% | 2.47% | 2.59% | |
| 1993-01-01 | 3.26% | 2.61% | 2.70% | |
| 1993-02-01 | 3.25% | 2.70% | 2.60% | |
| 1993-03-01 | 3.09% | 2.59% | 2.56% | |
| 1993-04-01 | 3.23% | 2.63% | 2.56% | |
| 1993-05-01 | 3.22% | 2.72% | 2.74% | |
| 1993-06-01 | 3.00% | 2.62% | 2.59% | |
| 1993-07-01 | 2.78% | 2.48% | 2.42% | |
| 1993-08-01 | 2.77% | 2.42% | 2.45% | |
| 1993-09-01 | 2.69% | 2.27% | 2.39% | |
| 1993-10-01 | 2.75% | 2.31% | 2.35% | |
| 1993-11-01 | 2.68% | 2.26% | 2.35% | |
| 1993-12-01 | 2.75% | 2.27% | 2.19% | |
| 1994-01-01 | 2.52% | 2.12% | 1.98% | |
| 1994-02-01 | 2.52% | 2.02% | 2.06% | |
| 1994-03-01 | 2.51% | 2.06% | 2.13% | |
| 1994-04-01 | 2.36% | 1.91% | 1.98% | |
| 1994-05-01 | 2.29% | 1.81% | 1.81% | |
| 1994-06-01 | 2.49% | 2.00% | 2.03% | |
| 1994-07-01 | 2.77% | 2.18% | 2.19% | |
| 1994-08-01 | 2.90% | 2.32% | 2.25% | |
| 1994-09-01 | 2.96% | 2.36% | 2.25% | |
| 1994-10-01 | 2.61% | 2.08% | 2.11% | |
| 1994-11-01 | 2.67% | 2.12% | 2.11% | |
| 1994-12-01 | 2.67% | 2.17% | 2.15% | |
| 1995-01-01 | 2.80% | 2.35% | 2.32% | |
| 1995-02-01 | 2.86% | 2.44% | 2.27% | |
| 1995-03-01 | 2.85% | 2.38% | 2.17% | |
| 1995-04-01 | 3.05% | 2.61% | 2.32% | |
| 1995-05-01 | 3.19% | 2.65% | 2.33% | |
| 1995-06-01 | 3.04% | 2.60% | 2.18% | |
| 1995-07-01 | 2.76% | 2.41% | 1.99% | |
| 1995-08-01 | 2.62% | 2.27% | 1.97% | |
| 1995-09-01 | 2.54% | 2.26% | 1.93% | |
| 1995-10-01 | 2.81% | 2.49% | 2.02% | |
| 1995-11-01 | 2.61% | 2.26% | 1.82% | |
| 1995-12-01 | 2.54% | 2.26% | 1.95% | |
| 1996-01-01 | 2.73% | 2.39% | 1.97% | |
| 1996-02-01 | 2.65% | 2.42% | 1.95% | |
| 1996-03-01 | 2.84% | 2.59% | 2.07% | |
| 1996-04-01 | 2.90% | 2.63% | 2.11% | |
| 1996-05-01 | 2.89% | 2.71% | 2.13% | |
| 1996-06-01 | 2.75% | 2.53% | 2.03% | |
| 1996-07-01 | 2.95% | 2.66% | 2.12% | |
| 1996-08-01 | 2.88% | 2.57% | 1.99% | |
| 1996-09-01 | 3.00% | 2.74% | 2.21% | |
| 1996-10-01 | 2.99% | 2.78% | 2.26% | |
| 1996-11-01 | 3.26% | 3.05% | 2.44% | |
| 1996-12-01 | 3.32% | 3.09% | 2.36% | |
| 1997-01-01 | 3.04% | 2.90% | 2.27% | |
| 1997-02-01 | 3.03% | 2.80% | 2.32% | |
| 1997-03-01 | 2.76% | 2.53% | 2.12% | |
| 1997-04-01 | 2.50% | 2.30% | 1.92% | |
| 1997-05-01 | 2.23% | 1.99% | 1.69% | |
| 1997-06-01 | 2.30% | 2.12% | 1.83% | |
| 1997-07-01 | 2.23% | 1.99% | 1.67% | |
| 1997-08-01 | 2.23% | 2.07% | 1.66% | |
| 1997-09-01 | 2.15% | 2.07% | 1.61% | |
| 1997-10-01 | 2.08% | 1.93% | 1.44% | |
| 1997-11-01 | 1.83% | 1.71% | 1.26% | |
| 1997-12-01 | 1.70% | 1.54% | 1.13% | |
| 1998-01-01 | 1.57% | 1.41% | 1.04% | |
| 1998-02-01 | 1.44% | 1.32% | 0.78% | |
| 1998-03-01 | 1.37% | 1.23% | 0.69% | |
| 1998-04-01 | 1.44% | 1.32% | 0.72% | |
| 1998-05-01 | 1.69% | 1.53% | 0.90% | |
| 1998-06-01 | 1.68% | 1.40% | 0.69% | |
| 1998-07-01 | 1.68% | 1.48% | 0.88% | |
| 1998-08-01 | 1.62% | 1.44% | 0.93% | |
| 1998-09-01 | 1.49% | 1.22% | 0.63% | |
| 1998-10-01 | 1.49% | 1.26% | 0.72% | |
| 1998-11-01 | 1.55% | 1.31% | 0.72% | |
| 1998-12-01 | 1.61% | 1.39% | 0.84% | |
| 1999-01-01 | 1.67% | 1.47% | 0.94% | |
| 1999-02-01 | 1.61% | 1.43% | 0.93% | |
| 1999-03-01 | 1.73% | 1.60% | 0.99% | |
| 1999-04-01 | 2.28% | 2.10% | 1.35% | |
| 1999-05-01 | 2.09% | 1.92% | 1.28% | |
| 1999-06-01 | 1.96% | 1.92% | 1.40% | |
| 1999-07-01 | 2.14% | 2.09% | 1.42% | |
| 1999-08-01 | 2.26% | 2.25% | 1.46% | |
| 1999-09-01 | 2.63% | 2.58% | 1.89% | |
| 1999-10-01 | 2.56% | 2.58% | 1.83% | |
| 1999-11-01 | 2.62% | 2.62% | 1.92% | |
| 1999-12-01 | 2.68% | 2.70% | 2.05% | |
| 2000-01-01 | 2.74% | 2.78% | 2.19% | |
| 2000-02-01 | 3.22% | 3.28% | 2.57% | |
| 2000-03-01 | 3.76% | 3.80% | 2.93% | |
| 2000-04-01 | 3.07% | 3.12% | 2.35% | |
| 2000-05-01 | 3.19% | 3.20% | 2.37% | |
| 2000-06-01 | 3.73% | 3.78% | 2.68% | |
| 2000-07-01 | 3.66% | 3.68% | 2.67% | |
| 2000-08-01 | 3.41% | 3.39% | 2.48% | |
| 2000-09-01 | 3.45% | 3.49% | 2.55% | |
| 2000-10-01 | 3.45% | 3.40% | 2.51% | |
| 2000-11-01 | 3.45% | 3.44% | 2.57% | |
| 2000-12-01 | 3.39% | 3.36% | 2.60% | 2.48% |
| 2001-01-01 | 3.73% | 3.72% | 2.99% | 2.70% |
| 2001-02-01 | 3.53% | 3.53% | 2.78% | 2.54% |
| 2001-03-01 | 2.92% | 2.95% | 2.26% | 2.11% |
| 2001-04-01 | 3.27% | 3.30% | 2.56% | 2.37% |
| 2001-05-01 | 3.62% | 3.62% | 2.85% | 2.56% |
| 2001-06-01 | 3.25% | 3.24% | 2.64% | 2.39% |
| 2001-07-01 | 2.72% | 2.72% | 2.15% | 2.10% |
| 2001-08-01 | 2.72% | 2.76% | 2.25% | 2.10% |
| 2001-09-01 | 2.65% | 2.59% | 2.04% | 1.31% |
| 2001-10-01 | 2.13% | 2.16% | 1.75% | 1.53% |
| 2001-11-01 | 1.90% | 1.88% | 1.56% | 1.32% |
| 2001-12-01 | 1.55% | 1.57% | 1.27% | 1.06% |
| 2002-01-01 | 1.14% | 1.17% | 0.87% | 0.67% |
| 2002-02-01 | 1.14% | 1.12% | 0.77% | 0.68% |
| 2002-03-01 | 1.48% | 1.43% | 1.15% | 0.94% |
| 2002-04-01 | 1.64% | 1.62% | 1.34% | 1.19% |
| 2002-05-01 | 1.18% | 1.19% | 0.96% | 0.99% |
| 2002-06-01 | 1.07% | 1.07% | 0.76% | 0.94% |
| 2002-07-01 | 1.46% | 1.46% | 1.15% | 1.19% |
| 2002-08-01 | 1.80% | 1.77% | 1.34% | 1.40% |
| 2002-09-01 | 1.51% | 1.53% | 1.33% | 1.93% |
| 2002-10-01 | 2.03% | 2.03% | 1.62% | 1.76% |
| 2002-11-01 | 2.20% | 2.23% | 1.82% | 1.93% |
| 2002-12-01 | 2.38% | 2.39% | 2.02% | 2.13% |
| 2003-01-01 | 2.60% | 2.54% | 2.21% | 2.35% |
| 2003-02-01 | 2.98% | 2.99% | 2.68% | 2.60% |
| 2003-03-01 | 3.02% | 3.05% | 2.66% | 2.59% |
| 2003-04-01 | 2.22% | 2.20% | 1.99% | 1.99% |
| 2003-05-01 | 2.06% | 2.09% | 1.80% | 1.80% |
| 2003-06-01 | 2.11% | 2.12% | 1.89% | 1.79% |
| 2003-07-01 | 2.11% | 2.12% | 1.89% | 1.86% |
| 2003-08-01 | 2.16% | 2.15% | 2.08% | 2.01% |
| 2003-09-01 | 2.32% | 2.34% | 2.07% | 2.14% |
| 2003-10-01 | 2.04% | 2.07% | 1.88% | 1.97% |
| 2003-11-01 | 1.77% | 1.77% | 1.60% | 2.00% |
| 2003-12-01 | 1.88% | 1.88% | 1.70% | 2.12% |
| 2004-01-01 | 1.93% | 1.99% | 1.88% | 2.21% |
| 2004-02-01 | 1.69% | 1.71% | 1.68% | 2.00% |
| 2004-03-01 | 1.74% | 1.74% | 1.67% | 1.90% |
| 2004-04-01 | 2.29% | 2.34% | 2.14% | 2.26% |
| 2004-05-01 | 3.05% | 3.05% | 2.88% | 2.71% |
| 2004-06-01 | 3.27% | 3.23% | 2.97% | 2.89% |
| 2004-07-01 | 2.99% | 3.00% | 2.79% | 2.68% |
| 2004-08-01 | 2.65% | 2.66% | 2.31% | 2.39% |
| 2004-09-01 | 2.54% | 2.54% | 2.30% | 2.27% |
| 2004-10-01 | 3.19% | 3.17% | 2.95% | 2.70% |
| 2004-11-01 | 3.52% | 3.55% | 3.33% | 2.97% |
| 2004-12-01 | 3.26% | 3.26% | 3.15% | 2.79% |
| 2005-01-01 | 2.97% | 2.91% | 2.58% | 2.53% |
| 2005-02-01 | 3.01% | 2.96% | 2.57% | 2.60% |
| 2005-03-01 | 3.15% | 3.13% | 2.64% | 2.75% |
| 2005-04-01 | 3.51% | 3.48% | 3.09% | 2.84% |
| 2005-05-01 | 2.80% | 2.85% | 2.44% | 2.57% |
| 2005-06-01 | 2.53% | 2.52% | 2.17% | 2.34% |
| 2005-07-01 | 3.17% | 3.13% | 2.71% | 2.68% |
| 2005-08-01 | 3.64% | 3.63% | 3.25% | 3.04% |
| 2005-09-01 | 4.69% | 4.67% | 4.14% | 3.83% |
| 2005-10-01 | 4.35% | 4.36% | 3.67% | 3.55% |
| 2005-11-01 | 3.46% | 3.43% | 2.96% | 2.94% |
| 2005-12-01 | 3.42% | 3.40% | 2.88% | 2.88% |
| 2006-01-01 | 3.99% | 4.01% | 3.50% | 3.25% |
| 2006-02-01 | 3.60% | 3.59% | 3.13% | 3.02% |
| 2006-03-01 | 3.36% | 3.39% | 3.02% | 2.91% |
| 2006-04-01 | 3.55% | 3.54% | 3.09% | 3.10% |
| 2006-05-01 | 4.17% | 4.10% | 3.71% | 3.32% |
| 2006-06-01 | 4.32% | 4.35% | 3.98% | 3.51% |
| 2006-07-01 | 4.15% | 4.15% | 3.87% | 3.43% |
| 2006-08-01 | 3.82% | 3.85% | 3.50% | 3.34% |
| 2006-09-01 | 2.06% | 2.09% | 1.90% | 2.08% |
| 2006-10-01 | 1.31% | 1.30% | 1.21% | 1.68% |
| 2006-11-01 | 1.97% | 2.00% | 1.74% | 1.92% |
| 2006-12-01 | 2.54% | 2.56% | 2.27% | 2.29% |
| 2007-01-01 | 2.08% | 2.10% | 1.85% | 2.13% |
| 2007-02-01 | 2.42% | 2.44% | 2.15% | 2.39% |
| 2007-03-01 | 2.78% | 2.76% | 2.51% | 2.56% |
| 2007-04-01 | 2.57% | 2.57% | 2.37% | 2.33% |
| 2007-05-01 | 2.69% | 2.73% | 2.38% | 2.35% |
| 2007-06-01 | 2.69% | 2.69% | 2.33% | 2.32% |
| 2007-07-01 | 2.36% | 2.38% | 1.93% | 2.12% |
| 2007-08-01 | 1.97% | 1.94% | 1.68% | 1.87% |
| 2007-09-01 | 2.76% | 2.76% | 2.41% | 2.53% |
| 2007-10-01 | 3.54% | 3.51% | 3.23% | 3.09% |
| 2007-11-01 | 4.31% | 4.30% | 3.92% | 3.60% |
| 2007-12-01 | 4.08% | 4.09% | 3.67% | 3.47% |
| 2008-01-01 | 4.28% | 4.28% | 3.87% | 3.39% |
| 2008-02-01 | 4.03% | 4.02% | 3.71% | 3.27% |
| 2008-03-01 | 3.98% | 3.98% | 3.71% | 3.19% |
| 2008-04-01 | 3.94% | 3.96% | 3.72% | 3.14% |
| 2008-05-01 | 4.18% | 4.16% | 4.06% | 3.28% |
| 2008-06-01 | 5.02% | 5.01% | 4.87% | 3.81% |
| 2008-07-01 | 5.60% | 5.60% | 5.43% | 4.14% |
| 2008-08-01 | 5.37% | 5.38% | 5.24% | 3.98% |
| 2008-09-01 | 4.94% | 4.94% | 4.90% | 3.67% |
| 2008-10-01 | 3.66% | 3.66% | 3.82% | 2.67% |
| 2008-11-01 | 1.07% | 1.07% | 1.29% | 0.93% |
| 2008-12-01 | 0.09% | 0.06% | 0.22% | 0.13% |
| 2009-01-01 | 0.03% | 0.03% | 0.19% | -0.11% |
| 2009-02-01 | 0.24% | 0.23% | 0.28% | -0.13% |
| 2009-03-01 | -0.38% | -0.38% | -0.42% | -0.53% |
| 2009-04-01 | -0.74% | -0.73% | -0.86% | -0.57% |
| 2009-05-01 | -1.28% | -1.26% | -1.39% | -0.89% |
| 2009-06-01 | -1.43% | -1.40% | -1.44% | -1.02% |
| 2009-07-01 | -2.10% | -2.11% | -2.07% | -1.47% |
| 2009-08-01 | -1.48% | -1.46% | -1.56% | -1.10% |
| 2009-09-01 | -1.29% | -1.28% | -1.46% | -1.02% |
| 2009-10-01 | -0.18% | -0.16% | -0.56% | 0.01% |
| 2009-11-01 | 1.84% | 1.83% | 1.42% | 1.46% |
| 2009-12-01 | 2.72% | 2.72% | 2.46% | 2.09% |
| 2010-01-01 | 2.63% | 2.62% | 2.37% | 2.30% |
| 2010-02-01 | 2.14% | 2.15% | 1.94% | 2.12% |
| 2010-03-01 | 2.31% | 2.31% | 2.15% | 2.37% |
| 2010-04-01 | 2.24% | 2.24% | 2.09% | 2.28% |
| 2010-05-01 | 2.02% | 2.01% | 1.82% | 2.21% |
| 2010-06-01 | 1.05% | 1.04% | 0.83% | 1.56% |
| 2010-07-01 | 1.24% | 1.27% | 1.00% | 1.64% |
| 2010-08-01 | 1.15% | 1.14% | 0.91% | 1.48% |
| 2010-09-01 | 1.14% | 1.14% | 0.90% | 1.42% |
| 2010-10-01 | 1.17% | 1.17% | 0.94% | 1.36% |
| 2010-11-01 | 1.14% | 1.13% | 0.91% | 1.31% |
| 2010-12-01 | 1.50% | 1.52% | 1.28% | 1.48% |
| 2011-01-01 | 1.63% | 1.64% | 1.43% | 1.56% |
| 2011-02-01 | 2.11% | 2.11% | 1.91% | 1.85% |
| 2011-03-01 | 2.68% | 2.69% | 2.51% | 2.11% |
| 2011-04-01 | 3.16% | 3.16% | 3.08% | 2.49% |
| 2011-05-01 | 3.57% | 3.59% | 3.44% | 2.77% |
| 2011-06-01 | 3.56% | 3.57% | 3.45% | 2.79% |
| 2011-07-01 | 3.63% | 3.63% | 3.54% | 2.88% |
| 2011-08-01 | 3.77% | 3.78% | 3.65% | 2.98% |
| 2011-09-01 | 3.87% | 3.87% | 3.82% | 3.02% |
| 2011-10-01 | 3.53% | 3.55% | 3.50% | 2.69% |
| 2011-11-01 | 3.39% | 3.43% | 3.40% | 2.70% |
| 2011-12-01 | 2.96% | 2.99% | 2.93% | 2.53% |
| 2012-01-01 | 2.93% | 2.97% | 2.89% | 2.57% |
| 2012-02-01 | 2.87% | 2.90% | 2.82% | 2.51% |
| 2012-03-01 | 2.65% | 2.68% | 2.58% | 2.30% |
| 2012-04-01 | 2.30% | 2.33% | 2.16% | 2.00% |
| 2012-05-01 | 1.70% | 1.72% | 1.66% | 1.58% |
| 2012-06-01 | 1.66% | 1.69% | 1.63% | 1.55% |
| 2012-07-01 | 1.41% | 1.45% | 1.34% | 1.41% |
| 2012-08-01 | 1.69% | 1.75% | 1.59% | 1.51% |
| 2012-09-01 | 1.99% | 2.04% | 1.80% | 1.68% |
| 2012-10-01 | 2.16% | 2.20% | 1.93% | 1.98% |
| 2012-11-01 | 1.76% | 1.81% | 1.55% | 1.70% |
| 2012-12-01 | 1.74% | 1.78% | 1.48% | 1.62% |
| 2013-01-01 | 1.59% | 1.62% | 1.30% | 1.47% |
| 2013-02-01 | 1.98% | 2.04% | 1.72% | 1.60% |
| 2013-03-01 | 1.47% | 1.52% | 1.25% | 1.28% |
| 2013-04-01 | 1.06% | 1.10% | 0.86% | 1.04% |
| 2013-05-01 | 1.36% | 1.39% | 1.11% | 1.23% |
| 2013-06-01 | 1.75% | 1.81% | 1.47% | 1.51% |
| 2013-07-01 | 1.96% | 1.99% | 1.66% | 1.60% |
| 2013-08-01 | 1.52% | 1.54% | 1.26% | 1.40% |
| 2013-09-01 | 1.18% | 1.24% | 0.95% | 1.14% |
| 2013-10-01 | 0.96% | 1.00% | 0.74% | 0.98% |
| 2013-11-01 | 1.24% | 1.27% | 1.05% | 1.20% |
| 2013-12-01 | 1.50% | 1.54% | 1.32% | 1.39% |
| 2014-01-01 | 1.58% | 1.63% | 1.42% | 1.41% |
| 2014-02-01 | 1.13% | 1.17% | 1.00% | 1.09% |
| 2014-03-01 | 1.51% | 1.55% | 1.36% | 1.39% |
| 2014-04-01 | 1.95% | 2.02% | 1.76% | 1.67% |
| 2014-05-01 | 2.13% | 2.19% | 1.94% | 1.77% |
| 2014-06-01 | 2.07% | 2.13% | 1.89% | 1.65% |
| 2014-07-01 | 1.99% | 2.04% | 1.85% | 1.67% |
| 2014-08-01 | 1.70% | 1.75% | 1.51% | 1.51% |
| 2014-09-01 | 1.66% | 1.69% | 1.46% | 1.50% |
| 2014-10-01 | 1.66% | 1.69% | 1.51% | 1.33% |
| 2014-11-01 | 1.32% | 1.37% | 1.13% | 1.09% |
| 2014-12-01 | 0.76% | 0.79% | 0.52% | 0.73% |
| 2015-01-01 | -0.09% | -0.03% | -0.40% | 0.04% |
| 2015-02-01 | -0.03% | 0.03% | -0.36% | 0.17% |
| 2015-03-01 | -0.07% | -0.03% | -0.30% | 0.20% |
| 2015-04-01 | -0.20% | -0.14% | -0.40% | 0.11% |
| 2015-05-01 | -0.04% | 0.00% | -0.18% | 0.19% |
| 2015-06-01 | 0.12% | 0.17% | -0.03% | 0.27% |
| 2015-07-01 | 0.17% | 0.23% | -0.02% | 0.22% |
| 2015-08-01 | 0.20% | 0.26% | 0.00% | 0.24% |
| 2015-09-01 | -0.04% | 0.03% | -0.27% | 0.07% |
| 2015-10-01 | 0.17% | 0.23% | -0.11% | 0.10% |
| 2015-11-01 | 0.50% | 0.55% | 0.21% | 0.25% |
| 2015-12-01 | 0.73% | 0.78% | 0.43% | 0.35% |
| 2016-01-01 | 1.37% | 1.40% | 1.11% | 0.87% |
| 2016-02-01 | 1.02% | 1.04% | 0.67% | 0.64% |
| 2016-03-01 | 0.85% | 0.89% | 0.51% | 0.69% |
| 2016-04-01 | 1.13% | 1.15% | 0.82% | 0.93% |
| 2016-05-01 | 1.02% | 1.06% | 0.68% | 0.85% |
| 2016-06-01 | 1.00% | 1.00% | 0.69% | 0.83% |
| 2016-07-01 | 0.83% | 0.86% | 0.47% | 0.76% |
| 2016-08-01 | 1.06% | 1.09% | 0.66% | 0.89% |
| 2016-09-01 | 1.46% | 1.46% | 1.10% | 1.22% |
| 2016-10-01 | 1.64% | 1.66% | 1.33% | 1.43% |
| 2016-11-01 | 1.69% | 1.69% | 1.37% | 1.40% |
| 2016-12-01 | 2.07% | 2.10% | 1.81% | 1.66% |
| 2017-01-01 | 2.50% | 2.50% | 2.27% | 2.01% |
| 2017-02-01 | 2.74% | 2.73% | 2.56% | 2.20% |
| 2017-03-01 | 2.38% | 2.37% | 2.07% | 1.91% |
| 2017-04-01 | 2.20% | 2.19% | 1.82% | 1.77% |
| 2017-05-01 | 1.87% | 1.87% | 1.48% | 1.56% |
| 2017-06-01 | 1.63% | 1.64% | 1.21% | 1.47% |
| 2017-07-01 | 1.73% | 1.72% | 1.28% | 1.49% |
| 2017-08-01 | 1.94% | 1.95% | 1.53% | 1.57% |
| 2017-09-01 | 2.23% | 2.25% | 1.86% | 1.76% |
| 2017-10-01 | 2.04% | 2.03% | 1.63% | 1.68% |
| 2017-11-01 | 2.20% | 2.23% | 1.80% | 1.79% |
| 2017-12-01 | 2.11% | 2.09% | 1.69% | 1.77% |
| 2018-01-01 | 2.07% | 2.07% | 1.60% | 1.76% |
| 2018-02-01 | 2.21% | 2.23% | 1.74% | 1.84% |
| 2018-03-01 | 2.36% | 2.34% | 1.94% | 2.00% |
| 2018-04-01 | 2.46% | 2.48% | 2.05% | 2.05% |
| 2018-05-01 | 2.80% | 2.81% | 2.32% | 2.27% |
| 2018-06-01 | 2.87% | 2.86% | 2.42% | 2.27% |
| 2018-07-01 | 2.95% | 2.95% | 2.57% | 2.34% |
| 2018-08-01 | 2.70% | 2.72% | 2.29% | 2.18% |
| 2018-09-01 | 2.28% | 2.29% | 1.87% | 2.01% |
| 2018-10-01 | 2.52% | 2.57% | 2.09% | 2.05% |
| 2018-11-01 | 2.18% | 2.21% | 1.80% | 1.94% |
| 2018-12-01 | 1.91% | 1.93% | 1.54% | 1.86% |
| 2019-01-01 | 1.55% | 1.55% | 1.26% | 1.43% |
| 2019-02-01 | 1.52% | 1.52% | 1.25% | 1.40% |
| 2019-03-01 | 1.86% | 1.87% | 1.53% | 1.52% |
| 2019-04-01 | 2.00% | 1.98% | 1.60% | 1.57% |
| 2019-05-01 | 1.79% | 1.79% | 1.43% | 1.47% |
| 2019-06-01 | 1.65% | 1.67% | 1.33% | 1.43% |
| 2019-07-01 | 1.81% | 1.83% | 1.47% | 1.45% |
| 2019-08-01 | 1.75% | 1.74% | 1.46% | 1.43% |
| 2019-09-01 | 1.71% | 1.73% | 1.36% | 1.28% |
| 2019-10-01 | 1.76% | 1.78% | 1.35% | 1.29% |
| 2019-11-01 | 2.05% | 2.04% | 1.60% | 1.36% |
| 2019-12-01 | 2.29% | 2.29% | 1.80% | 1.56% |
| 2020-01-01 | 2.49% | 2.50% | 1.98% | 1.79% |
| 2020-02-01 | 2.33% | 2.34% | 1.84% | 1.69% |
| 2020-03-01 | 1.54% | 1.60% | 1.13% | 1.17% |
| 2020-04-01 | 0.33% | 0.42% | 0.15% | 0.46% |
| 2020-05-01 | 0.12% | 0.21% | -0.11% | 0.49% |
| 2020-06-01 | 0.65% | 0.78% | 0.42% | 0.76% |
| 2020-07-01 | 0.99% | 1.10% | 0.93% | 0.92% |
| 2020-08-01 | 1.31% | 1.44% | 1.30% | 1.16% |
| 2020-09-01 | 1.37% | 1.47% | 1.38% | 1.28% |
| 2020-10-01 | 1.18% | 1.25% | 1.21% | 1.19% |
| 2020-11-01 | 1.17% | 1.27% | 1.19% | 1.19% |
| 2020-12-01 | 1.36% | 1.43% | 1.50% | 1.33% |
| 2021-01-01 | 1.40% | 1.51% | 1.60% | 1.59% |
| 2021-02-01 | 1.68% | 1.81% | 1.83% | 1.84% |
| 2021-03-01 | 2.62% | 2.75% | 2.65% | 2.67% |
| 2021-04-01 | 4.16% | 4.26% | 4.00% | 3.64% |
| 2021-05-01 | 4.99% | 5.18% | 4.86% | 4.07% |
| 2021-06-01 | 5.39% | 5.56% | 5.14% | 4.31% |
| 2021-07-01 | 5.37% | 5.52% | 5.03% | 4.47% |
| 2021-08-01 | 5.25% | 5.37% | 4.81% | 4.58% |
| 2021-09-01 | 5.39% | 5.50% | 5.00% | 4.74% |
| 2021-10-01 | 6.22% | 6.38% | 5.81% | 5.34% |
| 2021-11-01 | 6.81% | 6.94% | 6.36% | 5.93% |
| 2021-12-01 | 7.04% | 7.20% | 6.50% | 6.14% |
| 2022-01-01 | 7.48% | 7.62% | 6.83% | 6.27% |
| 2022-02-01 | 7.87% | 8.02% | 7.29% | 6.55% |
| 2022-03-01 | 8.54% | 8.70% | 8.13% | 6.93% |
| 2022-04-01 | 8.26% | 8.40% | 7.93% | 6.68% |
| 2022-05-01 | 8.58% | 8.62% | 8.34% | 6.79% |
| 2022-06-01 | 9.06% | 9.08% | 8.71% | 7.24% |
| 2022-07-01 | 8.52% | 8.56% | 8.11% | 6.75% |
| 2022-08-01 | 8.26% | 8.33% | 7.89% | 6.64% |
| 2022-09-01 | 8.20% | 8.28% | 7.88% | 6.67% |
| 2022-10-01 | 7.75% | 7.80% | 7.57% | 6.46% |
| 2022-11-01 | 7.11% | 7.19% | 7.05% | 6.03% |
| 2022-12-01 | 6.45% | 6.54% | 6.44% | 5.52% |
| 2023-01-01 | 6.41% | 6.48% | 6.42% | 5.51% |
| 2023-02-01 | 6.04% | 6.08% | 5.96% | 5.20% |
| 2023-03-01 | 4.98% | 4.99% | 4.77% | 4.43% |
| 2023-04-01 | 4.93% | 4.93% | 4.69% | 4.48% |
| 2023-05-01 | 4.05% | 4.05% | 3.76% | 4.00% |
| 2023-06-01 | 2.97% | 2.97% | 2.87% | 3.28% |
| 2023-07-01 | 3.18% | 3.18% | 3.00% | 3.41% |
| 2023-08-01 | 3.67% | 3.67% | 3.47% | 3.43% |
| 2023-09-01 | 3.70% | 3.70% | 3.40% | 3.45% |
| 2023-10-01 | 3.24% | 3.24% | 2.89% | 3.02% |
| 2023-11-01 | 3.14% | 3.14% | 2.67% | 2.77% |
| 2023-12-01 | 3.35% | 3.35% | 2.86% | 2.77% |
| 2024-01-01 | 3.09% | 3.09% | 2.62% | 2.70% |
| 2024-02-01 | 3.15% | 3.15% | 2.76% | 2.71% |
| 2024-03-01 | 3.48% | 3.48% | 3.14% | 2.93% |
| 2024-04-01 | 3.36% | 3.36% | 2.98% | 2.83% |
| 2024-05-01 | 3.27% | 3.27% | 2.89% | 2.66% |
| 2024-06-01 | 2.97% | 2.97% | 2.59% | 2.55% |
| 2024-07-01 | 2.89% | 2.89% | 2.54% | 2.59% |
| 2024-08-01 | 2.53% | 2.53% | 2.17% | 2.41% |
| 2024-09-01 | 2.44% | 2.44% | 2.10% | 2.26% |
| 2024-10-01 | 2.60% | 2.60% | 2.29% | 2.48% |
| 2024-11-01 | 2.75% | 2.75% | 2.48% | 2.59% |
| 2024-12-01 | 2.89% | 2.89% | 2.64% | 2.73% |
| 2025-01-01 | 3.00% | 3.00% | 2.75% | 2.61% |
| 2025-02-01 | 2.82% | 2.82% | 2.57% | 2.71% |
| 2025-03-01 | 2.39% | 2.39% | 2.14% | 2.36% |
| 2025-04-01 | 2.31% | 2.31% | 2.09% | 2.28% |
| 2025-05-01 | 2.35% | 2.35% | 2.14% | 2.46% |
| 2025-06-01 | 2.67% | 2.67% | 2.46% | 2.59% |
| 2025-07-01 | 2.70% | 2.71% | 2.56% | 2.61% |
| 2025-08-01 | 2.92% | 2.92% | 2.81% | 2.75% |
| 2025-09-01 | 3.01% | 3.01% | 2.92% | 2.79% |
| 2025-10-01 | 2.71% | |||
| 2025-11-01 | 2.74% | 2.74% | 2.60% | 2.82% |
| 2025-12-01 | 2.68% | 2.68% | 2.51% | 2.88% |
| 2026-01-01 | 2.39% | 2.21% | 2.86% | |
| 2026-02-01 | 2.41% | 2.24% | 2.83% | |
| 2026-03-01 | 3.26% | 3.11% | 3.50% |
The BLS began producing the chained CPI in 2002, with a base month of December 1999. Unlike the main index, this measure accounts for shifts in consumer spending habits between different goods and services. The chained CPI can reflect shifting consumer buying patterns – like more chicken and less steak – faster than the CPI-U.
- Using the chained CPI, the median weekly wage of $482 in December 1999 was equivalent to nearly $866 in December 2025. The median wage’s real buying power grew by 20.1%.
Meanwhile, the CPI retroactive series is BLS’s best effort to show what inflation in the past would look like if measured consistently with today’s methods. This is important because, over its long history, the BLS has made many changes in how it collects and analyzes price data to produce the CPI-U. The retroactive series is available back to December 1977.
- Using the CPI retroactive series, the median weekly wage of $482 in December 1999 was equivalent to about $933 in December 2025. The median wage’s real buying power grew by 11.5%.
Measuring inflation with the Personal Consumption Expenditures index
Then there’s the Personal Consumption Expenditures price index, or PCE, the Federal Reserve’s preferred measure of inflation. Separately from the BLS, the Bureau of Economic Analysis produces the PCE as part of its work determining U.S. gross domestic product. The PCE is based on data about what businesses sell, unlike the many CPI variants, which rely on consumer surveys to determine what households buy.
- Using the PCE, the median weekly wage of $482 in December 1999 was equivalent to almost $852 in December 2025. The median wage’s real buying power grew by 22.1% during that period.
The PCE differs from the CPI family in several key aspects. It includes certain goods and services the CPI doesn’t, and vice versa. And even when the two indexes cover the same goods and services, they weight them differently. The formula for calculating the PCE is also fundamentally different from the CPI formula. Because of those differences, the PCE typically yields a somewhat lower estimate of inflation than the CPI family, though the overall patterns are similar and the gaps are smaller now than they used to be. (In recent months, in fact, PCE inflation has come in a bit higher than CPI inflation.)
Compared with the CPI-U, the PCE shows longer periods of real wage growth – and shorter flat periods – between 1999 and 2025.
Other factors matter, too
As mentioned above, the choice of inflation gauge is just one factor that affects whether wages have kept up with inflation. For instance, you can look at average wages (which can be skewed upward by high earners) or median wages (which are less readily available). You can include or exclude self-employment income, interest, investment dividends and government benefits.
| Date | Main CPI | CPI retroactive series | Chained CPI | PCE |
|---|---|---|---|---|
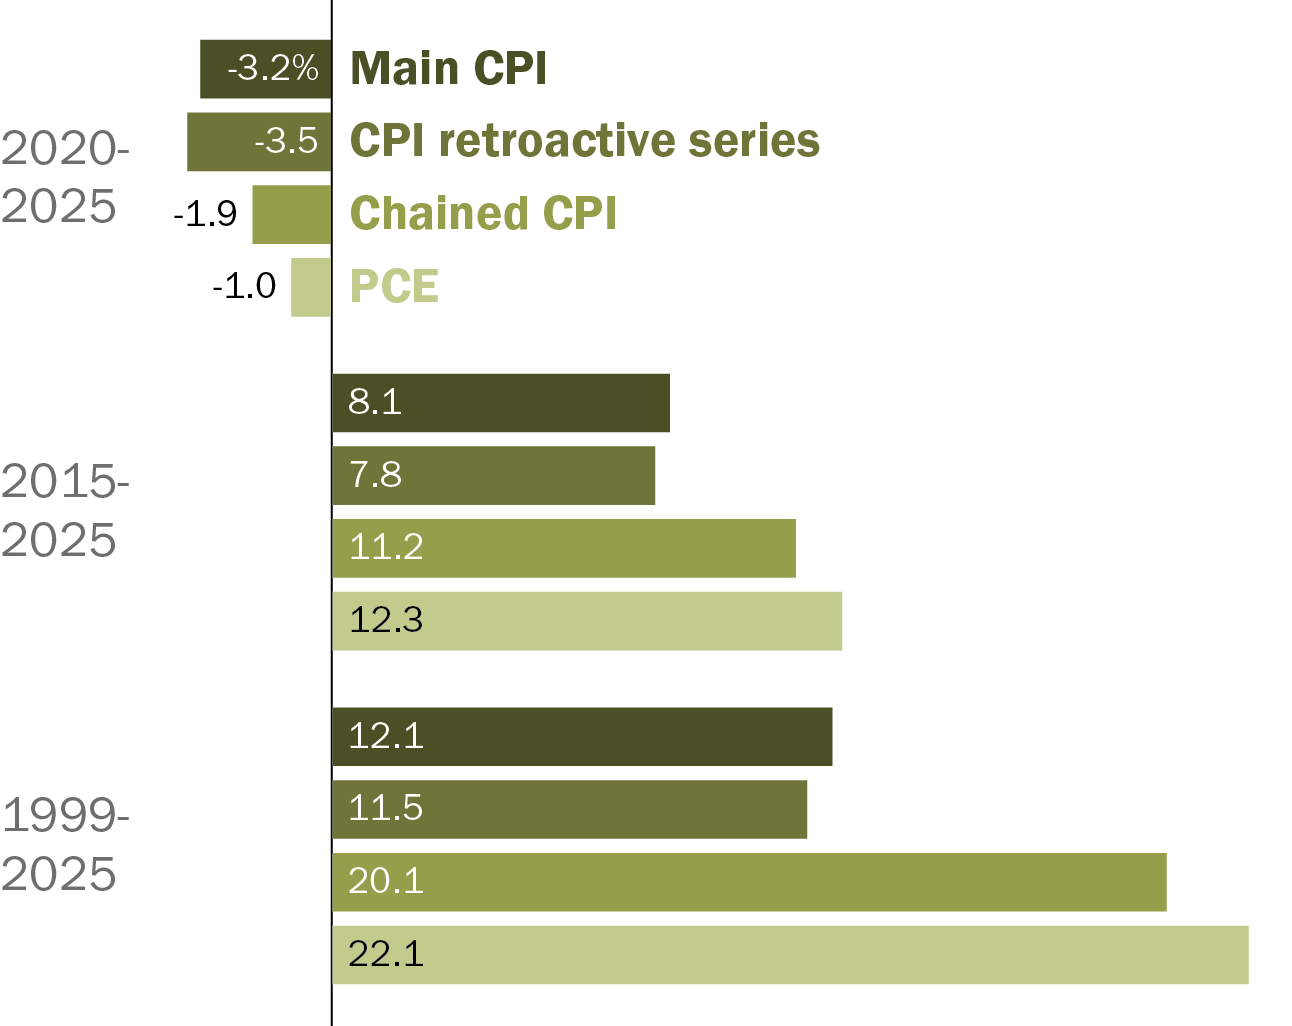
| 2020-12-01 | -3.2% | -3.5% | -1.9% | -1.0% |
| 2015-12-01 | 8.1% | 7.8% | 11.2% | 12.3% |
| 1999-12-01 | 12.1% | 11.5% | 20.1% | 22.1% |
You also need to decide which population you’re interested in: all working people, people whose income primarily comes from wages and salaries, or specific demographic groups? Do you include managers and executives along with “nonsupervisory” workers?
Especially key is the timespan you choose to examine. U.S. inflation has swung from double-digit heights in the 1970s and early 1980s to actual deflation (falling prices) in the depths of the Great Recession. The picture can change markedly depending on how many of those highs and lows you capture in your time period.
For example, from December 2015 to December 2025, median weekly wages outpaced inflation, no matter which index you use. But over the five years leading up to December 2025, real wages fell after factoring in inflation, regardless of the index.
