
Election night 2020 will bring a blizzard of numbers about voters – who turned out to vote and whom they voted for. Some of the most important questions journalists and other election-watchers will be asking require a look back at recent elections: Can Donald Trump hold on to the large advantage he had in 2016 among White voters with no college degree? Will Joe Biden improve on Hillary Clinton’s 2016 showing among young voters? Compared with 2016, Democratic candidates made significant gains among men in the 2018 midterm elections. Can Trump regain the advantage he had among men in 2016?
To assist journalists and the public in making comparisons of 2020 data to the electorates of 2016 and 2018, Pew Research Center is making available an expanded set of data tables from interviews we conducted with national samples of verified voters in the wake of the 2016 and 2018 elections.
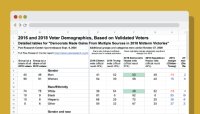
The data includes some material first published in 2018 and 2020 that has now been enhanced with additional groups and categories. The tables compile interviews with 3,770 members of the Center’s American Trends Panel interviewed from Nov. 29 to Dec. 12, 2016, and 10,640 interviewed Nov. 7-16, 2018. Interviews from 2016 were matched to five different commercial voter files that contain official records of voter registration and turnout, while the 2018 data was matched to two voter files. This process of verifying voter turnout helps to correct for the tendency of some people to overreport voting when they are asked about it in surveys and is generally regarded as providing a more accurate picture of the electorate.
The tables are provided as a convenient online Google spreadsheet that can be sorted, copied or downloaded.
Among the kinds of questions these tables can help answer:
- How did different groups vote in 2016 and 2018?
- What share of all voters did specific groups make up?
- How did the coalitions of Clinton and Trump voters differ across demographic groups?
- How did voters and nonvoters differ in 2016 and 2018?
Follow this link to access the detailed spreadsheet.
For a detailed analysis of how the 2018 electorate differed from the 2016 electorate, see “Democrats Made Gains From Multiple Sources in 2018 Midterm Victories.”
For analysis of the 2016 electorate, see “An examination of the 2016 electorate, based on validated voters.”

