American Trends Panel: Pew Research Center’s online probability survey panel, which consists of more than 12,000 adults who take two to three surveys each month. Some panelists have been participating in surveys since 2014.
Defectors/Defection: People who either switch their vote to a different party’s candidate from one election to the next, or those who in a given election do not support the candidate of the party they usually support. Also referred to as “vote switching.”
Drop off/Drop-off voters: People who vote in a given election but not in a subsequent election. The term commonly refers to people who vote in a presidential election but not in the next midterm. It can also apply to any set of elections.
Midterm elections: General elections held in all states and the District of Columbia in the even-numbered years between presidential elections. All U.S. House seats are up for election every two years, as are a third of U.S. Senate seats (senators serve six-year terms).
Mobilize: Efforts by candidates, political campaigns and other organizations to encourage or facilitate eligible citizens to turn out to vote.
Nonvoter: Citizens who didn’t have a record of voting in any voter file or told us they didn’t vote.
Panel survey: A type of survey that relies on a group of people who have agreed to participate in multiple surveys over a time period. Panel surveys make it possible to observe how individuals change over time because the answers they give to questions in a current survey can be compared with their answers from a previous survey.
Party affiliation/Party identification: Psychological attachment to a particular political party, either thinking of oneself as a member of the party or expressing greater closeness to one party than another. Our study categorizes adults as Democrats or Republicans using their self-reported party identification in a survey.
Split-ticket voting/Straight-ticket voting: Voters typically cast ballots for more than one office in a general election. People who vote only for candidates of the same party are “straight-ticket” voters, while those who vote for candidates of different parties are “split-ticket” voters.
Turnout: Refers to “turning out” to vote, or simply “voting.” Also used to refer to the share of eligible adults who voted in a given election (e.g., “The turnout in 2020 among the voting eligible population in the U.S. was 67%”).
Validated voters/Verified voter: Citizens who told us in a post-election survey that they voted in the 2022 general elections and have a record for voting in a commercial voter file. (The two terms are interchangeable).
Voter file: A list of adults that includes information such as whether a person is registered to vote, which elections they have voted in, whether they voted in person or by mail, and additional data. Voter files do not say who a voter cast a ballot for. Federal law requires states to maintain electronic voter files, and businesses assemble these files to create a nationwide list of adults along with their voter information.
Many of the prominent demographic differences that have defined the two parties’ voting coalitions in recent years persisted in the 2022 elections. Democratic voters were once again, on average, younger, more racially and ethnically diverse, and more likely to possess college degrees than Republican voters. Those who voted for a Democratic candidate for the U.S. House were also less likely to live in a rural area and more likely to be religiously unaffiliated than Republican voters.
Racial and ethnic composition of 2022 voters
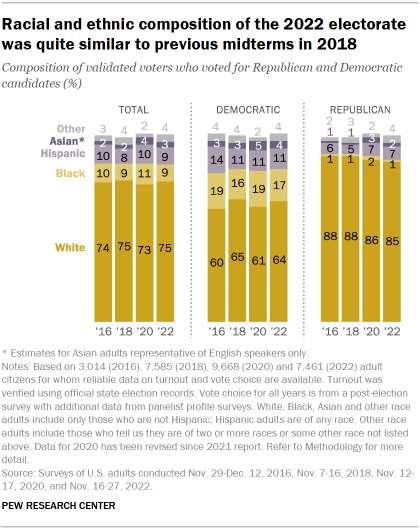
More than eight-in-ten Republican voters in 2022 (85%) were White, non-Hispanic, down slightly (from 88%) compared with the 2018 midterms. Nearly identical shares of Democratic voters in 2022 (64%) and 2018 (65%) were White.
Black, non-Hispanic voters represented 17% of Democratic voters in 2022, while Hispanic and Asian voters accounted for 11% and 4%, respectively, of the Democratic Party’s support at the polls. Hispanic voters made up 7% of Republican voters, while 2% of GOP voters were Asian and 1% were Black.
Rural, suburban and urban composition of 2022 voters
Even as the Democratic voting coalition has remained more urban and the Republican coalition more rural overall, the share of suburban voters among Democratic voters has been rising since 2016.
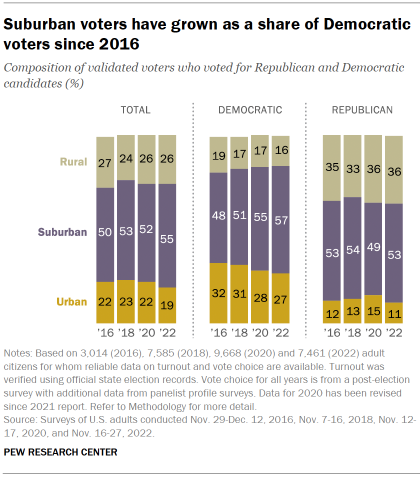
In Donald Trump’s 2016 presidential victory, suburban voters made up nearly half of Democratic voters (48%). By the 2022 midterm elections, they comprised 57% of the Democratic voting coalition. Among the electorate as a whole, the share of suburban voters was 55% in 2022, up 5 percentage points from 2016.
The share of Democratic voters who describe their communities as urban declined by 5 points since 2016 (from 32% to 27%).
Among Republican voters, shifts have been much more modest in recent years. Roughly half of Republican voters in 2022 (53%) reported living in suburban communities, while 36% reported living in rural communities and 11% in urban areas. These shares were nearly identical to the shares of Republican voters living in suburban (53%), rural (35%) and urban (12%) communities in 2016.
Educational composition of 2022 voters

A somewhat larger share of the electorate has held college degrees in each of the past two midterm elections (43% each) than in the past two presidential elections (39% in 2020, 37% in 2016).
As was the case in the 2018 midterms, voters with and without college degrees each accounted for roughly half of the Democratic Party’s voters in 2022 (51% held college degrees while 49% did not).
By contrast, a majority of Republican voters in 2022 had no college degree (63%); a smaller share had a college degree or more (37%). This is similar to the shares of Republican voters with and without a college degree in 2018.
White voters without college degrees made up a majority (54%) of Republican voters in 2022, compared with 27% of Democratic voters. Yet the share of Republican voters who are members of this group was down 4 points compared with the 2020 presidential election.
Age composition of 2022 voters
The electorate was somewhat older in 2022, on average, than in other recent elections, with 64% of validated voters ages 50 and older. And while the Democratic voting coalition was once again younger than the Republican coalition, both parties relied slightly more on the ballots of older voters than they have in other recent elections.
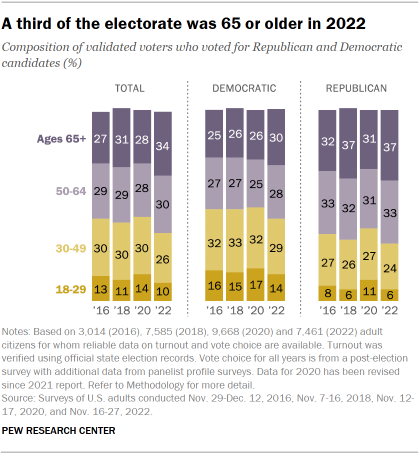
A majority of Democratic voters (57%) were ages 50 and older in the 2022 midterms, compared with 51% of Joe Biden’s voters in 2020 and 53% of voters who supported a Democratic House candidate in 2018. Just 14% of Democratic voters were under the age of 30 in 2022 — similar to the 15% of Democratic voters who were in this age group in 2018, but less than their share of Democratic voters in 2020 (17%).
Seven-in-ten Republican voters were 50 and older in the most recent election, compared with 62% of Republican voters in 2020 and 68% in 2018.
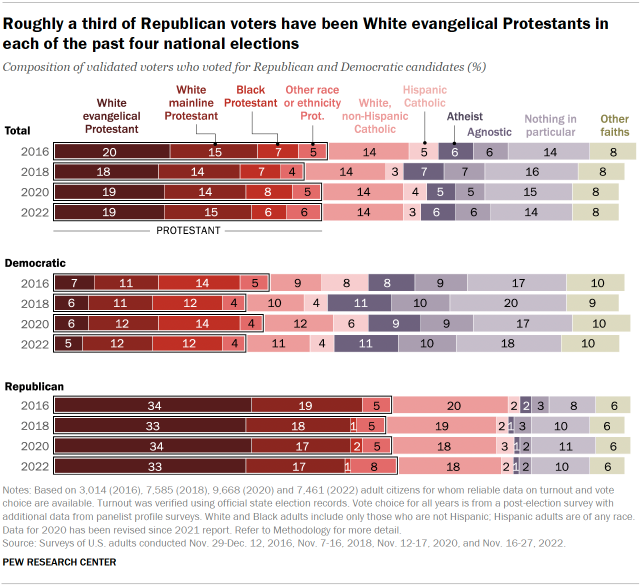
Religious composition of 2022 voters
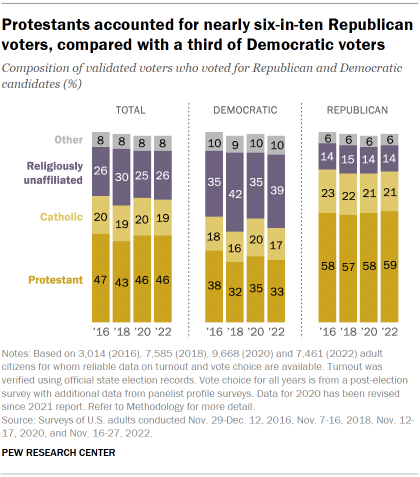
Protestants once again accounted for a majority of Republican voters (59%), with their share of the party’s voters essentially unchanged across the past four elections. Protestants constituted a third of Democratic voters in 2022; a larger share of Democratic voters (39%) described themselves as religiously unaffiliated (including atheists, agnostics and those who describe themselves as “nothing in particular”).
White evangelical Protestant voters made up about a third of the Republican voting coalition in 2022, while accounting for just 5% of Democratic voters. And while Black Protestants continue to represent a more substantial share of Democratic voters than Republican voters (12% vs. 1%), the share of Republican voters who are Protestant and have a racial or ethnic background other than Black or White grew slightly in 2022 (to 8%, up from 5% in the previous three election cycles).