
American Trends Panel: Pew Research Center’s online probability survey panel, which consists of more than 12,000 adults who take two to three surveys each month. Some panelists have been participating in surveys since 2014.
Defectors/Defection: People who either switch their vote to a different party’s candidate from one election to the next, or those who in a given election do not support the candidate of the party they usually support. Also referred to as “vote switching.”
Drop off/Drop-off voters: People who vote in a given election but not in a subsequent election. The term commonly refers to people who vote in a presidential election but not in the next midterm. It can also apply to any set of elections.
Midterm elections: General elections held in all states and the District of Columbia in the even-numbered years between presidential elections. All U.S. House seats are up for election every two years, as are a third of U.S. Senate seats (senators serve six-year terms).
Mobilize: Efforts by candidates, political campaigns and other organizations to encourage or facilitate eligible citizens to turn out to vote.
Nonvoter: Citizens who didn’t have a record of voting in any voter file or told us they didn’t vote.
Panel survey: A type of survey that relies on a group of people who have agreed to participate in multiple surveys over a time period. Panel surveys make it possible to observe how individuals change over time because the answers they give to questions in a current survey can be compared with their answers from a previous survey.
Party affiliation/Party identification: Psychological attachment to a particular political party, either thinking of oneself as a member of the party or expressing greater closeness to one party than another. Our study categorizes adults as Democrats or Republicans using their self-reported party identification in a survey.
Split-ticket voting/Straight-ticket voting: Voters typically cast ballots for more than one office in a general election. People who vote only for candidates of the same party are “straight-ticket” voters, while those who vote for candidates of different parties are “split-ticket” voters.
Turnout: Refers to “turning out” to vote, or simply “voting.” Also used to refer to the share of eligible adults who voted in a given election (e.g., “The turnout in 2020 among the voting eligible population in the U.S. was 67%”).
Validated voters/Verified voter: Citizens who told us in a post-election survey that they voted in the 2022 general elections and have a record for voting in a commercial voter file. (The two terms are interchangeable).
Voter file: A list of adults that includes information such as whether a person is registered to vote, which elections they have voted in, whether they voted in person or by mail, and additional data. Voter files do not say who a voter cast a ballot for. Federal law requires states to maintain electronic voter files, and businesses assemble these files to create a nationwide list of adults along with their voter information.
The elections of 2018, 2020 and 2022 were three of the highest-turnout U.S. elections of their respective types in decades. About two-thirds (66%) of the voting-eligible population turned out for the 2020 presidential election – the highest rate for any national election since 1900. The 2018 election (49% turnout) had the highest rate for a midterm since 1914. Even the 2022 election’s turnout, with a slightly lower rate of 46%, exceeded that of all midterm elections since 1970.
While sizable shares of the public vote either consistently or not at all, many people vote intermittently. Given how closely divided the U.S. is politically, these intermittent voters often determine the outcome of elections and how the balance of support for the two major political parties swings between elections.
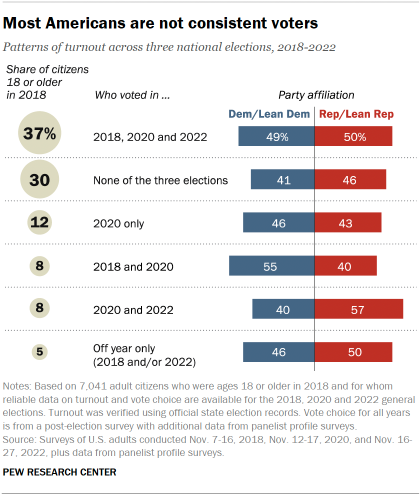
Overall, 70% of U.S. adult citizens who were eligible to participate in all three elections between 2018 and 2022 voted in at least one of them, with about half that share (37%) voting in all three.
Adults who voted in at least one election during the period divide evenly between Democrats and independents who lean toward the Democratic Party or Republicans and Republican-leaning independents in their current party affiliation (48% each). The subset who voted in all three elections are similarly divided (49% Democrats, 50% Republicans). Citizens who did not vote in any of the three tilt Republican by 46% to 41%.
Democrats outnumbered Republicans among the 8% of adult citizens who voted in 2018 and 2020 but not 2022 (55% Democratic, 40% Republican). A similar-sized group (8%) voted in 2020 and 2022 but not 2018, and this group’s composition tilts Republican (57%, vs. 40% Democratic). The 12% who voted in 2020 and opted out of both the 2018 and 2022 midterms were roughly evenly divided among Democrats (46%) and Republicans (43%).
Given the sizable number of intermittent voters and chronic nonvoters, as well as the fact that this group, collectively, is fairly evenly divided in partisan affiliation, both parties have plenty of potential supporters on the sidelines in any given election.
Political preferences differ a lot by race and ethnicity … and so does voter turnout
Race and ethnicity are fundamental dividing lines in American politics, with political preferences and electoral participation varying greatly by race and ethnicity.
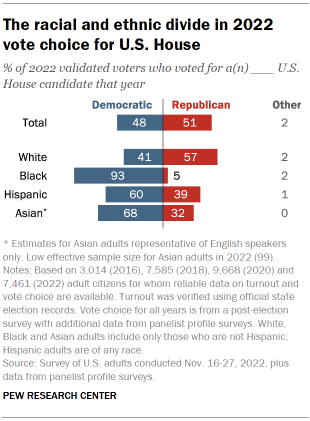
In the current partisan alignment, Black, Hispanic and Asian voters are all majority Democratic groups, to different degrees, though Republican candidates have gained some ground in the past four years among Hispanic voters.
Black voters remain Democratic stalwarts, voting 93% to 5% for the party’s candidates for U.S. House in 2022. Hispanic and Asian voters clearly favored Democratic candidates as well, but by narrower margins: 60% to 39% for Hispanic voters, and 68% to 32% for Asian voters.

But White Americans are much more consistent voters than Black, Hispanic or Asian Americans. Compared with the national average of 37% who voted in 2018, 2020 and 2022, 43% of White citizens who were age eligible to vote in all three elections did so; just 24% did not vote in any of these.
Black, Hispanic and Asian adults lagged far behind, with 27% of Black, 19% of Hispanic and 21% of Asian age-eligible citizens voting in all three elections. Hispanic citizens were most likely to have not voted in any of the most recent three general elections (47%, compared with 36% for Black and 31% for Asian citizens ages 22 and older in 2022).
Differences by education
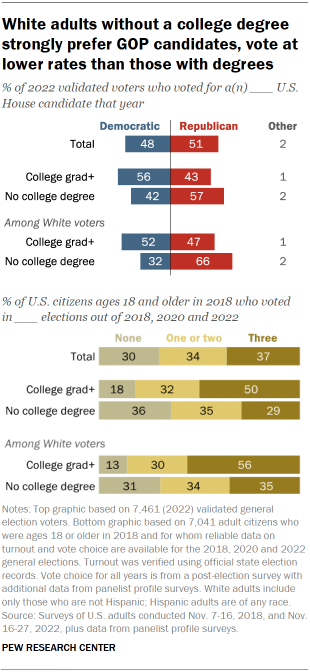
Over the past few election cycles, Republicans have gained ground among White adults who do not have a college degree, who make up 41% of eligible voters. This group is about average in its consistency of voter turnout, with 35% of those ages 22 and over in 2022 voting in 2018, 2020 and 2022, and 31% voting in none of these three elections. White voters without a college degree favored Republican House candidates 66% to 32% in 2022.
By contrast, White adults with college degrees vote at very high rates: 56% of those eligible turned out in all three elections and just 13% participated in none of them. College-educated White adults make up 24% of the eligible electorate but about a third of voters in 2022 (34%). White voters with college degrees had tilted Republican for several decades, but in the past four elections have favored Democratic candidates (52% to 47% in 2022).
The education gap in White voters’ preferences in 2022 was not apparent among either Black or Hispanic voters (the sample size of Asian voters without a college degree was too small to produce a reliable estimate). College-educated Black and Hispanic adults also voted at higher rates than Black and Hispanic adults without a college degree in each of the three elections.
A small education gap appeared in 2020 presidential preference among Hispanic voters: College-educated Hispanic voters preferred Biden by a margin of 69% to 29%, while Hispanic voters without a college degree preferred Biden by a somewhat narrower margin (58% to 39%). But no significant education gap in candidate preference was observed for Black or Hispanic voters in 2018 or 2022, nor for Black voters in 2020.
The upshot of racial differences in candidate preference and turnout patterns is that Republican candidates benefited from both the relatively large size of the White adult population without a college degree and their somewhat higher turnout rates compared with Black, Hispanic and Asian adults.
Growth in support for Democratic candidates among White voters with a college degree, along with the high turnout levels among this group, offset some of the growth in support for the Republican Party among White voters without a college degree. But college-educated White adults remain a smaller share of all eligible voters than White adults without a college degree.
Voters and nonvoters
The two most recent midterms – 2022 and 2018 – both featured unusually high turnout compared with nearly every other recent midterm election year. But the differences between those who turned out to vote in 2022 versus 2018 – and between those who did not vote – accounted for much of the difference in outcomes between the two elections.
The stark demographic differences between voters and nonvoters in 2022 are similar to those seen in previous U.S. elections.
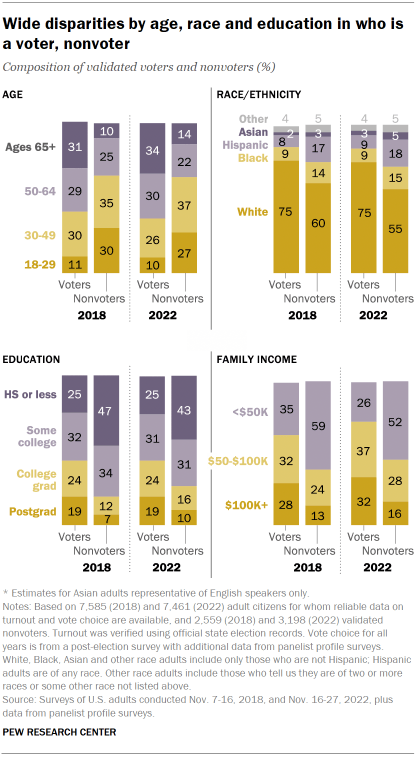
Voters were much older, on average, than nonvoters. Adults under 50 made up 36% of voters, but 64% of nonvoters. This is very similar to the pattern seen in 2018 – although those under 50 made up a somewhat larger share of voters in 2018 (40%).
Turnout also differed by race and ethnicity.
Three-quarters of voters (75%) were White, non-Hispanic adults. But this group accounted for a smaller share (55%) of nonvoters. Hispanic adults and Black, non-Hispanic adults each made up 9% of voters, but slightly larger shares of nonvoters (18% and 15%, respectively). Asian Americans made up 3% of voters, and a slightly higher share (5%) of nonvoters. These differences are nearly identical to the patterns seen in 2018.
There are also large educational and income differences between voters and nonvoters. Adults with a college degree made up 43% of voters in 2022, but only 25% of nonvoters. Those without a college degree made up 56% of voters, but 74% of nonvoters.
Voting methods in the 2022 election
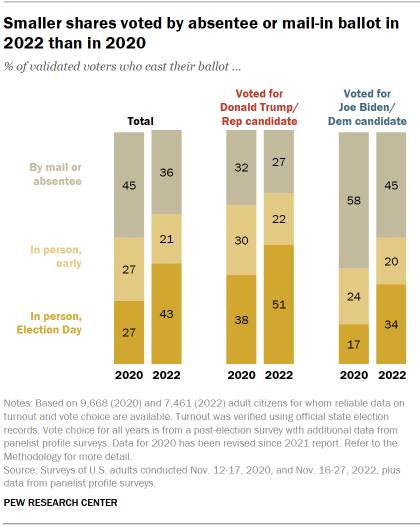
As concerns over the COVID-19 pandemic declined, fewer voters reported having voted absentee or by mail in 2022 than in 2020.
In 2022, 43% of voters said they cast their ballot in person on Election Day. A somewhat smaller share (36%) said they cast an absentee or mail-in ballot, and 21% said they voted in person before Election Day.
In the 2020 election, held during the first year of the coronavirus pandemic, 45% of voters said they cast their ballots by absentee or mail-in ballot, while identical shares (27%) said they voted in person either on Election Day or beforehand.
As was the case in 2020, voters who supported Republican candidates were more likely to report having voted in person on Election Day than by other methods. About half (51%) of those who supported Republicans said they voted this way, while smaller shares said they voted by mail or absentee ballot (27%) or voted in person before Election Day (22%). In 2020, 38% said they voted in person on Election Day, while somewhat smaller shares said they voted by mail or absentee (32%) or voted in person before Election Day (30%).
Voters who supported Democratic candidates were more likely to say they cast absentee or mail-in ballots (45%). About one-third (34%) said they voted in person on Election Day and two-in-ten said they voted in person before Election Day. In 2020, a 58% majority said they voted by mail or absentee ballot, while just 17% said they voted in person on Election Day.
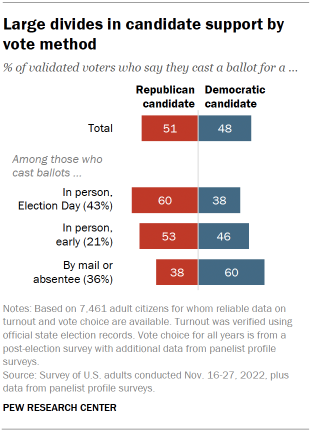
Reflecting these patterns, Republicans won a majority of votes among those who said they voted in person on Election Day, 60% to 38%. Democrats won – by an identical margin – voters who said they voted by mail or absentee ballot. Those who said they voted in person before Election Day were divided: 53% supported Republican candidates, while 46% voted for Democratic candidates.


