American Trends Panel: Pew Research Center’s online probability survey panel, which consists of more than 12,000 adults who take two to three surveys each month. Some panelists have been participating in surveys since 2014.
Defectors/Defection: People who either switch their vote to a different party’s candidate from one election to the next, or those who in a given election do not support the candidate of the party they usually support. Also referred to as “vote switching.”
Drop off/Drop-off voters: People who vote in a given election but not in a subsequent election. The term commonly refers to people who vote in a presidential election but not in the next midterm. It can also apply to any set of elections.
Midterm elections: General elections held in all states and the District of Columbia in the even-numbered years between presidential elections. All U.S. House seats are up for election every two years, as are a third of U.S. Senate seats (senators serve six-year terms).
Mobilize: Efforts by candidates, political campaigns and other organizations to encourage or facilitate eligible citizens to turn out to vote.
Nonvoter: Citizens who didn’t have a record of voting in any voter file or told us they didn’t vote.
Panel survey: A type of survey that relies on a group of people who have agreed to participate in multiple surveys over a time period. Panel surveys make it possible to observe how individuals change over time because the answers they give to questions in a current survey can be compared with their answers from a previous survey.
Party affiliation/Party identification: Psychological attachment to a particular political party, either thinking of oneself as a member of the party or expressing greater closeness to one party than another. Our study categorizes adults as Democrats or Republicans using their self-reported party identification in a survey.
Split-ticket voting/Straight-ticket voting: Voters typically cast ballots for more than one office in a general election. People who vote only for candidates of the same party are “straight-ticket” voters, while those who vote for candidates of different parties are “split-ticket” voters.
Turnout: Refers to “turning out” to vote, or simply “voting.” Also used to refer to the share of eligible adults who voted in a given election (e.g., “The turnout in 2020 among the voting eligible population in the U.S. was 67%”).
Validated voters/Verified voter: Citizens who told us in a post-election survey that they voted in the 2022 general elections and have a record for voting in a commercial voter file. (The two terms are interchangeable).
Voter file: A list of adults that includes information such as whether a person is registered to vote, which elections they have voted in, whether they voted in person or by mail, and additional data. Voter files do not say who a voter cast a ballot for. Federal law requires states to maintain electronic voter files, and businesses assemble these files to create a nationwide list of adults along with their voter information.
In the 2022 midterm elections, there were familiar patterns in voting preferences among subgroups. Younger voters, Black voters and those living in urban areas continued to support Democratic candidates while older, White and rural voters backed Republicans.
But the GOP improved its performance in 2022 across most voting subgroups relative to 2018 – due almost entirely to differential partisan turnout. Voters who were more favorable to Republican candidates turned out at higher rates compared with those who typically support Democrats. Shifting preferences among individual voters – though likely consequential in some races – was a much smaller factor in the 2022 midterms compared with turnout.
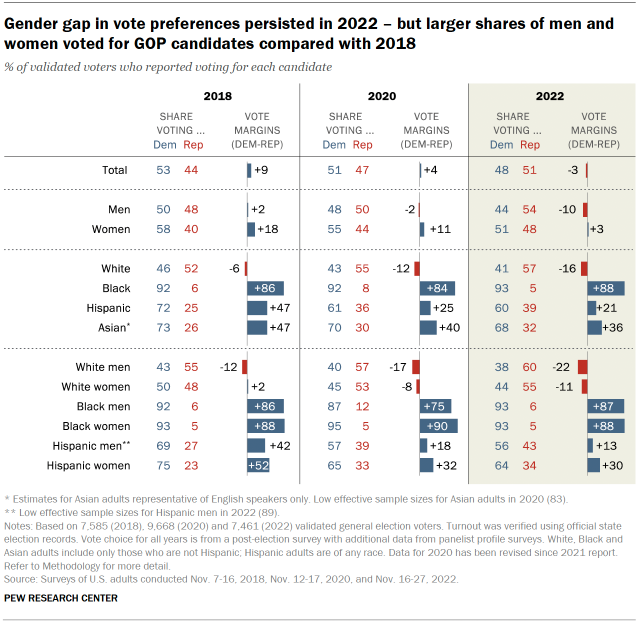
Gender, race and the 2022 vote
Overall, the gender gap in 2022 vote preferences was roughly similar to the gaps in 2020 and 2018. And even as men continued to be more likely than women to favor GOP candidates, Republicans improved their performance among both groups compared with 2018.
In 2018, men were roughly evenly divided between Democratic and Republican candidates. In the 2022 midterms, 54% of men cast ballots for GOP candidates, while 44% preferred Democrats. Republicans also gained support from a higher share of women compared with previous elections: 48% of women voters cast ballots for GOP candidates in 2022 while 51% favored Democrats. In 2018, 40% voted for Republicans while 58% supported Democrats. These shifts in margins largely reflect differential turnout, rather than shifting preferences.
As in previous elections, White voters continued to favor GOP candidates. In the 2022 midterms, 57% of White voters cast ballots for GOP candidates compared with 41% who supported Democrats. This 16 percentage point difference is about as wide as it was in 2020 (12 points) and wider than in 2018 (6 points). These changes also are largely attributable to turnout differences.
The gender gap among White voters in 2022 was similar to the gap in 2018. Republicans fared better among both White men and White women in 2022 compared with four years prior.
Black voters continued to support Democrats by overwhelming margins: 93% voted for Democrats in the midterms while 5% supported Republicans. This is similar to levels of support in 2020, 2018 and 2016. As in previous elections, in 2022, Black men and Black women supported Democrats at comparable levels.
While Hispanic voters continued to favor Democrats over Republicans, a higher share of Hispanic voters supported GOP candidates in the 2022 election compared with in 2018. In November, 60% of Hispanic voters cast ballots for Democrats compared with 39% who supported Republicans. This 21-point margin is smaller than in 2018, when 72% of Hispanic voters favored Democrats and 25% supported Republicans.
Among Hispanic voters who cast ballots in the 2018 election, 37% did not vote in the 2022 midterms. Those who did not vote had tilted heavily Democratic in 2018 – reflecting asymmetric changes in voter turnout among Hispanic adults.
Asian voters – who have favored Democratic candidates over Republicans in the last several elections – continued to do so in 2022. In November, 68% voted for Democrats while 32% voted for Republicans. In 2018, similar shares cast ballots for each party’s candidates (73% for Democrats vs. 26% for Republicans).
Education and voting preferences
In 2022, voters with a college degree or more education favored Democratic candidates while those with no college degree preferred Republicans – continuing a long-standing trend in polarization among American voters by education.
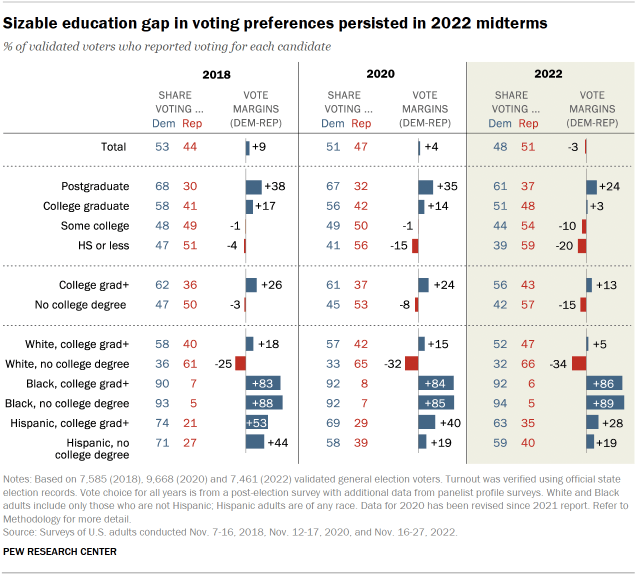
In November, voters with a college degree or more formal education cast ballots for Democratic candidates by a double-digit margin (56% voted for Democrats, 43% supported Republicans). And among voters with no college degree, preferences were nearly the reverse (57% supported GOP candidates vs. 42% for Democratic candidates). But compared with their performance in 2020, 2018 and 2016, Democrats performed worse in 2022 among those with a college degree. At the same time, a higher share of voters without college degrees also supported GOP candidates in 2022.
Much of the lagging Democratic performance compared with previous elections is attributable to differential partisan turnout rather than changing candidate preferences among voters.
For example, among the 18% of college-educated 2018 voters who did not turn out to vote in 2022, 62% supported a Democratic candidate for House four years ago while 34% supported a Republican candidate. Among 2018 voters with no college degree, 25% did not turn out in 2022. Among those in this group, 64% had supported Democrats, while 32% had backed Republicans in 2018.
Among White voters with no college degree, Republicans benefited from slightly higher rates of defection from Democratic candidates among those who voted in both elections. The GOP also made gains due to a larger share of those who sat out in 2018 election turning out to vote for Republican candidates in 2022.
In contrast, the GOP’s better performance among White, college-educated adults compared with four years prior was nearly all attributable to differential turnout, rather than to defections.
Though Hispanic voters with and without a college degree broke for Democrats over Republican candidates, Democratic performance among both groups was not as strong as it was in 2018.
Among Hispanic voters with a college degree, 35% cast a ballot for a GOP candidate in the House; this compares with 21% who did so in 2018.
Hispanic voters without college degrees also supported GOP candidates by a wider margin in 2022 compared with 2018: 40% reported voting for Republican candidates in 2022, compared with 27% in 2018.
Among both sets of voters, a higher share of those who voted for Democratic candidates in 2018 did not turn out in 2022 compared with those who supported Republicans in 2018.
Age and the 2022 election
Age continues to be strongly associated with voting preferences in U.S. elections. Nearly seven-in-ten voters under 30 (68%) supported Democratic candidates in 2022 – much higher than the shares of voters ages 30 to 49 (52%), 50 to 64 (44%) and 65 and older (42%) who did so. Compared with 2018, GOP candidates performed better among voters who turned out across age groups.
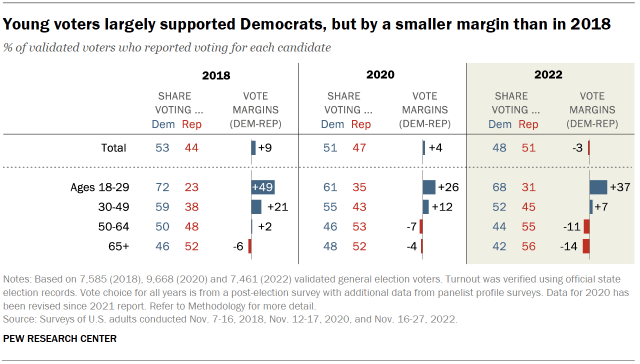
In 2022, younger voters made up a smaller share of the electorate than they did in 2018. In 2022, 36% of voters were under 50, compared with 40% of voters in 2018. Decreased turnout among these more reliably Democratic voters contributed to the GOP’s better performance in November.
Older voters turned out more reliably in both elections – and continued to be largely loyal to Republican candidates. For example, among adults ages 69 and older in 2022 (i.e., those who were 65 or older in 2018), 35% reported voting for Republicans in both 2018 and 2022. This compares with 28% who voted for Democrats in both elections. Another 18% of this group did not vote in either election.
Party, ideology and the 2022 election
Republican and Democratic candidates achieved similar levels of party loyalty in the 2022 midterms, with 96% of Democrats and Democratic-leaning voters supporting a Democratic candidate in November and 94% of Republicans and Republican-leaning voters supporting Republicans.
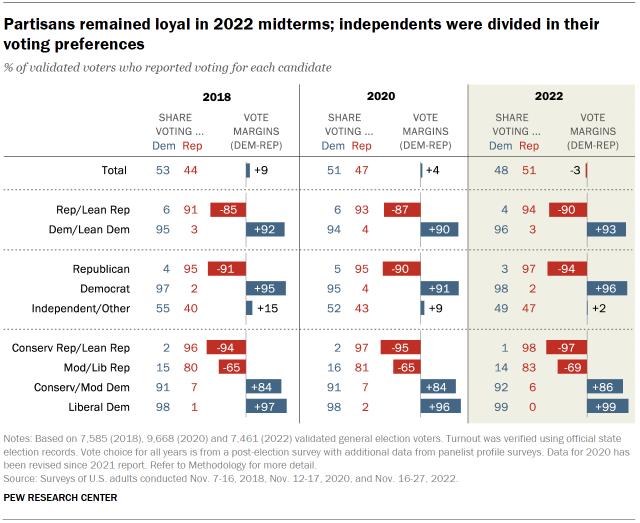
Voters who do not identify with either party were divided in their preferences: 49% reported voting for a Democratic candidate in the 2022 midterms, while 47% supported Republicans. In 2018, voters in this group were more likely to favor Democratic candidates (55%) than Republicans (40%).
There was a strong relationship between political ideology and voting preferences: Overwhelming shares of conservative Republicans (98%) and liberal Democrats (99%) reported voting for their party’s candidate in 2022. Slightly smaller shares of conservative and moderate Democrats (92%) and moderate and liberal Republicans (83%) said they did so – a dynamic that is consistent with previous elections.
Urban, suburban, rural voting in 2022
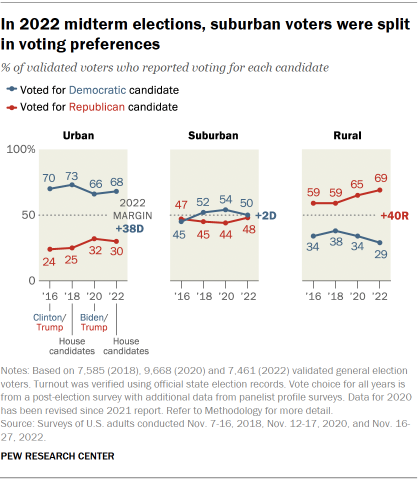
The urban-rural divide in voting preferences continues to be a major factor in American elections. Rural voters continue to be reliable GOP supporters, and urban voters continue to favor Democrats. In 2022, this split was as wide as it’s been in recent elections: 69% of rural voters cast ballots for Republicans, with just 29% supporting Democrats. The reverse pattern appears among urban voters: 68% supported Democrats, while 30% supported Republicans.
Among urban voters, lower turnout among voters who were favorable to Democrats in 2018 resulted in a slightly better performance for the GOP compared with four years prior: 31% of urban voters who cast ballots for Democrats in 2018 did not turn out in 2022, while 22% of urban voters who turned out for Republicans in 2018 sat out the 2022 midterms.
In rural areas, several factors boosted GOP candidates’ margins in 2022. Those who sat out in 2018 but voted in 2022 (9% of rural citizens overall) broke for Republican candidates: 77% supported Republican candidates in 2022 compared with 22% who supported Democrats.
Additionally, while few rural voters switched allegiances between the two elections, this was more prevalent among those who supported Democrats in 2018 (5% of whom switched their support to a GOP candidate in 2022) than among those who had supported Republicans four years earlier (just 1% of whom voted for Democrats in 2022). Rural voters who supported Democrats in 2018 stayed home at higher rates in 2022 compared with those cast ballots for GOP candidates (29% vs. 14%).
Suburban voters who turned out in 2022 were divided: 50% supported Democratic candidates for the House in November while 48% supported Republicans. In 2018, 52% of suburban voters favored Democrats, while 45% broke for Republicans. Both parties managed to hold on to suburban voters who had voted in 2018: 5% of those who supported a Democrat in 2018 switched to back a GOP candidate in 2022, while 4% of those who supported a Republican in 2018 switched to a Democratic candidate four years later.
However, suburban 2018 Democratic voters were somewhat less likely to turn out in 2022 (22% stayed home) than 2018 suburban GOP voters (16% stayed home).
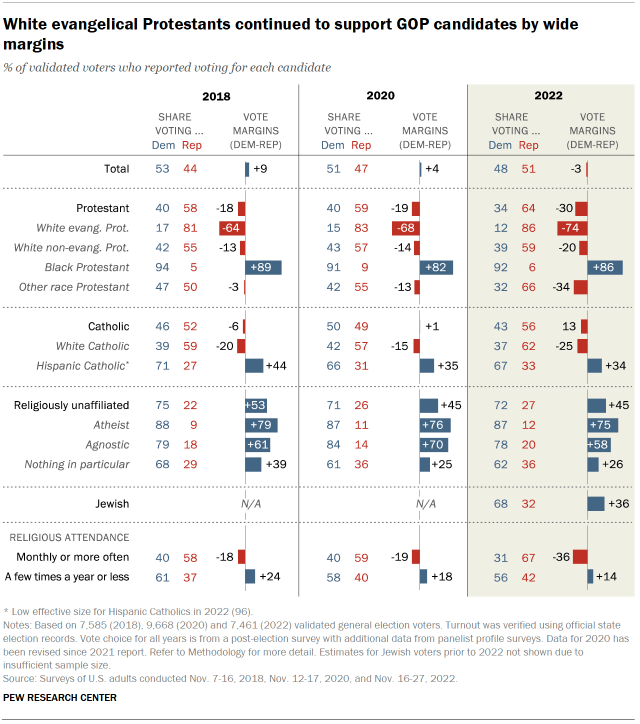
Religion and the 2022 election
Voters in 2022 sorted along religious lines in familiar ways compared with previous elections. Protestant voters continued to prefer the GOP by nearly two-to-one: 64% supported Republican candidates in November compared with 34% who supported Democrats. Among Protestants overall, GOP candidates improved their performance compared with 2018 by mobilizing some who did not turn out in 2018.
White evangelical Protestant voters – long a reliably Republican segment of the electorate – overwhelmingly supported GOP candidates over Democrats in the 2022 midterms (86% vs. 12%).
Among Catholic voters, White Catholics favored Republican candidates by 25 points, whereas Hispanic Catholics favored Democratic candidates by an even greater margin (34 points).
Jewish voters preferred Democratic candidates by a more than two-to-one margin in the 2022 midterms (68% to 32%).
Voters who do not affiliate with any religion (that is, those who describe themselves religiously as atheists, agnostics, or “nothing in particular”) continued to back Democratic candidates by significant margins. In November, 72% of this group reported voting for a Democratic candidate in the midterms, while 27% supported Republicans. In 2018, 75% voted for Democrats while 22% cast ballots for Republicans.
The gap in voting preferences by religious attendance was as wide as it’s been in any of the last several elections: 56% of those who said they attend religious services a few times a year or less reported voting for Democratic candidates in the 2022 midterms; 42% supported Republican candidates.
But GOP candidates were the favorite among those who attend services monthly or more by more than two-to-one (67%, vs. 31% who voted for Democratic candidates).