
Pew Research Center conducted this analysis to explore partisan identification among U.S. registered voters across major demographic groups and how voters’ partisan affiliation has shifted over time. It also explores the changing composition of voters overall and the partisan coalitions.
For this analysis, we used annual totals of data from Pew Research Center telephone surveys (1994-2018) and online surveys (2019-2023) among registered voters. All telephone survey data was adjusted to account for differences in how people respond to surveys on the telephone compared with online surveys (refer to Appendix A for details).
All online survey data is from the Center’s nationally representative American Trends Panel. The surveys were conducted in both English and Spanish. Each survey is weighted to be representative of the U.S. adult population by gender, age, education, race and ethnicity and other categories. Read more about the ATP’s methodology, as well as how Pew Research Center measures many of the demographic categories used in this report.
The contours of the 2024 political landscape are the result of long-standing patterns of partisanship, combined with the profound demographic changes that have reshaped the United States over the past three decades.
Many of the factors long associated with voters’ partisanship remain firmly in place. For decades, gender, race and ethnicity, and religious affiliation have been important dividing lines in politics. This continues to be the case today.
Yet there also have been profound changes – in some cases as a result of demographic change, in others because of dramatic shifts in the partisan allegiances of key groups.
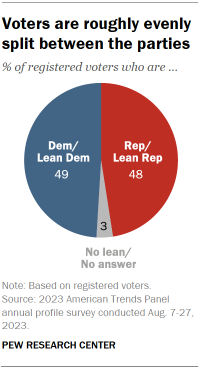
The combined effects of change and continuity have left the country’s two major parties at virtual parity: About half of registered voters (49%) identify as Democrats or lean toward the Democratic Party, while 48% identify as Republicans or lean Republican.
In recent decades, neither party has had a sizable advantage, but the Democratic Party has lost the edge it maintained from 2017 to 2021. (Explore this further in Chapter 1.)
Pew Research Center’s comprehensive analysis of party identification among registered voters – based on hundreds of thousands of interviews conducted over the past three decades – tracks the changes in the country and the parties since 1994. Among the major findings:
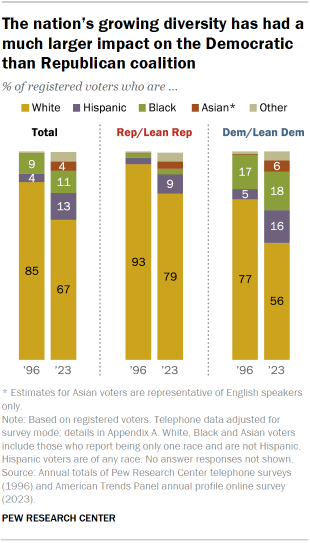
The partisan coalitions are increasingly different. Both parties are more racially and ethnically diverse than in the past. However, this has had a far greater impact on the composition of the Democratic Party than the Republican Party.
The share of voters who are Hispanic has roughly tripled since the mid-1990s; the share who are Asian has increased sixfold over the same period. Today, 44% of Democratic and Democratic-leaning voters are Hispanic, Black, Asian, another race or multiracial, compared with 20% of Republicans and Republican leaners. However, the Democratic Party’s advantages among Black and Hispanic voters, in particular, have narrowed somewhat in recent years. (Explore this further in Chapter 8.)
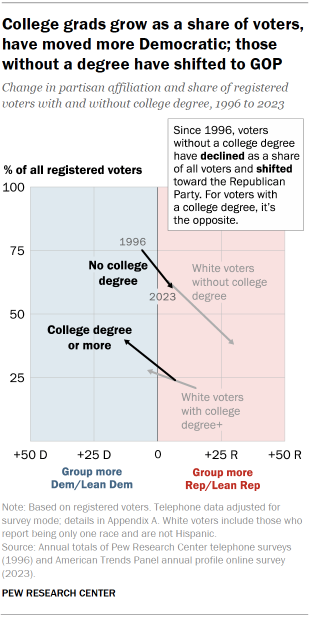
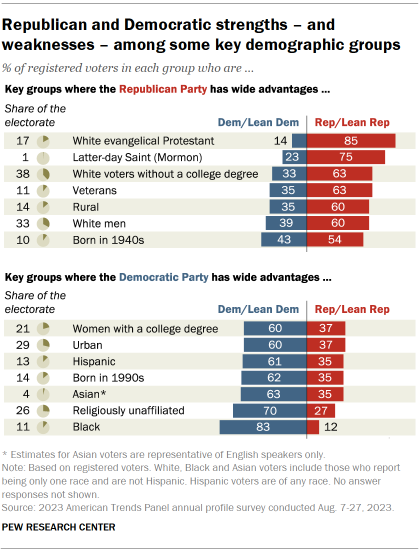
Education and partisanship: The share of voters with a four-year bachelor’s degree keeps increasing, reaching 40% in 2023. And the gap in partisanship between voters with and without a college degree continues to grow, especially among White voters. More than six-in-ten White voters who do not have a four-year degree (63%) associate with the Republican Party, which is up substantially over the past 15 years. White college graduates are closely divided; this was not the case in the 1990s and early 2000s, when they mostly aligned with the GOP. (Explore this further in Chapter 2.)
Beyond the gender gap: By a modest margin, women voters continue to align with the Democratic Party (by 51% to 44%), while nearly the reverse is true among men (52% align with the Republican Party, 46% with the Democratic Party). The gender gap is about as wide among married men and women. The gap is wider among men and women who have never married; while both groups are majority Democratic, 37% of never-married men identify as Republicans or lean toward the GOP, compared with 24% of never-married women. (Explore this further in Chapter 3.)
A divide between old and young: Today, each younger age cohort is somewhat more Democratic-oriented than the one before it. The youngest voters (those ages 18 to 24) align with the Democrats by nearly two-to-one (66% to 34% Republican or lean GOP); majorities of older voters (those in their mid-60s and older) identify as Republicans or lean Republican. While there have been wide age divides in American politics over the last two decades, this wasn’t always the case; in the 1990s there were only very modest age differences in partisanship. (Explore this further in Chapter 4.)
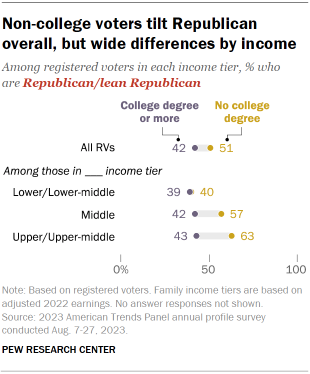
Education and family income: Voters without a college degree differ substantially by income in their party affiliation. Those with middle, upper-middle and upper family incomes tend to align with the GOP. A majority with lower and lower-middle incomes identify as Democrats or lean Democratic. There are no meaningful differences in partisanship among voters with at least a four-year bachelor’s degree; across income categories, majorities of college graduate voters align with the Democratic Party. (Explore this further in Chapter 6.)
Rural voters move toward the GOP, while the suburbs remain divided: In 2008, when Barack Obama sought his first term as president, voters in rural counties were evenly split in their partisan loyalties. Today, Republicans hold a 25 percentage point advantage among rural residents (60% to 35%). There has been less change among voters in urban counties, who are mostly Democratic by a nearly identical margin (60% to 37%). The suburbs – perennially a political battleground – remain about evenly divided. (Explore this further in Chapter 7.)
Growing differences among religious groups: Mirroring movement in the population overall, the share of voters who are religiously unaffiliated has grown dramatically over the past 15 years. These voters, who have long aligned with the Democratic Party, have become even more Democratic over time: Today 70% identify as Democrats or lean Democratic. In contrast, Republicans have made gains among several groups of religiously affiliated voters, particularly White Catholics and White evangelical Protestants. White evangelical Protestants now align with the Republican Party by about a 70-point margin (85% to 14%). (Explore this further in Chapter 5.)
What this report tells us – and what it doesn’t
In most cases, the partisan allegiances of voters do not change a great deal from year to year. Yet as this study shows, the long-term shifts in party identification are substantial and say a great deal about how the country – and its political parties – have changed since the 1990s.
The steadily growing alignment between demographics and partisanship reveals an important aspect of steadily growing partisan polarization. Republicans and Democrats do not just hold different beliefs and opinions about major issues, they are much more different racially, ethnically, geographically and in educational attainment than they used to be.
Yet over this period, there have been only modest shifts in overall partisan identification. Voters remain evenly divided, even as the two parties have grown further apart. The continuing close division in partisan identification among voters is consistent with the relatively narrow margins in the popular votes in most national elections over the past three decades.
Partisan identification provides a broad portrait of voters’ affinities and loyalties. But while it is indicative of voters’ preferences, it does not perfectly predict how people intend to vote in elections, or whether they will vote. In the coming months, Pew Research Center will release reports analyzing voters’ preferences in the presidential election, their engagement with the election and the factors behind candidate support.
Next year, we will release a detailed study of the 2024 election, based on validated voters from the Center’s American Trends Panel. It will examine the demographic composition and vote choices of the 2024 electorate and will provide comparisons to the 2020 and 2016 validated voter studies.
The partisan identification study is based on annual totals from surveys conducted on the Center’s American Trends Panel from 2019 to 2023 and telephone surveys conducted from 1994 to 2018. The survey data was adjusted to account for differences in how the surveys were conducted. For more information, refer to Appendix A.
Previous Pew Research Center analyses of voters’ party identification relied on telephone survey data. This report, for the first time, combines data collected in telephone surveys with data from online surveys conducted on the Center’s nationally representative American Trends Panel.
Directly comparing answers from online and telephone surveys is complex because there are differences in how questions are asked of respondents and in how respondents answer those questions. Together these differences are known as “mode effects.”
As a result of mode effects, it was necessary to adjust telephone trends for leaned party identification in order to allow for direct comparisons over time.
In this report, telephone survey data from 1994 to 2018 is adjusted to align it with online survey responses. In 2014, Pew Research Center randomly assigned respondents to answer a survey by telephone or online. The party identification data from this survey was used to calculate an adjustment for differences between survey mode, which is applied to all telephone survey data in this report.
Please refer to Appendix A for more details.


