
The partisan identification of registered voters is now evenly split between the two major parties: 49% of registered voters are Democrats or lean to the Democratic Party, and a nearly identical share – 48% – are Republicans or lean to the Republican Party.
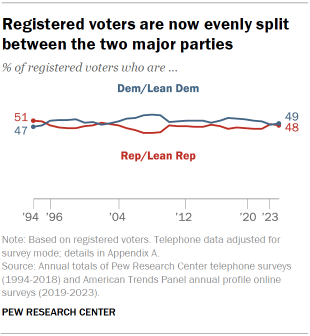
The partisan balance has tightened in recent years following a clear edge in Democratic Party affiliation during the last administration.
- Four years ago, in the run-up to the 2020 election, Democrats had a 5 percentage point advantage over the GOP (51% vs. 46%).
The share of voters who are in the Democratic coalition reached 55% in 2008. For much of the last three decades of Pew Research Center surveys, the partisan composition of registered voters has been more closely divided.
Partisans and partisan leaners in the U.S. electorate
About two-thirds of registered voters identify as a partisan, and they are roughly evenly split between those who say they are Republicans (32% of voters) and those who say they are Democrats (33%). Roughly a third instead say they are independents or something else (35%), with most of these voters leaning toward one of the parties. Partisan leaners often share the same political views and behaviors as those who directly identify with the party they favor.
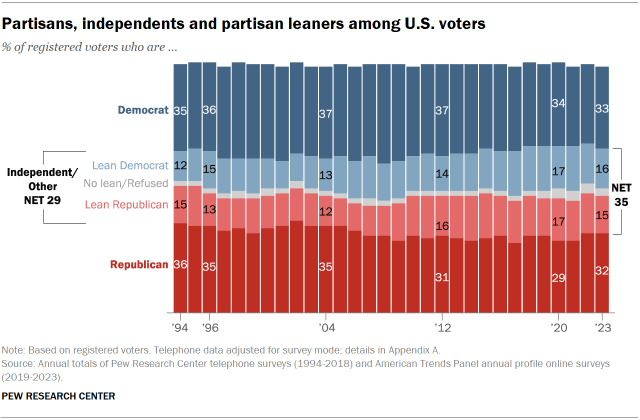
The share of voters who identify as independent or something else is somewhat higher than in the late 1990s and early 2000s. As a result, there are more “leaners” today than in the past. Currently, 15% of voters lean toward the Republican Party and 16% lean toward the Democratic Party. By comparison, in 1994, 27% of voters leaned toward either the GOP (15%) or the Democratic Party (12%).
Party identification and ideology
While the electorate overall is nearly equally divided between those who align with the Republican and Democratic parties, a greater share of registered voters say they are both ideologically conservative and associate with the Republican Party (33%) than say they are liberal and align with the Democratic Party (23%).
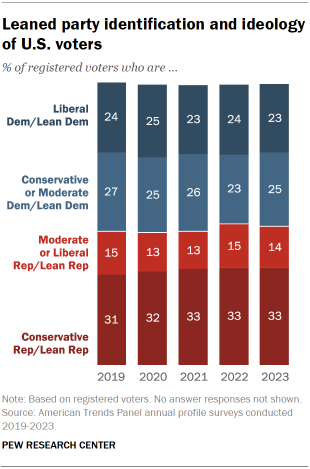
A quarter of voters associate with the Democratic Party and describe their views as either conservative or moderate, and 14% identify as moderates or liberals and are Republicans or Republican leaners.
The partisan and ideological composition of voters is relatively unchanged over the last five years.
(As a result of significant mode differences in measures of ideology between telephone and online surveys, there is not directly comparable data on ideology prior to 2019.)


