
Today, age is strongly associated with partisanship – and this pattern has been in place for more than a decade.
The Democratic Party holds a substantial edge among younger voters, while the Republican Party has the advantage among the oldest groups.
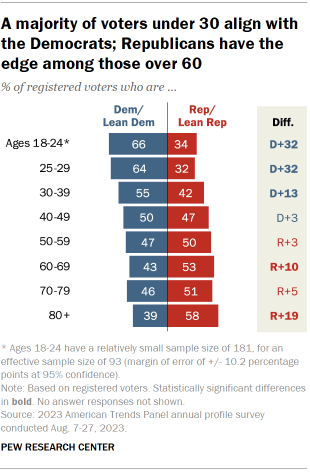
- About two-thirds of voters ages 18 to 24 (66%) associate with the Democratic Party, compared with 34% who align with the GOP.
- There is a similarly large gap in the partisan affiliation of voters ages 25 to 29 (64% are Democrats or lean that way vs. 32% for Republicans).
- Voters in their 30s also tilt Democratic, though to a lesser extent: 55% are Democrats or Democratic leaners, 42% are Republicans or Republican leaners.
Neither party has a significant edge over the other among voters in their 40s and 50s:
- Half of voters in their 40s associate with the Democratic Party, and 47% are affiliated with the Republican Party.
- The shares are reversed among voters in their 50s: 50% align with the Republicans, 47% with the Democrats.
Among voters ages 60 and older, the GOP holds a clear advantage:
- Republican alignment is 10 percentage points higher than Democratic alignment (53% vs. 43%) among voters in their 60s.
- Voters ages 70 to 79 are slightly more likely to be aligned with the GOP (51%) than the Democratic Party (46%).
- About six-in-ten voters 80 and older (58%) identify with or lean toward the GOP, while 39% associate with the Democratic Party.
Older voters overwhelmingly identify with a party; among younger voters, substantial numbers lean
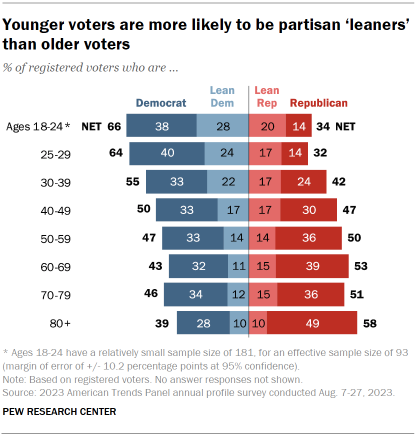
In addition to the differences in the overall partisan tilt of younger and older voters, younger voters are considerably more likely than older voters to opt out of identifying directly with a party.
For instance, among voters 80 and older, 77% identify with a party (49% as Republicans, 28% as Democrats). About two-in-ten instead say they are “something else” or independent, with most of them leaning to one of the parties.
By comparison, only about half (52%) of voters under 25 identify directly with a party (38% Democrat, 14% Republican). About half instead say they are something else or independent, with 28% leaning Democratic and 20% leaning Republican.
Partisanship among men and women within age groups
The age differences in partisanship seen in the public overall are evident among both men and women.
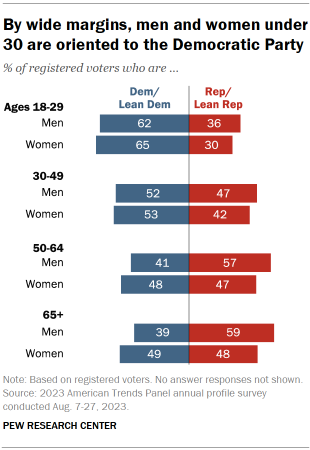
For instance, both men and women under 30 align with Democrats by about a two-to-one margin.
Men and women voters ages 30 to 49 are fairly divided in their partisan allegiances, though the Democratic Party holds a modest edge among women in this age group.
Republicans have a substantial advantage among men 50 and older, while women this age are about equally likely to affiliate with each of the two parties.
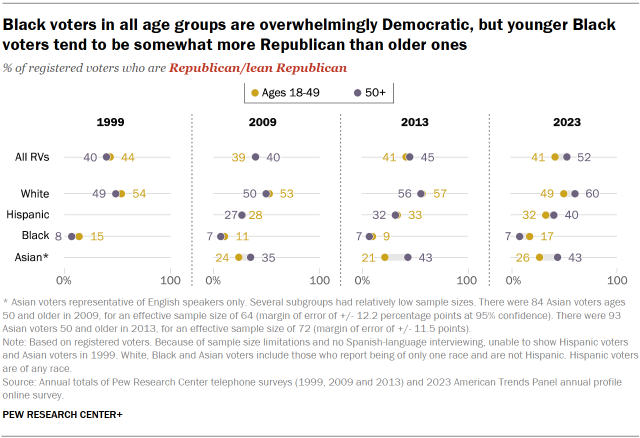
Race, age and partisanship
Among White, Hispanic and Asian voters, older adults today are generally more Republican (and less Democratic) than younger adults.
But this is not the case for Black voters: 17% of Black voters under 50 identify as or lean Republican, compared with just 7% of Black voters 50 and older.
- In surveys dating back to the 1990s, younger Black voters consistently have either been somewhat more Republican than older Black voters (as in 1999, when 15% of those under 50 were or leaned Republican vs. 8% of those 50 and older), or there has been no difference in Black partisanship by age.
The partisanship of generational cohorts
Looking at the partisanship of people born at roughly the same time (age cohorts) allows us to compare across generations over time. (For details on the age cohorts, visit Appendix C.)
Today, each younger age cohort is somewhat more Democratic-oriented than the one before it. But that has not always been the case. For instance, in the late 1990s, the balance of partisanship of voters across age groups (cohorts) varied only very modestly:
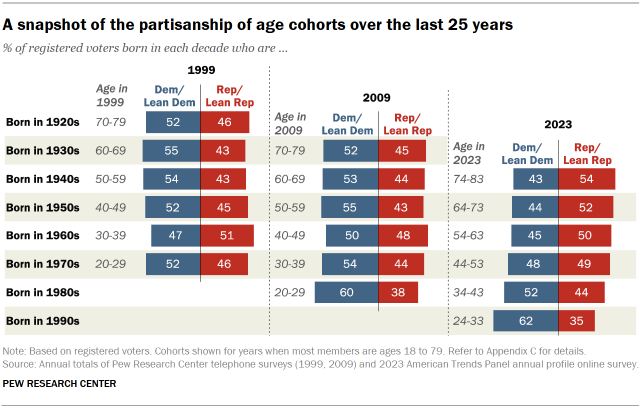
- In 1999, voters who were in their 70s at the time – those who were born in the 1920s and came of age during the presidency of Franklin Roosevelt – were 52% Democratic in their orientation, 46% Republican. The youngest age cohort at the time – voters in their 20s, born in the 1970s – had the exact same partisan makeup. Only one age cohort stood out as different – those born in the 1960s (then in their 30s) were more Republican, on balance, than other age groups.
- Ten years later, in 2009, the then-youngest age cohort (people born in the 1980s, then in their 20s) was clearly more Democratic-oriented than older groups, but there was little difference between the older cohorts (though those born in the 1960s remained slightly more Republican than both groups older and younger than them).
Now, and for the last several years, a starker – and more linear – age pattern is evident. Those born in the 1990s (now in their mid-20s to early 30s) are more Democratic than those born in the 1980s, who are in turn more Democratic than those born in the 1970s. And the oldest age cohorts are the most Republican-oriented.
Partisanship of age cohorts over time
Voters born in the 1940s (ages 74 to 83 in 2023) have had a Republican tilt for the last several years – but were evenly split in their partisanship a decade ago. The Democratic Party last had an edge among this group in the first year of the Obama administration.
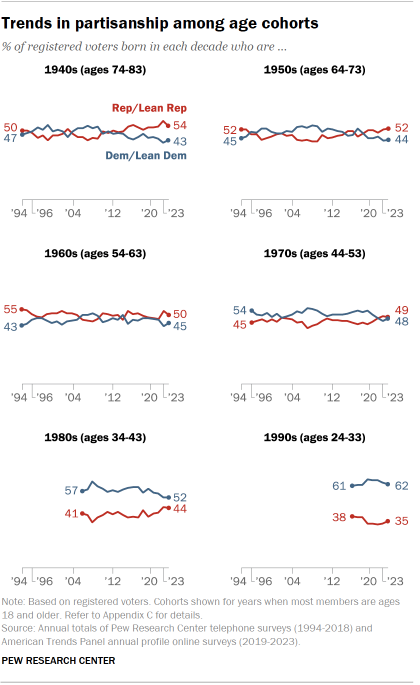
Voters born in the 1950s (ages 64 to 73 in 2023) are more likely to be Republicans or Republican leaners (52%) than Democrats or Democratic leaners (44%). The GOP has held an edge with this group for the last several years, following growth in GOP affiliation over the last 15 years.
Compared with those born the decade after them, voters born in the 1960s (ages 54 to 63 in 2023) have tended to be more closely aligned with the GOP throughout their adulthood. Currently, the GOP has a 5 percentage point edge over Democrats among these voters (50% to 45%).
Voters born in the 1970s (ages 44 to 53 in 2023) have historically been more likely to align with Democrats than Republicans. Democrats have had a 3-point or greater edge among these voters in 17 out of 23 years since 2000. However, today these voters are about equally split between associating with Republicans (49%) and Democrats (48%).
Voters born in the 1980s (ages 34 to 43 in 2023) favor the Democrats in their affiliation and have done so since they first reached adulthood. But the gap between the two parties has narrowed considerably among these voters in the last few years. Currently, 52% of voters born in the 1980s associate with the Democrats and 44% with Republicans.
Voters born in the 1990s (ages 24 to 33 in 2023) are more aligned with the Democratic Party than those in older age cohorts. About six-in-ten voters born in the 1990s (62%) currently associate with the Democrats, and a similar share were Democrats or Democratic leaners when they first entered the electorate almost a decade ago. (Note: Most of those born in the 2000s are not yet eligible to vote.)


