By Ruth Igielnik, Scott Keeter, Courtney Kennedy and Bradley Spahn
Since the rise of modern survey research, much of what is known about voter attitudes, behavior and the composition of the electorate has come from interviews with samples of voters, sometimes in combination with aggregate voting statistics. But relatively recent technological innovations and government policy changes have given political practitioners and researchers a new addition to their toolbox: national digital databases, or “voter files.” These files are built by commercial organizations using official, publicly available government records of who is registered to vote and who cast ballots in past elections.
As research and targeting using these voter files has become more widespread, voter file vendors are increasingly trying to provide coverage of all U.S. adults, including those who are not registered to vote. These commercially available files provide not only a nationwide picture of voter registration and turnout, but are usually supplemented with information from consumer data vendors, credit bureaus, political organizations and other sources and are marketed as providing a rich and comprehensive record for nearly every American adult.
Over the last decade, commercial voter files have become central to the conduct of contemporary election campaigns and are frequently employed by pollsters, journalists and political analysts trying to understand the American electorate. As part of a broader effort at Pew Research Center to shed light on this important but somewhat arcane resource, this report focuses on using the files to enhance our understanding of survey respondents. It also attempts to evaluate the quality of the data provided by the files.
In order to accomplish these goals, voter file data acquired from five commercial vendors were matched to participants in Pew Research Center’s American Trends Panel, a nationally representative sample of adults who have agreed to take surveys on a regular basis. This offers an opportunity to compare self-reported voter registration and turnout data provided by panelists – data that are subject to well-documented survey errors – to the high-quality official vote records included in the voter files. It also provides a chance to use data acquired from survey interviews with panelists to verify the accuracy of the ancillary information that commercial vendors attach to the voter files, including additional demographic, financial, lifestyle and political data.
The data sources
To describe and evaluate voter files, Pew Research Center attempted to link all of the nearly 5,000 members of the American Trends Panel (ATP), its nationally representative survey panel of U.S. adults, to five commercial voter files. Two of the files are from nonpartisan vendors, two are from vendors that work primarily with Democratic and politically progressive clients and one is from a vendor that works primarily with Republican and politically conservative clients. The vendors are anonymized and numbered from one to five in this report, ordered by the rate at which the voter file records were matched to members of the panel.
All vendors were provided with the same panelist information for searching, which included their name, address, gender, phone number, race and ethnicity, date of birth or age and email address. Vendors were then asked to find these individuals in their voter files using their normal matching methodology. The vendors then provided Center researchers with voter file data on voter registration and turnout, party affiliation and demographic characteristics for each panelist they were able to match. Vendors were obligated to maintain this information in strict confidence and to permanently delete all personally identifying information about panelists when the matching was completed. Overall, 91% of the 3,985 active members of the ATP who took part in a survey conducted Nov. 29 to Dec. 12, 2016 (and who provided a name) yielded a match by at least one of the vendors.1
Summary of findings
Commercial voter files are an amalgamation of administrative data from states about registration and voting, modeled data about partisanship, political engagement and political support provided by vendors; and demographic, financial and lifestyle data culled from a wide range of sources. Bringing together data from a number of different sources brings challenges, as each source comes with its own strengths and weaknesses. A principal goal of this study was to assess the accuracy and completeness of the information in the commercial voter files. For most of the analyses, information provided by respondents in the American Trends Panel is used to assess the quality of the information in the voter files. Here are some of the most important findings, followed by additional detail from the analysis:
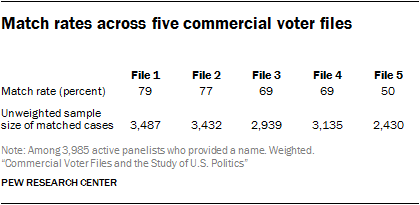
- Researchers were able to match a very high percentage of panelists from the nationally representative survey sample to at least one of the five commercial voter files, suggesting that the files collectively cover a large share of the U.S. population. Depending on the voter file vendor, the percentage of panelists matched varied from a low of 50% to a high of 79%, with an average match rate of 69%. Less than half (42%) of the panelists were located in all five files, but each of the vendors “found” panelists missed by other vendors. Differences among the vendors are largely a function of their tolerance for mismatches and, presumably, the success of their matching algorithms. Collectively, the vendors successfully matched 91% of panelists, meaning that more than nine-in-ten panelists could be found on at least one of the files and just 9% of panelists could not be found on any of the files. The relatively high level of coverage of the files is encouraging for researchers and campaigns that use them for targeting, messaging or research. Of course, most clients using these voter files will not have purchased all five of them, so match rates of 90% and higher may be difficult if not impossible to achieve with any single file.
-
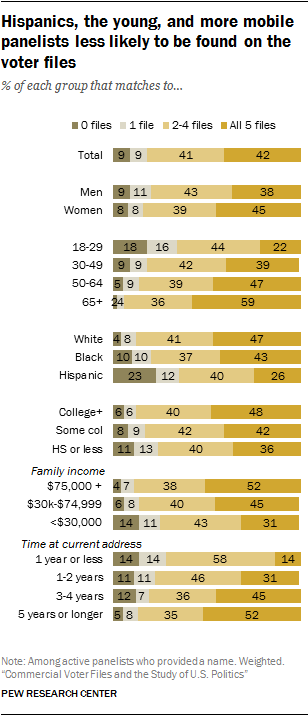
Still, commercial voter files may disproportionately miss segments of the public who are politically disengaged, younger, Hispanic and more mobile.
Specifically, the likelihood of finding an individual on a commercial voter file was strongly related to whether they were registered to vote. On average across the five vendors, 77% of people who said they were registered to vote were matched. Only 38% of the self-described unregistered voters were matched. Similarly, match rates varied greatly by panelists’ age, race and ethnicity. Only about one-in-five younger panelists (22% of those ages 18 to 29) were found in all five files, as compared to more than half (59%) of older panelists (ages 65 and older). Similarly, just 26% of Hispanics were found in all five files, compared with 47% of non-Hispanic whites. 2 Mobility is also a strong correlate. Only 14% of those who reported moving in the last year were found on all five files. Those who reported living at their residence for longer matched at a much higher rate. - As a result of the systematic demographic differences in the types of people who were difficult to locate in the files, this analysis finds that commercial voter files may have significant limitations for efforts to study the general public (as opposed to registered voters). In comparison with random-digit-dial telephone samples, voter files do not provide the same degree of coverage of the adult population overall, and the kinds of people missed by the files may be very different politically and demographically from those who can be found in the files and contacted by phone.
- The process of matching survey panelists to the voter files can be vexed by small differences in names and addresses, leading to ambiguity regarding the accuracy of some of the matches. In addition, difficulty with matching is related to lifestyle and demographic factors – such as frequently changing one’s residence – that are also correlated with political engagement and party preferences.
- Across the five vendors there were significant differences in matching styles and, as a result, match rates. Some vendors restricted their matching only to panelists for whom they had a very high degree of certainty about the accuracy of the matches, resulting in an older and more politically engaged set of matched panelists. Other vendors assessed the trade-off differently and matched a higher share of panelists, producing a more diverse matched group while accepting more uncertainty about the accuracy of their matches.
- The files generally agree with respect to voter turnout in the 2016 presidential election (at least among survey respondents who are matched in common), though one of the files appeared to miss a number of voters captured by the other four files. And there is no record of voting for nearly all survey respondents who said in a post-election survey that they did not vote in 2016.Among panelists who were matched by all the vendors in the study, 85% have identical turnout records across the five files: 75% are recorded as having voted in 2016 in all five files and 10% have no record of a vote in all five files. One file – File 3 – had records that conflicted with the other four files for many panelists, indicating that they may have missed the state voter records for many panelists.Another potential measure of data quality in measures of turnout is how closely the self-reported vote choice (e.g., Trump vs. Clinton) among those panelists flagged as having voted matched the actual election outcome. Reported presidential vote by panelists verified as having voted by at least one of the voter file vendors is very similar to the national vote share for each candidate (48% Clinton, 45% Trump among validated voters, compared with the official outcome of 48%-46%). Presidential vote among these validated voters was much closer to the outcome than the vote among all self-reported voters in the panel (49% Clinton, 43% Trump).
- Self-reported data on voter registration status is particularly problematic. Many panelists who expressed doubt about their registration in a survey, or who said they were definitely not registered, nevertheless had a registration record on at least one file. This may reflect the fact that voter registration is an administrative status that is somewhat abstract rather than a more easily remembered behavior like voting.
-
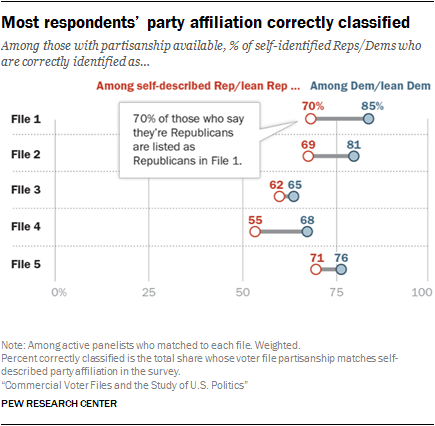
There was a relatively close correspondence between panelists’ self-reported party affiliation and the party identification predicted by voter file vendors.
Voter file data on party affiliation benefits from the fact that many states register voters by party, and while voters’ party registration might not always match their self-identification, it is a very good proxy. However, even in states without party registration (roughly half of U.S. adults live in such states), the voter file estimates of party affiliation tended to be reasonably accurate. On average across the five files, modeled party affiliation in the files matched self-reported party affiliation for about two-thirds of panelists (67%). In general, the files did a better job of identifying Democrats than Republicans. - Voter file turnout models did a good job of predicting who would vote in 2016. The analysis in this report, along with a previous Pew Research Center study, show that using these scores to create a likely electorate for the 2016 general election improves election estimates relative to relying on self-reported information alone.Prior to the 2016 general election, each vendor provided a measure of turnout likelihood in the election, and applying these measures improved the accuracy of the American Trends Panel’s estimate of voter preferences in the presidential race. The estimate narrowed Hillary Clinton’s advantage from 7 percentage points among all registered voters to a range of 3 to 5 points using the modeled turnout scores. She ended up with a 2-point advantage over Donald Trump on Election Day. Past voter history is a key component of these models, but the exact algorithms the vendors use are not public.
-
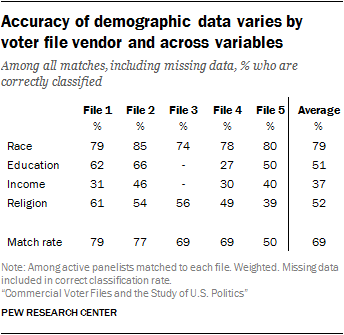
The voter file estimate of the race or ethnicity of panelists, when provided, also matched the survey data reasonably well.
The files are able to accurately categorize 79% of panelists (on average) by race and ethnicity, including an average of 93% for non-Hispanic whites, 72% for Hispanics and 67% for blacks. - Other demographic data in the voter files – like education and income data – tended to be suggestive at best and were often missing entirely. The vendors differed considerably in the accuracy of some of these kinds of variables. Education level was either missing or inaccurate an average of 48% of the time across the files. Similarly, household income was missing or inaccurate 63% of the time on average across the files. In general, these demographic variables simply provide a greater likelihood of identifying a group of interest, rather than any certitude of doing so.
Caveats about the analysis
Because much of the analysis presented here is based on a comparison using data from Pew Research Center’s American Trends Panel, it is important to note that no survey, including the American Trends Panel, perfectly represents the adult population of the U.S. While data in the panel are weighted to be nationally representative with respect to a wide range of characteristics (age, sex, race, Hispanic origin, education, region of residence, population density etc.), no survey is an exact model of the population in all respects. A second caveat is that while most of the demographic information and partisan affiliation provided by the panelists is likely to be correct, self-reports of voter registration – or voter turnout, in particular – may err because of the phenomenon known as social desirability bias. Some individuals may report being registered or having voted when they have not. In general, self-reported demographic and related personal information about panelists will be treated as true, while self-reports of political engagement –behaviors that are viewed as socially desirable and are often overreported – will need to be evaluated carefully in light of the information in the voter files.
History of voter files
Election administration in the U.S. has historically been highly decentralized, with states adopting a range of methods for managing the election process and keeping records of who is eligible to vote and who has voted. This patchwork made it very difficult, if not impossible, to assemble anything resembling a national database of voters. Even statewide databases were unavailable in some places.
The relatively recent availability of commercial voter files is a result of both technological progress and government policy changes that resulted from problems in recent U.S. elections. The 2000 presidential election raised concerns about the accuracy, consistency and quality of election administration systems. In its aftermath, Congress adopted the Help America Vote Act of 2002 (HAVA) to address some of these issues. Among the many provisions of HAVA was that states were directed to create “a single, uniform, official, centralized, interactive computerized statewide voter registration list defined, maintained, and administered at the State level that contains the name and registration information of every legally registered voter in the State …”3 These digital databases then made it possible for partisan and commercial organizations to collect and compile national files of voters by combining the digital files from each state and the District of Columbia.
In an age when personal information has been increasingly commoditized, the files then iterated a step further. Very comprehensive databases of nearly all adults in the U.S. are now maintained by credit bureaus and other businesses. Commercial voter files based on registered voters can be compared with the larger databases of all adults to identify individuals who are not registered to vote. Records for these individuals are then added to the commercial voter files and all of the records are populated with additional political and nonpolitical information.
The compilation process that companies use to create the national voter files is far easier now than it was before HAVA, but it is not without its challenges. Americans remain a fairly mobile population, meaning that credit, consumer and voter files must be continually updated. A registered voter who moves to another state must re-register, and there is no uniform method by which election officials across states are notified when a voter moves. While both election officials and the commercial voter file vendors attempt to keep track of individuals when they move using resources such as the National Change of Address database from the U.S. Postal Service, the process is hardly foolproof. Each commercial vendor uses different methods for updating its files and making judgments about which official record associated with an individual is the most current one. Still, even with their flaws, the commercial voter files constitute a considerable improvement over what was available to campaigns, parties and researchers prior to the passage of HAVA.