
In analyzing the data, researchers identified two issues that had the potential to affect the study’s conclusions. First, the survey was designed to be administered the same way for each of the six online sources. But after interviewing was completed, researchers discovered that there was a discrepancy with respect to whether respondents were allowed to skip questions. Respondents in the two address-recruited and the one crowdsourced sample were not required to answer each question, but those in the opt-in samples were. This presented a potential problem, as forcing respondents to answer each question could conceivably affect their behavior and, in particular, their likelihood of giving answers that flagged them as a bogus respondent. Researchers needed to know if the higher incidence of bogus respondents in the opt-in samples was attributable to this difference. To find the answer, it was necessary to field the survey again on the opt-in sources, this time without forcing respondents to answer each question.
The second issue concerned the approve-of-everything response pattern. As discussed in Chapter 2, a small share of respondents answered with “approve” or “favorable” each time such a question was asked. This behavior was concentrated in the opt-in samples. As this report explains, the most likely explanation is that opt-in polls are primarily used for market research, and so offering rote “approve” answers is logical on the assumption that such answers would please the sponsor. This is a key finding because it demonstrates that bogus respondents, rather than just adding noise, stand to bias certain estimates.
An alternative explanation for the approve-of-everything response style is what is known in polling as a primacy effect. A primacy effect is the tendency for some respondents to select answers shown at or near the top of the answer list. For example, in the question asking about the President’s job performance the first answer choice was “Strongly approve” and the last was “Strongly disapprove.” Conceivably, the approve-of-everything respondents could have simply been selecting answers near the top, which in this study happen to be positively-valanced. To test this, it was necessary to field the survey again, this time presenting the negative answer choices first. If the approve-of-everything behavior was observed, even when such answers were shown near the bottom, this would show that the behavior is purposeful and that rotating the answer choices does not help.
Researchers addressed both potential concerns by fielding a follow-up data collection. The survey was fielded again from Dec. 2 – 7, 2019 with 10,122 interviews from opt-in panel 1 and 10,165 interviews from opt-in panel 3. Respondents to the first survey were ineligible for the follow-up study. Opt-in panel 2 was not used because it was not needed to answer the two questions raised above. The rates of bogus responding and approve-of-everything response style were similar across the three opt-in sources. If we learned that permitting respondents to skip questions or rotating the approve/disapprove options increased data quality in panels 1 and 3, it would be very reasonable to assume that that would also hold for panel 2. All three opt-in panels generally performed about the same.
The important difference between the main study and the follow-up study was two-fold. First, respondents were allowed to skip questions. Second, a split-form experiment was administered. A random 50% of respondents received the same response ordering as the main study with positive (approve/favorable) answers shown first, and the other random 50% of respondents received the reverse ordering with negative (disapprove/unfavorable) answers shown first. The follow-up study asked the same questions as the main study, with two minor exceptions. Because a new British Prime Minister took office between the first and second data collection, the name was updated in the question (Theresa May to Boris Johnson). Also, a language preference question was added to better assign English versus Spanish.
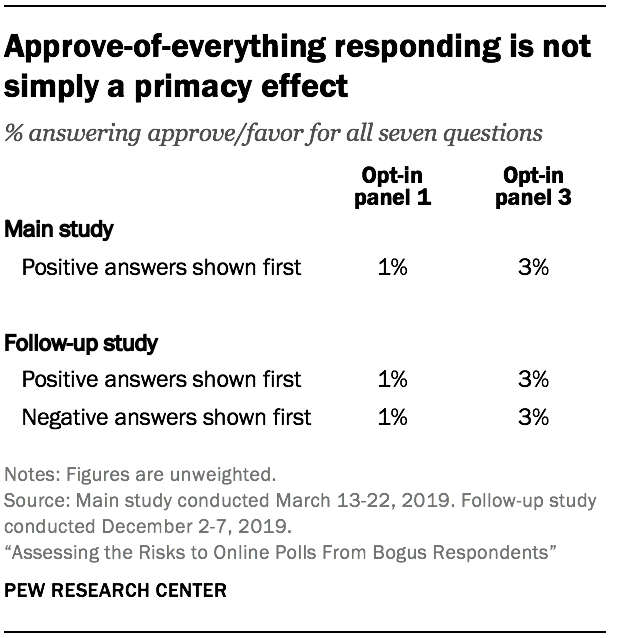
If the approve-of-everything behavior was merely a primacy effect (not purposeful), the follow-up study would have found a lower rate of the behavior when negative answers were shown first, as opposed to second. But that did not happen.
The incidence of respondents giving uniformly “approve”/”favorable” answers was basically the same regardless of the ordering of the answer choice. In opt-in panel 3, 3% of respondents approved of everything when positive answers were shown first, and the same amount did this when negative answers were shown first. The pattern was the same for opt-in panel 1, though with both rates being lower.
This result indicates that the small but measurable share of opt-in respondents who apparently approve no matter what is asked about do so intentionally. They sought out the positive answers even when they had to look for them. They were not lazily selecting the first answer shown. This suggests that randomizing the response options would not eliminate this source of apparent bias. Interestingly, the overall incidence of this behavior was the same in the follow-up study as it was in the main study. This bolsters confidence in the generalizability of the main study findings.
There are several other data points worth noting that discredit the notion that the approve-of-everything pattern is merely a primacy effect. One might expect that those answering approve/favor regardless of the question are always selecting the first answer choice. For example, on a four-point scale (e.g., “very favorable,” “mostly favorable,” “mostly unfavorable,” and “very unfavorable”), perhaps the always approving cases consistently select the most positive answer available (“very favorable”). That is not the case. For example, when the main study asked for an overall opinion of Vladimir Putin, 45% of the always approving respondents say “very favorable” while 55% say “mostly favorable.” Most approve-of-everything respondents selected the second choice, not the first. The same pattern was observed for the questions asking about Merkel, Macron and May.
In addition, if approve-of-everything respondents were simply picking answers near the top of every question, most would have answered the attention check (or trap question) incorrectly. In fact, 93% of the always approve cases answered this attention check correctly in the main study, and a nearly identical 94% of the always approve cases did so in the follow-up. In sum, a good deal of randomized and non-randomized data indicated that the approve-of-everything behavior is largely purposeful. It may be exacerbated when positive choices are offered first, but the follow-up study showed that even when positive choices are not offered first this small segment of opt-in respondents will seek them out.
The follow-up study also tested whether allowing opt-in respondents to skip questions would reduce the bogus incidence. Researchers created a flag for bogus cases in the follow-up study using the same definition as the main study. In one opt-in panel, the bogus rate was higher when respondents could skip, while in the other panel it was lower. For opt-in panel 3, the incidence of bogus cases was 6% in the main study that prohibited skipping for opt-in respondents, and it was 8% in the follow-up study that allowed respondents to skip. For opt-in panel 1, the incidence of bogus cases was 6% in the main study that prohibited skipping for opt-in respondents, and it was 3% in the follow-up study that allowed respondents to skip. In neither case was the rate of bogus respondents as low as it was for the address-recruited panels (1%).
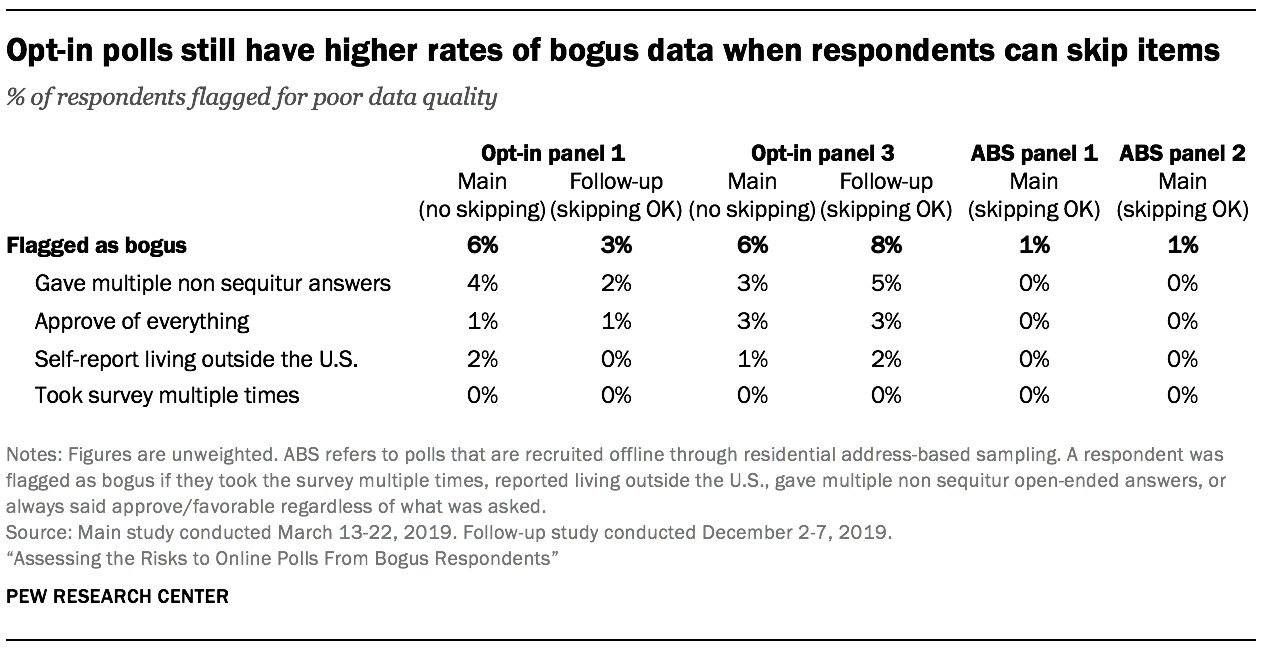
In general, the follow-up study sample from opt-in panel 1 showed better data quality than the main study sample. The incidence of non sequitur open-ends and self-reports of living outside the U.S. were lower in the follow-up. In opt-in panel 3, by contrast, the follow-up sample had poorer data quality than the main study sample. The incidence of non sequitur answers and self-reports of living outside the U.S. were both higher in the follow-up. Interestingly, while none of the opt-in panel 3 respondents plagiarized an open-ended answer in the main study, 15 respondents from that panel did so in the follow-up study (see Appendix D). They pulled from several of the sources tracked in the main study, including websites for Mount Vernon and the Washington State Legislature, as well as a website helping non-English speakers answer “How are you feeling today?”
If allowing opt-in respondents to skip questions was the key to achieving good data quality then we would have seen the bogus rates in both opt-in panels decline in the follow-up study, perhaps to the low level observed for the address-recruited samples. But that is not what happened. Opt-in panel 1 did perform better when answering was not required, but the incidence of bogus cases was still significantly higher than the levels observed in the address-recruited samples. Meanwhile, opt-in panel 3 got worse, with the incidence of bogus cases climbing to a striking 8% in the follow-up.
Given that one opt-in panel did worse when skipping was allowed but another panel did better, it is not clear that requiring respondents to answer questions has a strong, systematic effect on the incidence of bogus cases. It is worth noting that opt-in panels 1 and 3 source respondents from many of the same third party companies. In this study alone, sources used by both panels 1 and 3 include CashCrate, A&K International, DISQO, Market Cube, MySoapBox, Persona.ly, Tellwut and TheoremReach. The variance in data quality may have more to do with the relative shares of respondents coming from such sources than it necessarily does with the forced response setting. This is a topic worthy of future investigation.
Notably, all of the key findings from the main study were replicated in the follow up. For example, most bogus respondents (76%) in the main study passed both an attention check and a check for speeding. The share of bogus cases passing those same two checks in the follow-up was similar (70%). Similarly, a suspiciously high share of bogus cases in the main study reported being Hispanic (30%). In the follow-up this rate was 31%. The follow up study also replicated the finding that bogus respondents can have a small systematic effect on approval-type questions. For example, the estimated share expressing a favorable view of Vladimir Putin dropped four percentage points (from 20% to 16%) in the follow up-study when bogus respondents were removed from the opt-in panel 3 sample, and this estimate dropped one percentage point when bogus respondents were removed from the opt-in panel 1 sample (from 14% to 13%).


