
The study included other data quality checks based on those used in prior studies of response quality. Several of these tests found further evidence that opt-in respondents are more prone to giving low-quality answers than address-recruited respondents. Other tests found no meaningful differences across the sources.
One test developed decades ago involves asking respondents about a fictitious behavior. Reports of doing such a behavior means that the respondent gave an erroneous answer. This study operationalized that idea by asking respondents to select which of five websites they use at least once a month. The list included three real sites (YouTube, Instagram, Facebook) and two fictitious ones (FizzyPress and Doromojo). The share selecting at least one of the made-up websites was 2% in crowdsourced sample and ranged from 1% to 2% in the opt-in survey panel samples. There were some such cases in the address-recruited panels, but in both samples they rounded to 0%.
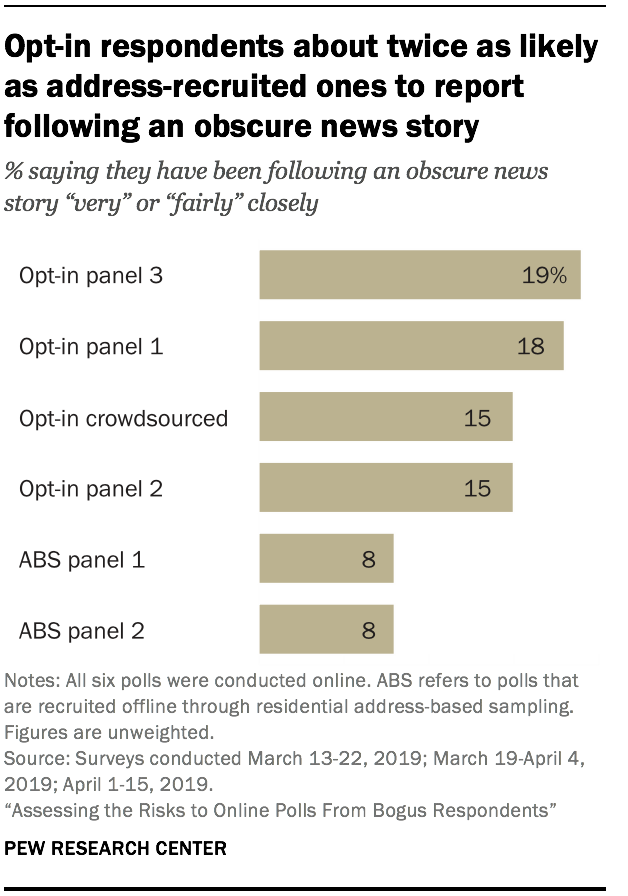
A similar check tested the credibility of answers to questions about following the news. Polls are often used to measure the extent to which the public is paying attention to various news stories. The survey asked, “How closely, if at all, have you been following news about China’s revised criminal procedure law?” and provided a four-point scale ranging from “Very closely” to “Not at all closely.” This is a real news story, but it received virtually no coverage from American news outlets.25 The revision became law about five months before the survey (Oct. 26, 2018) and does not appear to have been reported by any national U.S. news broadcast or newspaper. It was covered in the English language by Reuters, China’s state-run press agency (Xinhua) and the Library of Congress’s Global Legal Monitor. Only a very small proportion of U.S. adults can therefore credibly claim to have been following this news closely. Asking about an obscure news story was preferable to asking about a fictitious one in light of discussions around fake news in today’s media environment.
Between 15% and 19% of respondents in the opt-in recruited polls said they have been following news about this highly obscure story either “very” or “fairly” closely. Among the address-recruited online polls, the rate was about half that (8%).
Unlikely answers to other questions were very rare in all samples
The study offered respondents several other opportunities t0 report suspicious answers. In general, these other questions turned up very little.
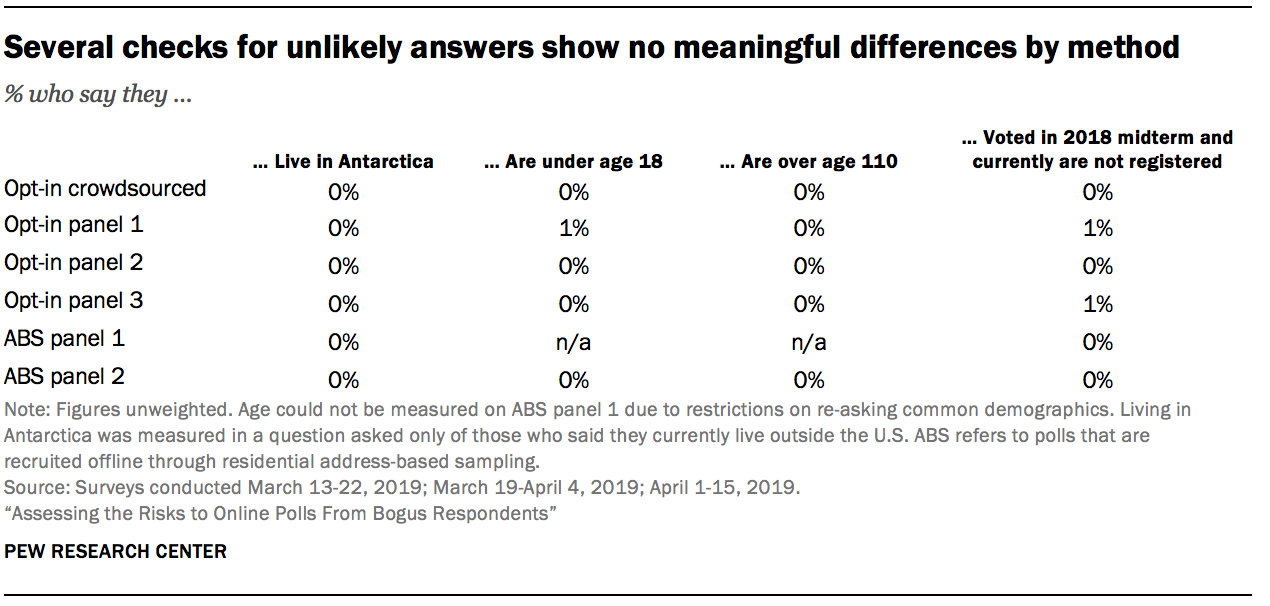
The respondent’s age was asked26 without any value restrictions, but very few respondents gave an out-of-range answer. The share of all study respondents reporting an age under 18 and the share giving an age over 110 both round to 0%. The study also asked whether respondents are currently registered to vote and whether they voted in the 2018 midterm election. The share of respondents reporting that they did vote in the 2018 midterms but are not currently registered to vote should be very low, considering that the election was held just four or five months before the survey depending on the sample. The incidence of that response pattern was very low (1% or less) in all sources.
As discussed above, another question asked whether respondents currently live outside or in the U.S. Those who reported living outside the country were administered a follow up question asking in which region of the world they live. Antarctica was listed as the first answer choice, but very few respondents selected it. Less than one half of one percent of all respondents in the study reported living outside the U.S. and living in Antarctica.
Little difference across sources in tendency to select answers listed first
For several questions, a random half of respondents from each source were shown the answer options in one order while the other half were shown the reverse order. For example, when asked “During the last twelve months, how often did you talk with any of your neighbors?,” half the respondents were shown options ordered from highest frequency to lowest (“Basically every day,” “A few times a week,” “A few times a month,” “Once a month,” “Less than once a month,” and “Not at all”), while the other half were shown the same list ordered from lowest frequency to highest. If respondents are answering carefully, they should give the same answer regardless of which order they received. However, this is not always the case. Because most people read from top to bottom, they tend to think about and answer with answer choices near the top slightly more than answers near the bottom. This is called a primacy effect.
Any online survey may be susceptible to primacy effects, particularly for questions where the answer may be difficult to recall precisely. In this study, opt-in recruited panelists were no more likely to show primacy effects compared to address-recruited respondents. The primacy effects themselves were meager, averaging less than one percentage point across all study respondents.
Researchers also tested for primacy effects in answers to a question asking about the respondent’s state of residence using a drop-down box. States were listed in alphabetical order, raising the possibility that careless respondents would over-report living in states like Alabama, Alaska, Arizona or Arkansas. Researchers compared the share of respondents reporting that they live in each state to the actual share of U.S. adults living in those states (according to the American Community Survey). There was no evidence in any of the samples that respondents were carelessly selecting a state listed at the top of the list.
Sources show similar levels of attention to question wording in exclusion statement test
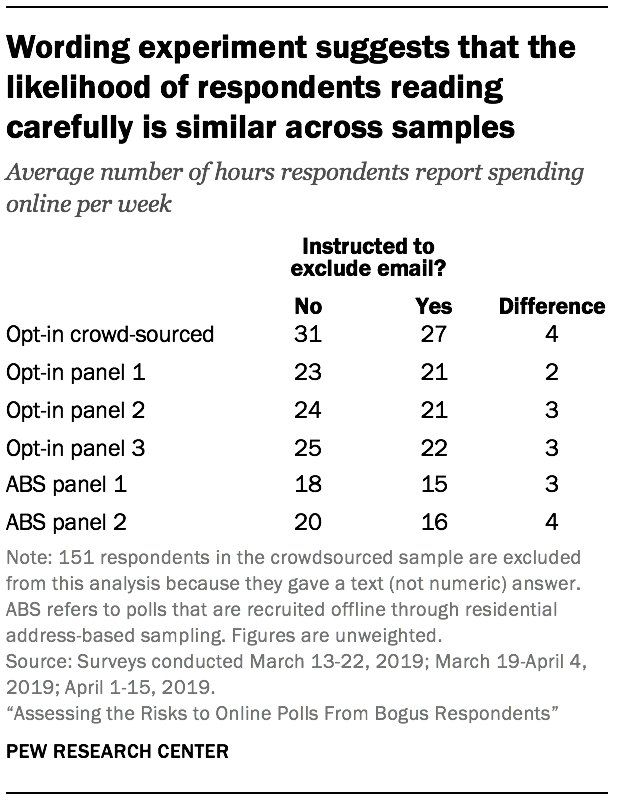
The study included a between subjects experiment to test attentiveness to question wording. A random half of respondents within each sample was asked, “How many hours do you usually spend online each week?” The other half was asked the same question with an instruction at the end: “How many hours do you usually spend online each week? Do NOT include time spent checking email.” On average, people receiving the version with the instruction to exclude email should report fewer hours than those receiving the shorter version. The difference between the average number of hours given by those shown the short version and the average number of hours given by people shown the long version (with the exclusion instruction) is an aggregate measure of attentiveness to the question wording. In this case, larger differences between those averages are better, as that suggests more attentiveness.
The difference between the means in two versions were similar across the sources. There was a statistically significant difference between one of the address-recruited panels and one of the opt-in panels, but this did not translate to a consistent difference between address-recruited and opt-in panels as a whole.


