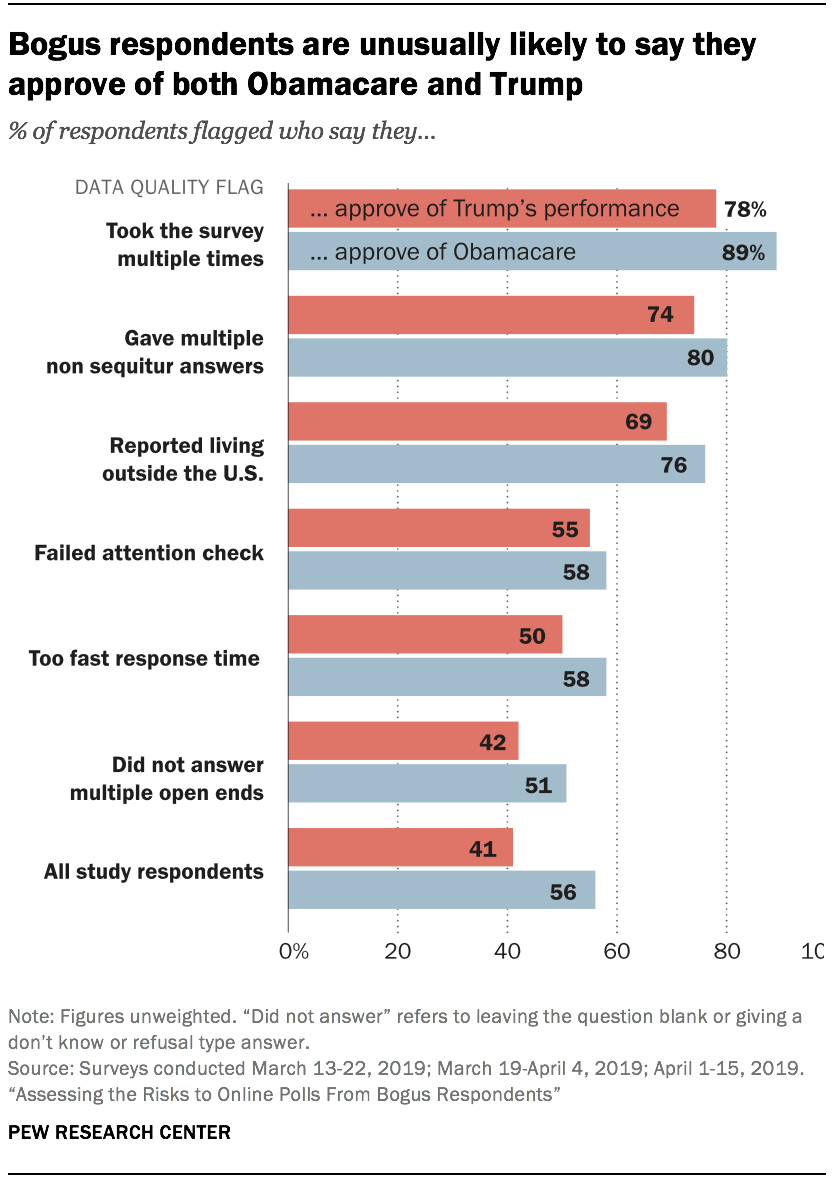
Respondents who consistently say they approve or favor whatever is asked are not the only ones introducing bias. Those flagged for other suspicious behaviors also answered political questions in ways that differ from other adults. In particular, those saying they currently live outside the U.S. or who give multiple non sequitur answers expressed much higher levels of support for both Donald Trump’s job performance and the 2010 health care law (also known as Obamacare), relative to other respondents. Nearly three quarters (74%) of respondents giving multiple non sequiturs said they approve of Trump’s job performance, compared with 41% of the study respondents overall. Similarly, 80% of those giving multiple non sequiturs said they approve of the 2010 health care law, compared with 56% of the study respondents overall.

The combination of these two views is relatively rare in the public. According to the address-recruited samples, 12% of those who approve of the president’s job performance say they approve of the 2010 health care law. Among those giving multiple non sequiturs, however, 86% of those approving of Trump’s job performance approve of the ACA. Given that this subgroup expresses a highly unusual viewpoint and is known to have members providing bogus data, this combination of attitudes should probably not be taken at face value.
Notably, traditional quality checks tend to flag respondents who express more common political views. Respondents flagged for answering too quickly, not answering questions, or failing an attention check question are not very different from the study participants as a whole on these attitudes. For example, approval of the Affordable Care Act ranges from 51% to 58% among respondents receiving those various flags – similar to the overall approval rating for the ACA in the study (56%).
Based on these findings, it is understandable how prior research teams looking at those traditional flags could have concluded that such respondents were not that different and are perhaps best kept in the survey analysis. But the data quality flags highlighted in this study (e.g., taking the survey multiple times, giving non sequitur answers) tell a very different story. Those flags show suspect respondents giving systematically different answers for key questions. Because the answers are systematic (e.g., largely favorable to the 2010 health care law or to Trump), they stand to move topline survey figures rather than merely adding noise.
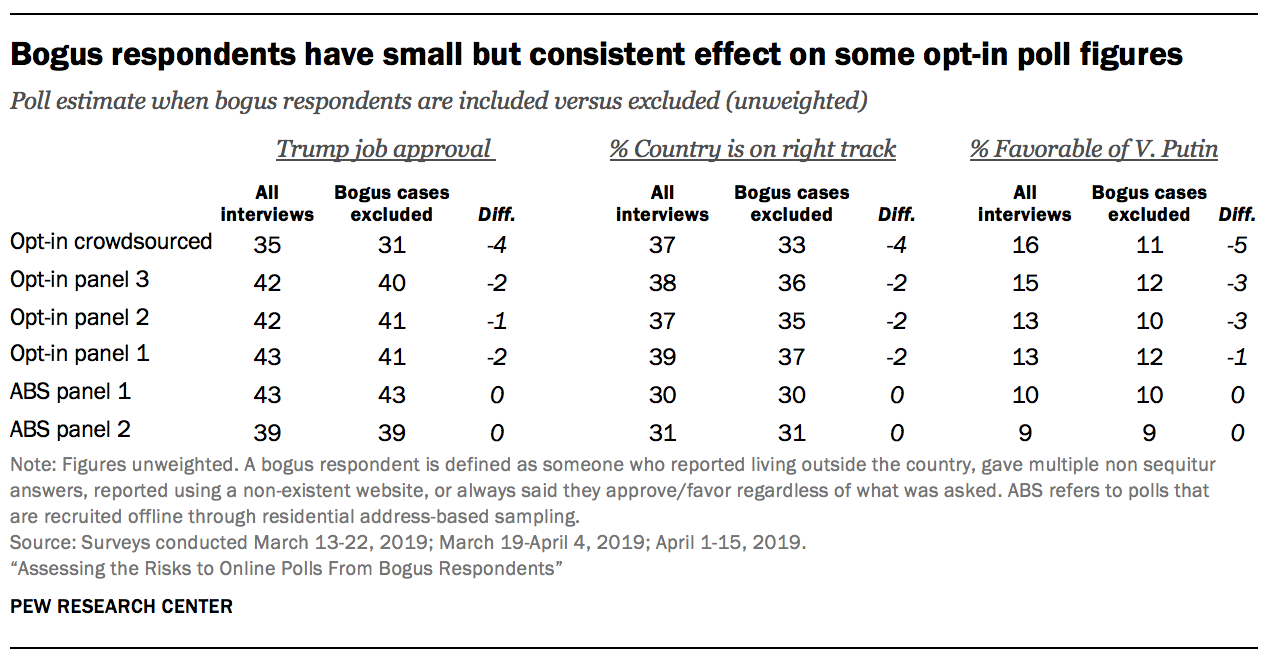
To quantify the consequences for poll results, researchers computed estimates for key political questions with and without bogus respondents. This analysis uses the same definition of bogus respondents introduced above (a respondent who reported living outside the country, gave multiple non sequitur answers, took the survey multiple times, or always said they approve/favor regardless of what was asked).

As noted above, the rate of bogus respondents was 7% in the crowdsourced poll, 5% on average in the three opt-in panel polls, and 1% on average in the two address-recruited panel polls. With so few address-recruited panelists affected, it is not surprising that removing them has essentially no effect on estimates. For the opt-in polls, by contrast, the rate of bogus respondents is high enough for them to have a measurable, if small, impact. In opt-in panel 3, for example, the president’s job approval rating drops two percentage points (from 42% to 40%) when bogus cases are excluded. In the crowdsourced sample, Trump’s job approval drops by four percentage points when bogus cases are removed (35% to 31%).23 Similarly, Vladimir Putin’s favorability rating drops by three percentage points in two of the opt-in panel polls when bogus cases are removed.
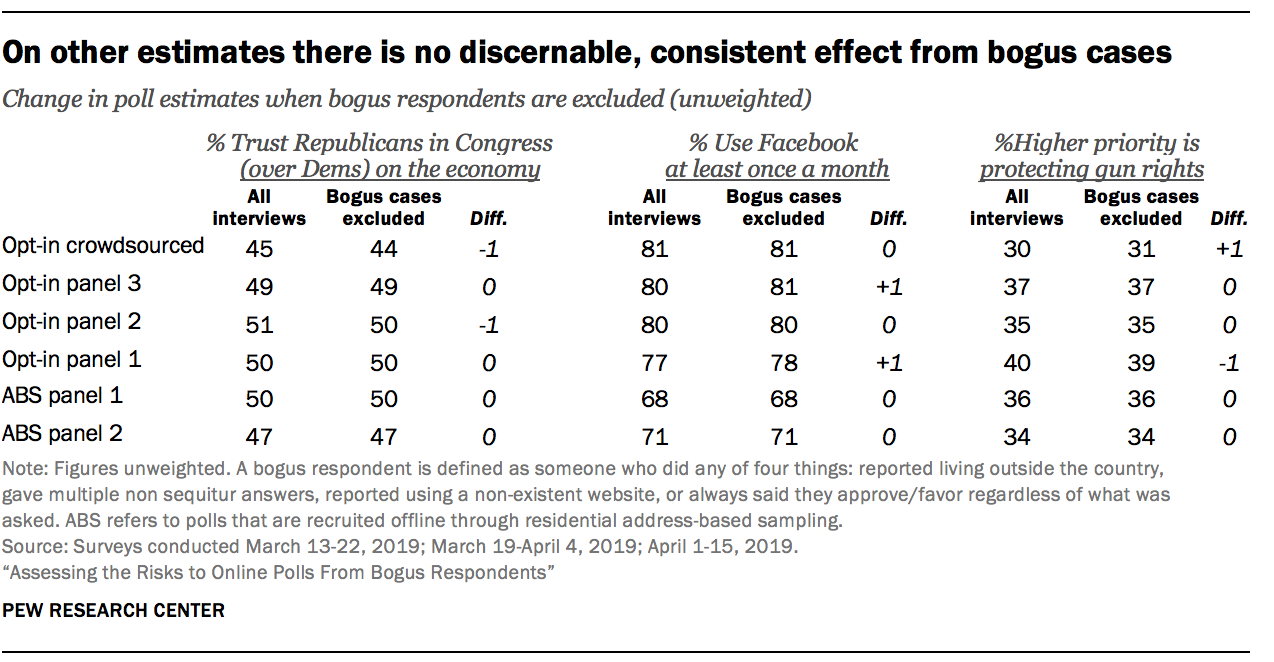
Not all survey estimates, however, are affected by bogus respondents. For example, estimates of the political party people trust more on the economy do not change at all for two of the opt-in panel polls when bogus respondents are dropped. Similarly, there is no change in some of the opt-in estimates for the share saying that protecting the right to own guns is a higher priority than enacting new laws to try to reduce gun violence, when bogus cases are dropped.

One characteristic stands out when looking at which questions are influenced by bogus cases versus which ones are not. Questions that allow the respondent to give a positively valanced answer appear to be most affected. For example, the question “Would you say things in this country today are generally headed in the right direction (or) off on the wrong track?” allows the respondent to say something is going right rather than wrong. As discussed above, respondents giving bogus data are very prone to giving positive answers. By contrast, the question battery “Who do you trust more to handle each of the following issues… Democrats in Congress or Republicans in Congress?” was basically unaffected by bogus respondents. The choice of Democrats versus Republicans apparently does not map onto this behavior of giving uniformly positive answers. Put simply, the bias from bogus data documented in this study is politically agnostic – neither pro-Republican nor pro-Democrat.


