How we did this
We compared data from six online sources used for public polling, including three prominent sources of opt-in survey samples, one crowdsourcing platform, and two survey panels that are recruited offline using national random samples of residential addresses and surveyed online. One of the address-recruited samples comes from the Pew Research Center’s American Trends Panel. The study included more than 60,000 interviews with at least 10,000 interviews coming from each of the six online sources. All samples were designed to survey U.S. adults ages 18 and over.
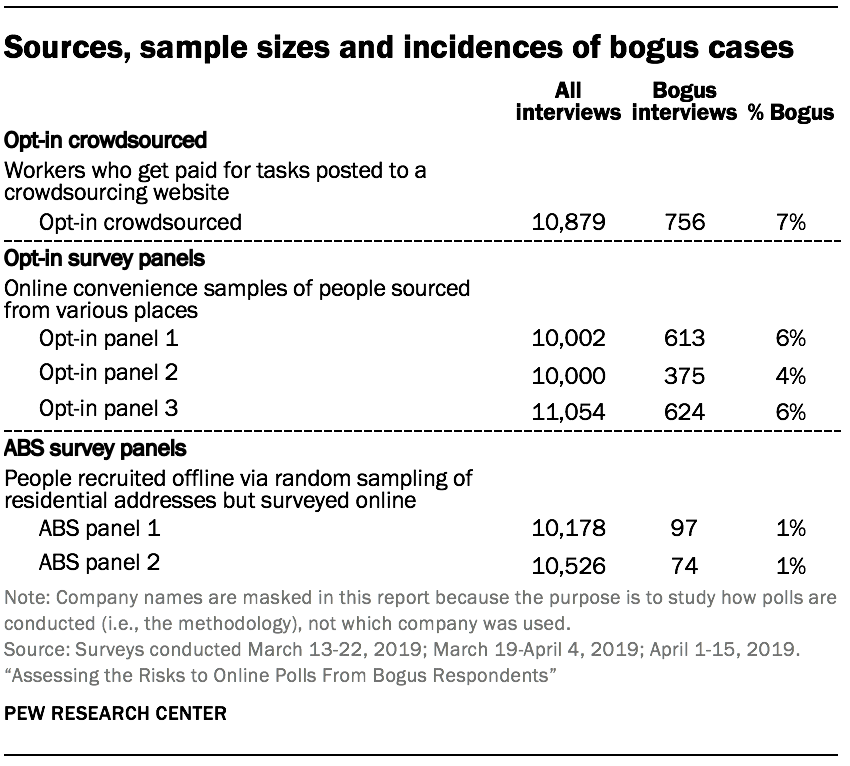
More than 80% of the public polls used to track key indicators of U.S. public opinion, such as the President’s approval rating or support for Democratic presidential candidates, are conducted using online opt-in polling.1 A new study by Pew Research Center finds that online polls conducted with widely-used opt-in sources contain small but measurable shares of bogus respondents (about 4% to 7%, depending on the source). Critically, these bogus respondents are not just answering at random, but rather they tend to select positive answer choices – introducing a small, systematic bias into estimates like presidential approval.

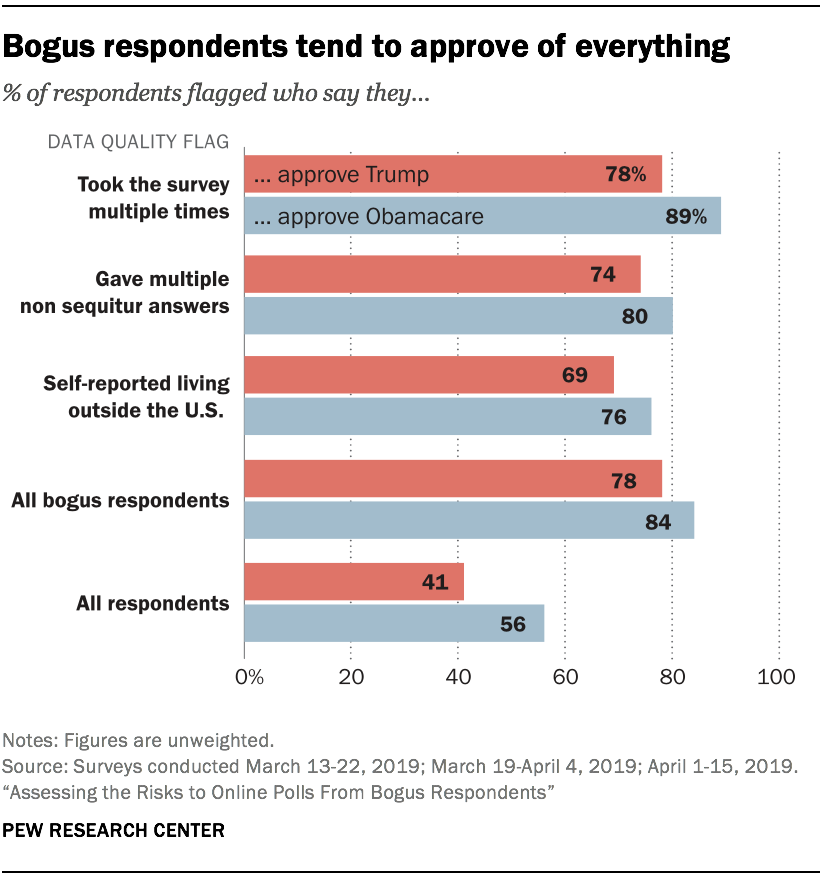
This pattern is not partisan. While 78% of bogus respondents reported approving of President Donald Trump’s job performance, their approval rating of the 2010 health care law, also known as Obamacare, was even higher, at 84%. Open-ended answers show that some respondents answer as though they are taking a market research survey (e.g., saying “Great product” regardless of the question).
While some challenges to polls are ever-present (e.g., respondents not answering carefully or giving socially desirable answers), the risk that bad actors could compromise a public opinion poll is, in some respects, a new one. It is a consequence of the field’s migration toward online convenience samples of people who sign themselves up to get money or other rewards by taking surveys. This introduces the risk that some people will answer not with their own views but instead with answers they believe are likely to please the poll’s sponsor. It also raises the possibility that people who do not belong in a U.S. poll (e.g., people in another country) will try to misrepresent themselves to complete surveys and accrue money or other rewards.
With that backdrop, this study was launched to measure whether behavior of this sort is present in widely-used online platforms and, if so, to what extent and consequence. This study defines a bogus respondent as someone who met one or more of the following criteria: took the survey multiple times; reported living outside the United States (the target population is U.S. adults); gave multiple non sequitur open-ended answers; or always said they approve/favor regardless of what was asked.

The study finds that not all online polls suffer from this problem. Online polls that recruit participants offline through random sampling of residential addresses have only trace levels of bogus respondents (1% in each of two address-recruited panels tested). In address-recruited panels, there are too few bogus cases to have a perceptible effect on the estimates.
The study compares data from six online sources used for public polling: three prominent sources of opt-in survey samples (two marketplaces and one panel),2 one crowdsourcing platform,3 and two survey panels that are recruited offline using national random samples of residential addresses but surveyed online. One of the address-recruited samples comes from the Center’s American Trends Panel. The study included more than 60,000 interviews with at least 10,000 interviews coming from each of the six online sources. All samples were designed to survey U.S. adults ages 18 and over. Analyses are unweighted as this is an examination of the credibility of respondents’ answers.4
This is not the first study to find untrustworthy interviews in online surveys. This study is the first, however, to compare data quality from multiple opt-in and address-recruited survey panels, as well as a crowdsourcing platform. This study is also the first to employ sample sizes large enough to reliably estimate the incidence of bogus respondents, as well as the demographics and political attitudes reported by bogus respondents in each source.

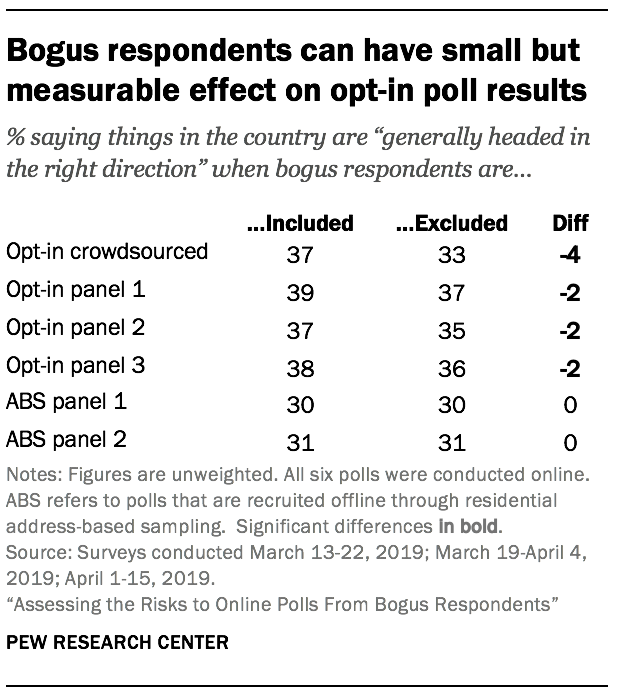
Some poll questions are more affected by bogus respondents than others. Questions that allow the respondent to give a positively valanced answer show larger effects than those that do not. For example, a classic poll question designed to get a high-level read on public sentiment asks whether things in the country are “generally headed in the right direction” or “off on the wrong track.” The share saying “generally headed in the right direction” drops two percentage points in the opt-in survey panel polls when bogus respondents are removed. In the crowdsourced poll, the figure drops four points when removing bogus cases. However, other questions – such as political party affiliation or views on new gun laws – do not appear to map onto this behavior and show little to no influence from bogus cases on topline results.[5. Ahler and colleagues found that bogus cases can bias estimates of relationships between survey variables. While this topic is not addressed in this report, it could be explored with the publicly available micro-dataset.]
Part of the explanation is that a segment of opt-in respondents express positive views about everything – even when that means giving seemingly contradictory answers. This study includes seven questions in which respondents can answer that they “approve” or have a “favorable” view of something. About half of the question topics (Vladimir Putin, Theresa May, Donald Trump) tend to draw support from conservative audiences, while the others are more popular with left-leaning audiences (Emmanuel Macron, Angela Merkel and the 2010 health care law).5 If respondents are answering carefully, it would be unusual for someone to express genuine, favorable views of all seven.
The study found 4% of crowdsourced respondents gave a favorable response to all seven questions, followed by 1% to 3% of the opt-in survey panel polls. There were a few such respondents in the address-recruited polls, but they constitute less than a half of one percent. The upshot is that small but nontrivial shares of online opt-in respondents seek out positive answer choices and uniformly select them (e.g., on the assumption that it is a market research survey and/or that doing so would please the researcher). In a follow-up experiment in which the order of responses was randomized, researchers confirmed that this approve-of-everything response style was purposeful (not simply a primacy effect) (see Chapter 8).
But these uniformly positive respondents are not alone in nudging approval ratings upward. Respondents exhibiting other suspect behaviors answer in a similar way. For example, if always-approving cases are set aside, the study finds that 71% of those giving multiple non sequiturs to open-ended questions approve of the 2010 health care law, as do 80% of those found taking the survey more than once.67 Similarly, when always-approving cases are set aside, 42% of those taking the survey multiple times express a favorable view of Vladimir Putin, as do 32% of those giving multiple non sequitur answers. These rates are roughly three times higher than Putin’s actual favorability rating among Americans (about 9%), according to high-quality polling. These patterns matter because they are suggestive of untrustworthy data that may bias poll estimates and not merely add noise.
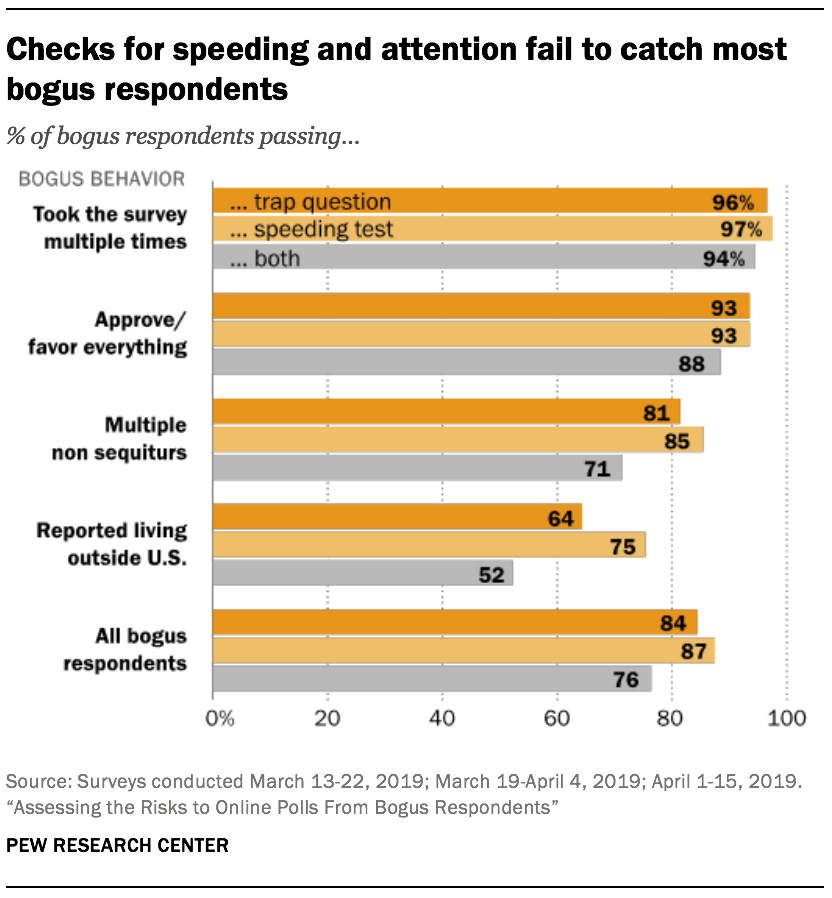
The study also finds that two of the most common checks to detect low quality online interviews – looking for respondents who answer too fast or fail an attention check (or “trap”) question — are not very effective. The attention check question read, “Paying attention and reading the instructions carefully is critical. If you are paying attention, please choose Silver below.” Some 84% of bogus respondents pass the trap question and 87% pass a check for responding too quickly.
After using those checks to remove cases, the opt-in recruited polls examined here still had 3% to 7% of interviewing coming from bogus respondents, compared to 1% in address-recruited online samples.

One of the more notable implications of the study is evidence suggesting people in other countries might be able to participate in polls intended to measure American public opinion. Other researchers have documented foreign respondents in India and Venezuela participating in American social science research using crowdsourcing platforms. This study confirms those findings. Some 5% of crowdsourced respondents were using an IP address based outside of the U.S., and the most common host countries for the foreign IP addresses were the Seychelles and India. In the address-recruited online samples, by contrast, the rate of foreign IP addresses was 1%, and the most common host countries for the foreign IP addresses were Canada and Mexico. 8 Virtually no respondents in the opt-in survey panel samples had IP addresses from outside the U.S., suggesting that the survey panels have controls in place guarding against that. Other key findings from the study include:
Bogus interviews were prone to self-reporting as Hispanic or Latino. Overall, 10% of study respondents identified as Hispanic, but the rate was three times higher (30%) among cases flagged for bogus behavior. According to the Census Bureau’s American Community Survey, Hispanics make up 16% of the U.S. adult population. While some of the bogus respondents could very well be Hispanic, this rate is likely inflated for several reasons. In particular, Hispanic ethnicity was measured with a stand-alone “yes/no” question, so people answering at random would be expected to report “yes” about half the time. As a consequence of this greater propensity for bogus respondents to identify as Hispanic, substantive survey estimates for Hispanics (such as presidential approval) are at risk of much greater bias than for the sample as a whole (see Chapter 6).
Open-ended questions elicited plagiarized answers and product reviews from some opt-in and crowdsourced respondents. Responses to open-ended questions show that in all six sources, most respondents appear to be giving genuine answers that are responsive to the question asked. That said, 2% to 4% of opt-in poll respondents repeatedly gave answers that did not match the question asked, compared to 0% of address-recruited panel respondents. Further examination of the 6,670 non sequitur answers in the study revealed several different types: unsolicited product reviews, plagiarized text from other websites found when entering the question in a search engine, conversational text, common words and other, miscellaneous non sequitur answers. Plagiarized responses were found almost exclusively in the crowdsourced sample, while answers sounding like product reviews as well as text sounding like snippets from a personal conversation were more common in the opt-in survey panels.
One open-ended question was particularly effective for detecting bogus respondents. The question, “What would you like to see elected leaders in Washington get done during the next few years? Please give as much detail as you can,” elicited twice as many plagiarized answers as the question eliciting the second most (176 versus 78). Two thirds (66%) of the plagiarized answers were snippets from various biographies of George Washington. These respondents (nearly all of whom were from the crowdsourced sample) had apparently put the question into a search engine, and the first two search results happen to be online biographies of the first U.S. President.
Do changes of 2 or 3 percentage points really matter?
Findings in this study suggest that– with multiple, widely used opt-in survey panels – estimates of how much the public approves or favors something are likely biased upward, unless the pollster performs data cleaning beyond the common checks explored here. The bias comes from the roughly 4% to 7% of respondents who are either not giving genuine answers or are not actually Americans. Online polls recruited offline using samples of addresses do not share this problem because the incidence of low-quality respondents is so low. In absolute terms, the biases documented in this report are small and their consequences can be viewed several ways:
- It almost certainly does not matter if, in a single poll, the President’s approval rating is 43% versus 41%. Such a difference is typically within the margin of error and does not change what poll says about the overall balance of public sentiment.
- It is more debatable whether it matters if numerous national polls are overestimating public support for a policy or a president by a few percentage points. For policies like the Affordable Care Act, where public support has been somewhat below or somewhat above 50%, a small, systematic bias across polls could conceivably have consequences.
- It’s also important to consider what happens if policy makers and the public lose more trust in polls due to data coming from people who give insincere answers or who should not be in the survey in the first place. The problems uncovered in this study are minor in any given survey, but they point to the potential for much more serious problems in the near future, as reliance on opt-in samples increases and the barriers for entry into the public polling field continue to fall. For researchers using random national sampling or even well-designed opt-in samples, one risk is that a highly public scandal involving a low-quality opt-in sample has the potential for damaging the reputation of everyone in the field. This research suggests that there is considerable work to be done to reduce this risk to an acceptable level.
Bots or people answering carelessly
Fraudulent data generated by survey bots is an emergent threat to many opt-in polls. Survey bots are computer algorithms designed to complete online surveys automatically. At least one such product is commercially available and touts an “undetectable mode” with humanlike artificial intelligence. Bots are not a serious concern for address-recruited online panels because only individuals selected by the researcher can participate. They are, however, a potential concern for any opt-in poll where people can self-enroll or visit websites or apps where recruitment efforts are common.
There are numerous anecdotal accounts of bots in online opt-in surveys. Rigorous research on this issue, by contrast, is scarce. One major difficulty in such research is distinguishing between bots and human respondents who are simply answering carelessly. For example, logically inconsistent answers or nonsensical open-ended answers could be generated by either a person or a bot. This report details the response patterns observed and, where possible, discusses whether the pattern is more indicative of a human or an algorithm. Categorizing cases as definitively bot or not a bot is avoided because typically the level of uncertainty is too high. On the whole, data from this study suggest that the more consequential distinction is between interviews that are credible versus those that are not credible (or bogus), regardless of the specific process generating the data.
Implications for polling
The study finds that no method of online polling is perfect, but there are notable differences across approaches with respect to the risks posed by bogus interviews. The crowdsourced poll stands out as having a unique set of issues. Nearly all of the plagiarized answers were found in that sample, and about one-in-twenty respondents had a foreign IP address. For experimental research, these problems may be mitigated by imposing additional controls and restricting participation to workers with a task completion or approval rate of at least 95%. But requiring a 95% worker rating is a dubious criterion for polls purporting to represent Americans of all abilities, education levels and employment situations. Furthermore, the presence of foreign respondents was just one of several data quality issues in the crowdsourced sample. If all the interviews with a foreign IP address are removed from the crowdsourced sample, the rate of bogus respondents (4%) is still significantly higher than that found in samples recruited through random sampling.
For online opt-in survey panels and marketplaces, concerns about data quality are longstanding. Perhaps the most noteworthy finding here is that bogus respondents can have a small, systematic effect on questions offering a positively valanced answer choice. This should perhaps not come as a surprise given that many if not most surveys conducted on these platforms are market research assessments of how much people approve or disapprove of various products, advertisements, etc. It is difficult to find any other explanation for out-of-the-blue answers like, “m I love this has good functions meets the promise and is agreed to the money that is paid for it. ans.” This study suggests that some quality checks may help detect and remove some of these cases. But it is unclear which public pollsters have routine, robust checks in place and how effective they are. This study shows that if no quality checks are done, one should expect approval-type estimates to be impacted.
To be sure, opt-in polls do not have a monopoly on poor respondent behavior. A number of address-recruited respondents failed various data quality checks in this study. That said, the incidences were so low that poll estimates were not affected in a systematic way.
Does this study mean that polls are wrong?
No. While some of the findings are concerning, they do not signal that polling writ large is broken, wrong or untrustworthy. As the 2018 midterm (and even national-level polling from the 2016 election) demonstrated, well-designed polls still provide accurate, useful information. While not included in this study, other methods of polling – such as live telephone interviewing or one-off surveys in which people are recruited though the mail to take an online survey – can perform well when executed carefully.
As for online polls, the study finds that survey panels recruited offline using random sampling of mailing addresses performed very well, showing only a trace level of bogus respondents. Panels and marketplaces that use opt-in sourcing showed higher levels of untrustworthy data, but the levels were quite low. Rather than indicating some polls are wrong, this study documents a number of data quality problems – all of which are currently low level but that have the potential to grow worse in the near future.
Overview of research design
This study was designed to measure the incidence of untrustworthy interviews in online platforms routinely used for public polls. Center researchers developed a questionnaire (Appendix E) containing six open-ended questions and 37 closed-ended questions. The beginning of the questionnaire is designed to look and feel like a routine political poll. In fact, the opening questions are modeled after those used by several of the most prolific public polls conducted online.
As other researchers have noted, open-ended questions can be an effective tool for identifying problematic respondents. Open-ended questions (e.g., “What would you like to see elected leaders in Washington get done during the next few years?”) require survey-takers to formulate answers in their own words. Researchers leveraged this to categorize open-ended answers for several suspicious characteristics (see Appendix B). Similarly, a number of closed-ended questions were also designed to detect problematic responding (see Chapter 7). Other questions probed commonly polled topics such as evaluations of presidential job performance and views of the Affordable Health Care Act.
In total, six online platforms used for public polling were included. Three of the sources are widely used opt-in survey panels. One is an opt-in crowdsourcing platform. Two of the sources are survey panels that interview online but recruit offline. For both panels recruited offline, most panelists were recruited using address-based sampling (ABS), and so “address-recruited” is used throughout the report as a shorthand. Before using ABS, both panels recruited offline using random samples of telephone numbers (random digit dialing). For the purposes of this study, the important property is that everyone in these two panels was recruited offline by randomly sampling from a frame that covers virtually all Americans.9
Each sample was designed to achieve at least 10,000 interviews with U.S. adults age 18 and older in all 50 states and the District of Columbia. Data collection took place in March and April 2019. The exact field dates for each sample and additional methodological details are provided in Appendix A. The micro-dataset is available for download on the Pew Research Center website.
Limitations and caveats
Generalizability is challenging in studies examining the quality of online opt-in surveys because such surveys are not monolithic. Sample vendors and public pollsters vary widely both in their quality control procedures and the extent to which those procedures are communicated publicly. While some organizations publicize the steps they take to identify and remove bogus respondents, the practice is far from universal, and a review of methods statements from opt-in polls used to track presidential approval, for instance, turned up no mention of data quality checks whatsoever. This makes it difficult for even savvy consumers of polling data to determine what kind of checking, if any, has been performed for a given poll.
Broadly speaking, this study speaks to online polls where the pollster performs little to no data quality checking of their own. To the extent that public pollsters routinely use sophisticated data quality checks – beyond the speeding and trap questions addressed in this report – the results from this study may be overly pessimistic.
While it is not reasonable to expect such pollsters to detail exactly how they try to detect bogus cases (as that may tip off bad actors), some discussion of procedures in place would be useful to polling consumers trying to ascertain whether this issue is addressed at all. A plausible scenario is that at least some pollsters rely on the panels/marketplaces selling the interviews to be responsible for data quality and security. The data in this study were collected under just that premise, and the results demonstrate that reliance on opt-in panels can lead to non-trivial shares of bogus cases.


