
Any evaluation of a new polling technology like AI-based surveys starts with a basic question: How well does it replicate the results of high-quality, nationally representative probability polls? Does it accurately depict the shares of Americans who hold various views? And does it work better or worse for particular demographic and behavioral subgroups?
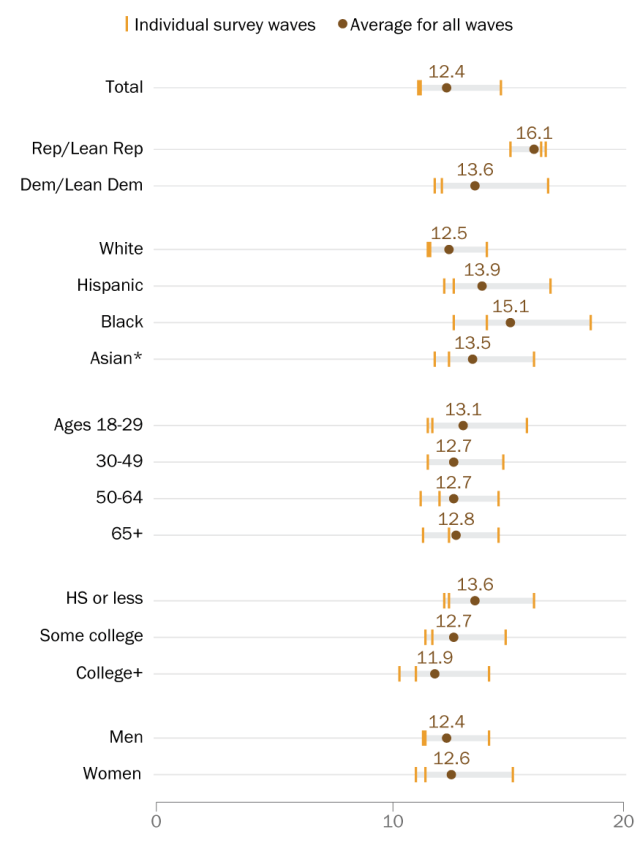
Source: Surveys of U.S. adults and “digital twins” synthetic analysis using Claude Opus 4.6 set to low reasoning with extended profile information and expert reflection. Surveys were conducted Jan. 20-26, 2026 (replicated March 9-12 and April 7-10), March 23-29, 2026 (replicated March 30-April 2), and April 20-26, 2026 (replicated April 27-May 1).
“Can AI Stand In for Human Survey-Takers? Not Really”
| Group | Wave 185 | Wave 190 | Wave 192 | Average across waves |
|---|---|---|---|---|
| Total | 11.3 | 14.7 | 11.2 | 12.4 |
| White | 11.7 | 14.1 | 11.6 | 12.5 |
| Hispanic | 12.7 | 16.8 | 12.3 | 13.9 |
| Black | 14.1 | 18.5 | 12.7 | 15.1 |
| Asian | 12.5 | 16.1 | 11.9 | 13.5 |
| 18-29 | 11.6 | 15.8 | 11.8 | 13.1 |
| 30-49 | 11.6 | 14.8 | 11.6 | 12.7 |
| 50-64 | 12.1 | 14.6 | 11.3 | 12.7 |
| 65+ | 12.5 | 14.6 | 11.4 | 12.8 |
| Rep/Lean Rep | 15.1 | 16.6 | 16.4 | 16.1 |
| Dem/Lean Dem | 12.2 | 16.7 | 11.9 | 13.6 |
| Some College | 11.8 | 14.9 | 11.5 | 12.7 |
| H.S. graduate or less | 12.3 | 16.1 | 12.5 | 13.6 |
| College graduate+ | 11.1 | 14.2 | 10.4 | 11.9 |
| Men | 11.5 | 14.2 | 11.4 | 12.4 |
| Women | 11.5 | 15.2 | 11.1 | 12.6 |
Source: Surveys of U.S. adults and “digital twins” synthetic analysis using Claude Opus 4.6 set to low reasoning with extended profile information and expert reflection. Surveys were conducted Jan. 20-26, 2026 (replicated March 9-12 and April 7-10), March 23-29, 2026 (replicated March 30-April 2), and April 20-26, 2026 (replicated April 27-May 1).
“Can AI Stand In for Human Survey-Takers? Not Really”
To evaluate these questions, we used AI respondents to replicate three survey waves previously administered to the American Trends Panel (ATP). We then calculated the average question-level error rate for each wave, including the error rates for several demographic subgroups.
These are the three ATP waves we replicated and some of the topics they included:
- Wave 185 (fielded January 2026): political attitudes and opinions of the Trump administration, military action in Venezuela, annexation of Greenland, conduct of U.S. Immigration and Customs Enforcement officers, and attitudes toward data centers
- Wave 190 (fielded March 2026): global politics and international relations, knowledge questions about international affairs and the U.S. Constitution
- Wave 192 (fielded April 2026): presidential approval and political attitudes, problems facing the country, military action in Iran, and sleep habits
This analysis is part of a larger evaluation of AI-generated synthetic samples in public opinion research. Read a summary of the main findings and refer to the methodology for more details on how we conducted our synthetic poll and compared it with human polling results.
Broadly speaking, the AI survey respondents did not match the views of their human counterparts especially well. Across all three waves, the synthetic polling results differed by an average of 12 percentage points from the estimates produced by the human polls. For individual waves, absolute average error ranged from 11 to 15 percentage points.
There were also clear errors for all major subgroups in the analysis. For a range of demographic and behavior groups across all three waves, none had an average error of less than 12 points. For several groups, these errors were around 15 points or more.
The synthetic sample performed especially poorly when it came to replicating the responses of groups including:
- Republicans and Republican leaners
- Black adults
- Those who have not attended college
- Those who use the internet infrequently or not at all
Synthetic poll performance on specific topics and subgroups
In addition to the model’s overall poor performance replicating public opinion for different subgroups, we also found that this method produced skewed or biased results for specific questions and subgroups.
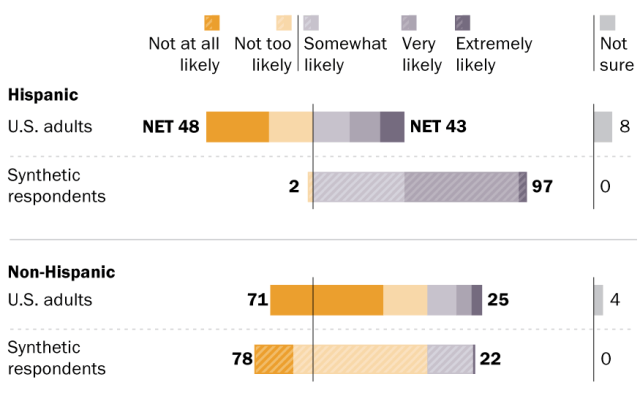
Views of Hispanic adults toward the World Cup, Spanish classes in schools
“Can AI Stand In for Human Survey-Takers? Not Really”
| Group | Mode | Net likely | Extremely likely | Very likely | Somewhat likely | Not too likely | Not at all likely | Net unlikely | Not sure |
|---|---|---|---|---|---|---|---|---|---|
| Hispanic | Synthetic respondents | 97 | 4 | 52 | 41 | 2 | 0 | 2 | 0 |
| Hispanic | US adults | 42 | 11 | 14 | 17 | 20 | 28 | 48 | 8 |
| Non-Hispanic | Synthetic respondents | 22 | 0 | 1 | 21 | 61 | 17 | 78 | 0 |
| Non-Hispanic | US adults | 25 | 5 | 7 | 13 | 20 | 51 | 71 | 4 |
“Can AI Stand In for Human Survey-Takers? Not Really”
AI models are trained on how humans think and act in large part from online content. Because of this, there has long been evidence and concern that they have a tendency to make assumptions or rely on stereotypes about certain groups of people. We saw several instances of this behavior in our own experiment.
For example, in a March 2026 ATP survey, fewer than half of real Hispanic adults (42%) said they were at least somewhat likely to follow the World Cup. In contrast, nearly every simulated Hispanic respondent in our AI poll (a full 97%) said they were likely to follow the tournament.
Likewise, the synthetic sample dramatically overestimated Hispanic opinion on the importance of teaching Spanish in schools. According to the synthetic sample, 72% of Hispanic adults believe it is extremely important for schools to offer instruction in Spanish – more than double the rate among real Hispanic adults (32%).
Partisan attitudes
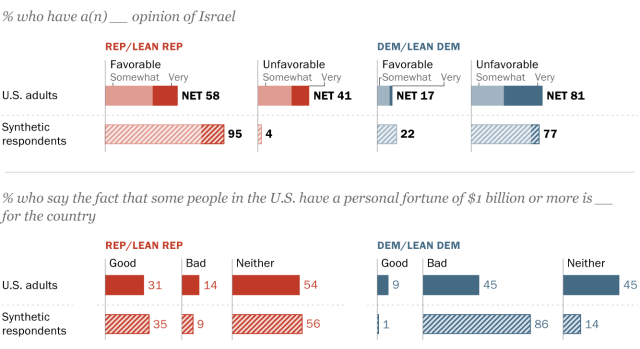
In addition to racial stereotyping, there were also numerous instances of our model misstating the nature and magnitude of partisan differences on issues of the day. Most notably, our AI survey often took views that are held by many Democrats or Republicans – but by no means all of them – and made them appear close to universal.
For instance, at least 80% of Democrats and Democratic leaners in our AI survey say:
- The fact that some people in the United States have personal fortunes of more than $1 billion is a bad thing for the country (while the actual share is 45%).
- They would prefer to live in an area where homes are smaller and closer to each other, but with lots of amenities nearby (actually 60%).
Similarly, more than 90% of Republicans and Republican leaners in our AI survey say:
- The police should be allowed to stop and search anyone who fits the general description of a crime suspect (actually 69%).
- They have very or somewhat favorable views of Israel (actually 58%).
Across numerous such examples, our AI respondents were far less politically diverse than the actual population.
“Can AI Stand In for Human Survey-Takers? Not Really”
| Do you think the fact that there are some people in this country who have personal fortunes of a billion dollars or more is … | A good thing for the country | A bad thing for the country | Neither a good thing or a bad thing | ||
|---|---|---|---|---|---|
| Synthetic respondents | Dem/Lean Dem | 1 | 86 | 14 | |
| Synthetic respondents | Rep/Lean Rep | 35 | 9 | 56 | |
| US adults | Dem/Lean Dem | 9 | 45 | 45 | |
| US adults | Rep/Lean Rep | 31 | 14 | 54 | |
| Do you have a favorable or unfavorable opinion of Israel? | Very favorable | Somewhat favorable | Somewhat unfavorable | Very unfavorable | |
| Synthetic respondents | Dem/Lean Dem | 0 | 22 | 68 | 9 |
| Synthetic respondents | Rep/Lean Rep | 18 | 77 | 4 | 0 |
| US adults | Dem/Lean Dem | 3 | 14 | 37 | 44 |
| US adults | Rep/Lean Rep | 20 | 38 | 27 | 14 |
“Can AI Stand In for Human Survey-Takers? Not Really”


