

In many ways, members of the Church of Jesus Christ of Latter-day Saints are a stable and traditional community. For at least the last four decades, Latter-day Saints (widely known as Mormons) have made up between 1% and 2% of the U.S. adult population. Members of this group have consistently stood out as highly religious and conservative.
Several of Pew Research Center’s surveys dating back to 2007 have found that Latter-day Saints are, on average, among the most religious adults in America.

“Tradition and Change Among Latter-day Saints in the U.S.”
| % | Group | |
|---|---|---|
| All U.S. adults | 38 | 1 |
| Latter-day Saint (Mormon) | 72 | 2 |
| Historically Black Protestant | 71 | 2 |
| Evangelical Protestant | 69 | 2 |
| Muslim | 60 | 2 |
| Catholic | 44 | 2 |
| Orthodox Christian | 43 | 2 |
| Mainline Protestant | 37 | 2 |
| Jewish | 27 | 2 |
| Hindu | 24 | 2 |
| Buddhist | 21 | 2 |
| Religiously unaffiliated | 4 | 2 |
“Tradition and Change Among Latter-day Saints in the U.S.”
For example, about seven-in-ten Latter-day Saints surveyed in the Center’s 2023-24 Religious Landscape Study (RLS) say that religion is very important in their lives. This is roughly on par with evangelical Protestants and members of historically Black Protestant churches – and far higher than the shares of U.S. Catholics (44%), Jews (27%) and Buddhists (21%) who say religion is very important to them.
Latter-day Saints also have remained overwhelmingly attached to the Republican Party over the past several decades. About three-quarters of the church’s members identify as Republican or lean toward the Republican Party, as of 2023-24.1 Previous Center surveys conducted in 2007, 2011 and 2014 also found that Latter-day Saints were, on the whole, among the country’s most politically conservative groups when asked about their ideology.
Amid these signs of stability, however, are indications of change within the church. Center surveys show that since 2007, Latter-day Saints have become:
- More demographically diverse and much less likely to be raising children under 18 at home
- Slightly less religious by some key measures, including daily prayer rates
- Modestly more liberal on some social and political issues, such as homosexuality
The church’s retention rate also has fallen over this time span. About half of Americans who say they were raised as Latter-day Saints still identify as members of the church in adulthood (54%), according to the 2023-24 RLS. That retention rate has steadily declined since 2007, when it stood at 70%.

Note: Figures may not sum to 100% due to rounding.
“Tradition and Change Among Latter-day Saints in the U.S.”
| Latter-day Saint (Mormon) | Protestant | Catholic | Another Christian denomination* | Another religion/No answer | Religiously unaffiliated | |
|---|---|---|---|---|---|---|
| 2007 | 70 | 12 | 2 | <1 | 2 | 14 |
| 2014 | 64 | 10 | 2 | <1 | 3 | 21 |
| 2023-24 | 54 | 11 | 2 | 2 | 4 | 28 |
Note: Figures may not sum to 100% due to rounding.
“Tradition and Change Among Latter-day Saints in the U.S.”
A growing percentage of people who were raised as Latter-day Saints now identify as atheist, agnostic or “nothing in particular.” As of 2023-24, 28% of adults who were raised as Latter-day Saints are religiously unaffiliated – double the figure seen in 2007.
These are among the key findings of a new Pew Research Center study examining the views, beliefs and practices of Latter-day Saints in the United States. This project is based on data from the 2023-24 RLS as well as our previous landscape studies, conducted in 2014 and 2007. We also draw on the Center’s major 2011 survey of Latter-day Saints.
Members of the Church of Jesus Christ of Latter-day Saints are often called Mormons by other people, and for years the church used that term to refer to its members or related institutions, such as the Mormon Tabernacle Choir. However, the church stopped using “Mormon” in 2018 and discourages others from using the term to refer to the church or its followers. In this analysis, we primarily use the church’s full name and refer to members of the faith as “Latter-day Saints.” We include limited references to the term “Mormon” in parentheses for readers who are unfamiliar with the full name of the church or the term “Latter-day Saints.”2
How have Latter-Day Saints changed demographically?
While most Latter-day Saints today are White, the church’s members have grown more racially and ethnically diverse in recent decades. The portion of Latter-day Saints who are White has fallen from 85% in 2007 to 72% in 2023-24. Hispanic adults have doubled in share – from 6% to 12% – over this time span, while the percentage of Latter-day Saints who are Black has grown from 2% to 6%.
| 2007 | 2011 | 2014 | 2023-24 | |
|---|---|---|---|---|
| White | 85 | 87 | 84 | 72 |
| Hispanic | 6 | 7 | 8 | 12 |
| Black | 2 | 1 | 1 | 6 |
| Asian* | 1 | 1 | 1 | 1 |
| Other/Multiracial | 3 | 4 | 5 | 7 |
| First generation (born outside U.S.)** | 7 | 5 | 7 | 11 |
| Second generation (born in U.S., at least 1 parent born outside U.S.) | 5 | 6 | 7 | 9 |
| Third+ generation (born in U.S., both parents born in U.S.) | 87 | 89 | 85 | 79 |
| Have children under 18 at home | 49 | — | 41 | 37 |
| Have at least a bachelor’s degree | 29 | 31 | 33 | 36 |
** Estimates for respondents born outside the U.S. are representative only of English and Spanish speakers.
Note: White, Black and Asian respondents include those who report being only one race and are not Hispanic. Hispanics are of any race. Those who did not answer are not shown. Dashes indicate the question was not asked in that survey. The three older surveys were conducted by telephone, but the 2023-24 Religious Landscape Study (RLS) was completed mainly online and on paper. This “mode shift” affects the results of some survey questions. Analysis of an experimental telephone survey conducted alongside the 2023-24 RLS indicates that it is safe to make the comparisons shown here. Refer to Appendix A of the 2023-24 RLS for more details.
“Tradition and Change Among Latter-day Saints in the U.S.”
These changes are driven at least in part by converts to the faith, who are more racially and ethnically diverse than lifelong members of the church.
There also has been a slight decrease in the share of Latter-day Saints who are at least third-generation Americans, meaning both they and their parents were born in the U.S. Today, 79% of church members fit this description, compared with 87% in 2007.3
The overall age profile of church members also has slightly shifted. Since 2007, the median age among Latter-day Saint adults has risen from 41 to 44 years. (The median age of U.S. Christian adults overall has risen more sharply, from 46 to 54.) And a smaller share of Latter-day Saints are parents of children under 18 today than in 2007 (37% vs. 49%).4
Today, the share of Latter-day Saints with a bachelor’s degree stands at 36%. In recent years, Latter-day Saint women have become much more likely to hold a bachelor’s degree (25% in 2007 vs. 40% today). Meanwhile, the percentage of Latter-day Saint men with at least a bachelor’s degree has held steady over this period at roughly one-third.
For more about Latter-day Saint families, read our related analysis, “Latter-day Saints: Happy in their family lives, traditional in gender roles.”
Regional distribution of Latter-day Saints
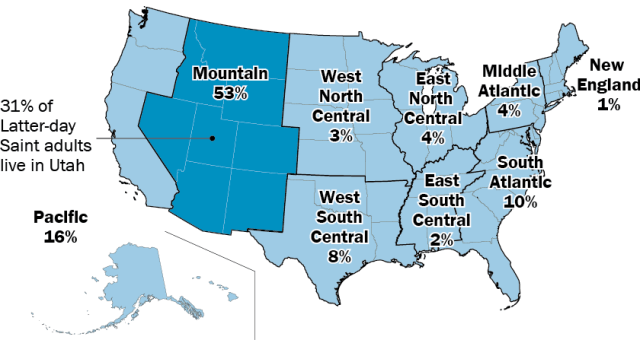
In 1847, fleeing persecution, members of the Church of Jesus Christ of Latter-day Saints began settling in the Salt Lake Valley, in present-day Utah. In the following decades, the church sent its members to settle the broader region.
“Tradition and Change Among Latter-day Saints in the U.S.”
| % living in each region | |
|---|---|
| Pacific | 16 |
| Mountain | 53 |
| West North Central | 3 |
| East North Central | 4 |
| West South Central | 8 |
| East South Central | 2 |
| South Atlantic | 10 |
| Middle Atlantic | 4 |
| New England | 1 |
“Tradition and Change Among Latter-day Saints in the U.S.”
The echoes of those early settlement patterns are still visible in the distribution of church members throughout the United States. According to our 2023-24 RLS, about half of Latter-day Saint adults live in the eight states of the Mountain region, stretching from Montana to New Mexico.5 The percentage of Latter-day Saints living in the Mountain region has remained fairly stable since our 2007 RLS. Within the Mountain region, Utah stands out: 31% of the country’s Latter-day Saints live in Utah alone.
This is a remarkably high concentration of church members, as only 8% of Americans live in the Mountain region and just 1% of Americans live in Utah.
Latter-day Saints living in the Mountain region are more likely to be members of a congregation than those who live elsewhere (93% vs. 78%).6 And by a variety of measures, this geographically concentrated group tends to be somewhat more religious or spiritual than Latter-day Saints in other parts of the U.S.
Have Latter-day Saints become less religious?
While Latter-day Saints are among the most religious Americans, they appear to have grown less religious by some measures over the last few decades.7
For example, compared with 2007, Latter-day Saints are now:
- 14 percentage points less likely to say they believe in God or a universal spirit with absolute certainty
- 11 points less likely to say religion is very important in their lives
- 9 points less likely to say they pray daily
| 2007 | 2011 | 2014 | 2023-24 | |
|---|---|---|---|---|
| They believe in God or a universal spirit with absolute certainty | 90 | — | 86 | 76 |
| Religion is very important in their lives | 83 | 82 | 84 | 72 |
| They pray daily | 82 | 83 | 85 | 73 |
“Tradition and Change Among Latter-day Saints in the U.S.”
This generally aligns with a decades-long, nationwide pattern in which Americans, on the whole, have become less religious. For instance, 58% of Americans said in the 2007 RLS that they prayed daily. By the 2023-24 RLS, that share had dropped to 44%. This pattern is not simply a result of growth among the country’s religiously unaffiliated population: Christians were more likely to report praying daily in 2007 than they are now (66% vs. 60%).
However, in recent years – beginning around 2020 – religion has shown signs of relative stability in the U.S. For example, the percentage of U.S. adults who pray daily, as well as the share who say they attend religious services monthly, have held fairly steady in our annual National Public Opinion Reference Surveys (NPORS) from 2020 through 2025.
Unlike the massive RLS project, most of our surveys do not have large enough samples of Latter-day Saints to report their responses separately, given that they make up only 2% of the U.S. adult population. As a result, we do not have sufficient data to determine whether religiousness among Latter-day Saints – like religion among Americans as a whole – has stabilized in the last few years.
For more on the religious beliefs and practices of members of the Church of Jesus Christ of Latter-day Saints today, read our accompanying analysis, “Latter-day Saints are highly religious, though not uniformly so.”
Have Latter-day Saints’ views on social issues changed in recent years?
Latter-day Saints still have more conservative views than members of many other U.S. religious groups, but their attitudes on some social and political issues appear to have changed over time.
“Tradition and Change Among Latter-day Saints in the U.S.”
| Year | Homosexuality should be accepted by society | More women in the workforce is a change for the better | Abortion should be legal in all/most cases |
|---|---|---|---|
| 2007 | 24 | — | 27 |
| 2011 | 26 | — | — |
| 2014 | 36 | 49 | 27 |
| 2023-24 | 46 | 61 | 31 |
“Tradition and Change Among Latter-day Saints in the U.S.”
For instance, majorities of adults in most U.S. religious groups say homosexuality should be accepted by society – a position taken by fewer Latter-day Saints (46%). Among the religious groups analyzed in the 2023-24 RLS, only evangelical Protestants are less likely than Latter-day Saints to say homosexuality should be accepted. Yet the share of Latter-day Saints who say homosexuality should be socially accepted has nearly doubled since 2007, when it was 24%.8
Likewise, a growing percentage of church members say that having more women in the workforce is a change for the better.
These shifts have taken place even though a majority of Latter-day Saints have remained connected to the Republican Party. While the percentages who identify with the two main political parties in the 2023-24 RLS are not directly comparable to the 2007 and 2014 RLS findings for methodological reasons, in all three of our landscape studies most Latter-day Saints have identified with, or leaned toward, the GOP.
However, Latter-day Saints’ views have not changed on all issues. For example, church members’ support for legal abortion has remained largely unchanged since 2007, even as Americans overall have become somewhat more likely to say that abortion should be legal in all or most cases.
For more on political and social views among members of the Church of Jesus Christ of Latter-day Saints, read our accompanying analysis, “Latter-day Saints largely identify as Republican but stand out from their partisan peers on diversity issues.”
This analysis is part of a larger project exploring the views, beliefs and religious practices of members of the Church of Jesus Christ of Latter-day Saints. Other parts of the project explore:


