
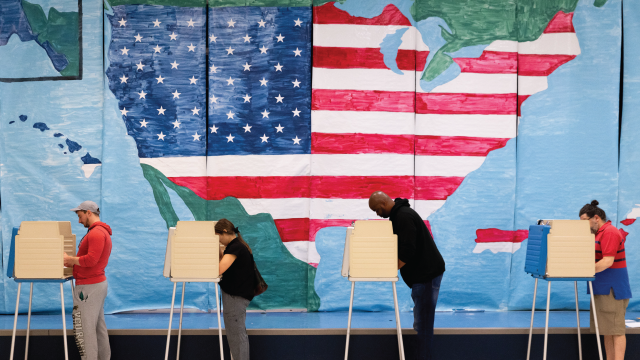
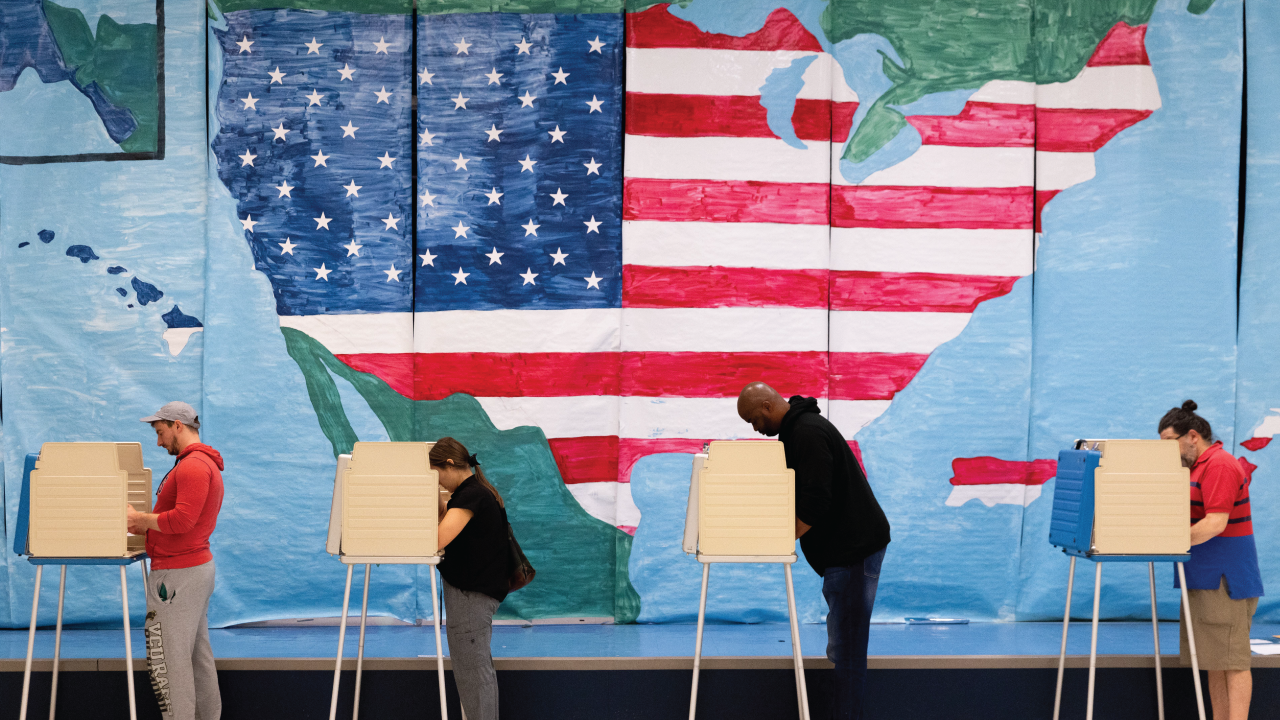
Roughly 250 million adult U.S. citizens are eligible to vote in the 2026 midterm elections.
White Americans make up the majority of these eligible voters (61%), but their share has fallen markedly since 2006. Meanwhile, Hispanic (16%) and Asian (5%) eligible voters’ shares have almost doubled in the past 20 years. The share of Black eligible voters (12%) has changed little over the same period.
“The U.S. Electorate’s Changing Racial and Ethnic Makeup”
| Year | White | Hispanic | Black | Asian |
|---|---|---|---|---|
| 2006 | 74 | 9 | 12 | 3 |
| 2008 | 73 | 9 | 12 | 3 |
| 2010 | 72 | 10 | 12 | 4 |
| 2012 | 71 | 11 | 12 | 4 |
| 2014 | 70 | 11 | 12 | 4 |
| 2016 | 69 | 12 | 12 | 4 |
| 2018 | 67 | 13 | 13 | 4 |
| 2020 | 65 | 14 | 12 | 4 |
| 2022 | 64 | 14 | 12 | 5 |
| 2024 | 63 | 15 | 12 | 5 |
| 2026 | 61 | 16 | 12 | 5 |
“The U.S. Electorate’s Changing Racial and Ethnic Makeup”
(In this report, White, Black and Asian adults are those who report being only one race and are not Hispanic. Hispanic adults are of any race.1)
With the 2026 midterm elections approaching, here is a look at the racial and ethnic composition of the U.S. electorate. National counts of eligible voters for 2026 are Pew Research Center projections, based on Census Bureau estimates. State-level counts and demographic characteristics are based on 2024 American Community Survey data, the most recent detailed figures available.
Pew Research Center has previously published data about the ways that political preferences and voting patterns differ by race and ethnicity. For details, refer to recent publications covering partisan identification trends since 2020; voting patterns in the 2022 midterms; voting patterns in the 2024 presidential election; and 2026 midterm voting intentions.
Who are eligible voters?
Pew Research Center defines eligible voters as U.S. citizens ages 18 and older who live in the 50 states or the District of Columbia. Our estimates do not account for relatively small groups who have lost their voting rights (such as people convicted of felonies) or U.S. citizens living abroad.
Registered voters are a subset of eligible voters – U.S. citizens who are registered to vote. Voters are an even narrower group – registered voters who have cast ballots in a given election. This report focuses on eligible voters, regardless of whether they are registered to vote or have voted.
Jump to the following for more about:
- Growth and diversity of the U.S. electorate
- State-level changes in the electorate’s racial and ethnic makeup
- Why race and ethnicity in the electorate don’t mirror the U.S. population
- Demographic characteristics of eligible voters by race and ethnicity
The U.S. electorate has grown and become more diverse since 2022
Since the 2022 midterm elections, the number of U.S. eligible voters has increased by 8.4 million to around 250 million (up 3%).
More than half of this growth came from Hispanics, who added 5.2 million eligible voters between 2022 and 2026 to reach 39.0 million (up 16%). Hispanic eligible voters are now the second-largest group after White voters. (Hispanic eligible voters surpassed Black eligible voters for the first time in 2018.)
Note: Eligible voters are U.S. citizens ages 18 and older. White, Black and Asian eligible voters are those who report only being one race and are not Hispanic; Hispanics are of any race. Estimates are rounded to the nearest 50,000. Percentages and changes are calculated from unrounded numbers. Subtotals do not add up to totals because eligible voters who gave other answers, including those who chose more than one race, are not shown.
“The U.S. Electorate’s Changing Racial and Ethnic Makeup”
| 2026 | Change 2022-26 | % change, 2022-26 | Group | |
|---|---|---|---|---|
| White | 153,000,000 | -2,600,000 | -2% | Race |
| Hispanic | 38,950,000 | 5,250,000 | 16% | Race |
| Black | 30,650,000 | 1,650,000 | 6% | Race |
| Asian | 13,650,000 | 2,250,000 | 20% | Race |
| All U.S. eligible voters | 249,750,000 | 8,450,000 | 3% | Total |
Note: Eligible voters are U.S. citizens ages 18 and older. White, Black and Asian eligible voters are those who report only being one race and are not Hispanic; Hispanics are of any race. Estimates are rounded to the nearest 50,000. Percentages and changes are calculated from unrounded numbers. Subtotals do not add up to totals because eligible voters who gave other answers, including those who chose more than one race, are not shown.
“The U.S. Electorate’s Changing Racial and Ethnic Makeup”
The Hispanic electorate’s growth primarily stems from U.S.-born Hispanics reaching adulthood. Annually, around 1 million U.S.-born Hispanics become adults. The more than 4 million Hispanics who turned 18 between 2022 and 2026 accounted for about 80% of the growth among Hispanic eligible voters during those years. In addition, roughly 1 million Hispanic adults became naturalized citizens in the last four years.2
The number of Asian voters also rose sharply between 2022 and 2026, by 2.3 million, to reach 13.7 million. That’s a growth rate of around 20%, making Asian Americans the fastest-growing racial or ethnic group of eligible voters. The increase is about equally due to immigrants becoming naturalized citizens and U.S.-born Asians reaching voting age.
The number of Black voters increased more slowly over the same period, growing by 1.6 million (6%) to 31 million.
By contrast, the number of White eligible voters fell by 2.6 million between 2022 and 2026, to 153 million (down 2%). This is the only racial or ethnic group with a falling number of eligible voters. The decline is largely due to the group’s age structure, as deaths in the White population exceed the number of people turning 18 and being naturalized each year.
State-level changes in the electorate’s racial makeup since 2006
Twenty years ago, the U.S. electorate was 74% White, 12% Black, 9% Hispanic and 3% Asian. At the time, White Americans made up the majority of all eligible voters in 48 states. They accounted for half of the electorate in New Mexico (50%) and less than half in the District of Columbia (37%) and Hawaii (28%).
As of 2024, a majority of eligible voters are White in 46 states. White eligible voters account for less than half of the electorate in Texas (46%), the District of Columbia (42%), New Mexico (41%), California (40%) and Hawaii (24%). Still, in Texas and California, they are the largest racial or ethnic group. In D.C., they are about on par with the Black eligible voter population, while in New Mexico, they’re roughly on par with the Hispanic eligible voter population. In Hawaii, White eligible voters are the second-largest group after Asians.
(This section spans 2006 through 2024, the most recent year for which state-level data about the electorate’s racial and ethnic makeup is available. Refer to “Key terms” for how we report on racial and ethnic groups.)
The nationwide decline in the White share of the electorate is playing out to varying degrees across the country, with some states experiencing particularly significant shifts.
Between 2006 and 2024, a total of 16 states saw declines of 10 percentage points or more in the share of all eligible voters who are White. In Nevada, the White share of the electorate fell 20 points, the largest drop among all 50 states. California also had a sharp decline in the White share of the electorate, dropping 16 points in that period.
The District of Columbia is the only place where White voters rose as a share of all eligible voters, increasing 4 percentage points.
As reflected at the national level, Hispanic eligible voters have been the primary drivers of the racial and ethnic diversification of most states’ electorates. Their share increased by 10 percentage points in California and Nevada between 2006 and 2024.
“The U.S. Electorate’s Changing Racial and Ethnic Makeup”
| Name | FIPS | White | Hispanic | Black | Asian |
|---|---|---|---|---|---|
| Alabama | 1 | 66.9 | 3.2 | 25.1 | 1.0 |
| Alaska | 2 | 62.1 | 6.5 | 3.1 | 4.8 |
| Arizona | 4 | 59.2 | 25.4 | 4.3 | 3.0 |
| Arkansas | 5 | 72.3 | 5.4 | 14.0 | 1.1 |
| California | 6 | 40.1 | 33.0 | 6.0 | 15.4 |
| Colorado | 8 | 70.7 | 17.5 | 3.7 | 2.9 |
| Connecticut | 9 | 67.9 | 14.3 | 9.9 | 3.4 |
| Delaware | 10 | 63.8 | 7.2 | 21.1 | 3.5 |
| District of Columbia | 11 | 41.7 | 8.0 | 40.9 | 4.3 |
| Florida | 12 | 56.9 | 22.6 | 13.8 | 2.7 |
| Georgia | 13 | 53.9 | 6.7 | 31.5 | 3.6 |
| Hawaii | 15 | 23.8 | 8.6 | 1.8 | 37.3 |
| Idaho | 16 | 82.9 | 9.9 | 0.5 | 1.2 |
| Illinois | 17 | 63.6 | 14.0 | 13.8 | 5.2 |
| Indiana | 18 | 80.3 | 5.5 | 8.3 | 1.7 |
| Iowa | 19 | 87.0 | 4.6 | 3.1 | 1.6 |
| Kansas | 20 | 78.1 | 9.4 | 5.1 | 2.2 |
| Kentucky | 21 | 85.0 | 2.8 | 6.6 | 1.2 |
| Louisiana | 22 | 59.4 | 4.5 | 30.7 | 1.4 |
| Maine | 23 | 91.7 | 1.6 | 0.9 | 1.0 |
| Maryland | 24 | 51.8 | 7.5 | 30.0 | 5.8 |
| Massachusetts | 25 | 73.5 | 9.9 | 5.7 | 5.9 |
| Michigan | 26 | 75.8 | 4.3 | 12.6 | 2.5 |
| Minnesota | 27 | 81.1 | 4.0 | 6.0 | 4.2 |
| Mississippi | 28 | 57.9 | 2.2 | 35.8 | 0.9 |
| Missouri | 29 | 80.0 | 3.8 | 10.0 | 1.6 |
| Montana | 30 | 85.5 | 4.0 | 0.3 | 0.6 |
| Nebraska | 31 | 82.3 | 7.6 | 3.7 | 2.0 |
| Nevada | 32 | 51.6 | 22.2 | 9.4 | 9.2 |
| New Hampshire | 33 | 89.2 | 4.0 | 1.2 | 2.0 |
| New Jersey | 34 | 58.0 | 17.2 | 12.8 | 8.4 |
| New Mexico | 35 | 40.8 | 43.3 | 1.9 | 1.5 |
| New York | 36 | 58.6 | 15.7 | 13.4 | 7.8 |
| North Carolina | 37 | 65.7 | 6.6 | 20.3 | 2.5 |
| North Dakota | 38 | 84.8 | 3.7 | 2.4 | 1.0 |
| Ohio | 39 | 79.1 | 3.6 | 11.3 | 1.8 |
| Oklahoma | 40 | 67.6 | 8.3 | 6.8 | 2.0 |
| Oregon | 41 | 76.8 | 10.6 | 1.7 | 4.0 |
| Pennsylvania | 42 | 76.9 | 6.8 | 9.7 | 3.1 |
| Rhode Island | 44 | 74.7 | 12.5 | 4.0 | 3.1 |
| South Carolina | 45 | 66.2 | 4.7 | 23.6 | 1.5 |
| South Dakota | 46 | 84.0 | 2.8 | 1.8 | 1.2 |
| Tennessee | 47 | 75.8 | 3.9 | 14.8 | 1.5 |
| Texas | 48 | 45.9 | 32.3 | 13.1 | 4.9 |
| Utah | 49 | 80.5 | 10.9 | 0.9 | 2.3 |
| Vermont | 50 | 90.7 | 2.3 | 0.7 | 1.6 |
| Virginia | 51 | 63.1 | 7.5 | 18.7 | 6.0 |
| Washington | 53 | 70.0 | 9.9 | 3.8 | 8.3 |
| West Virginia | 54 | 90.6 | 1.6 | 3.2 | 0.5 |
| Wisconsin | 55 | 83.2 | 5.3 | 5.2 | 2.3 |
| Wyoming | 56 | 83.4 | 9.3 | 0.8 | 0.4 |
“The U.S. Electorate’s Changing Racial and Ethnic Makeup”
Hispanics do not form a majority in any state, but they are the largest racial or ethnic group in New Mexico’s electorate, where they make up 43% of eligible voters. They represent a quarter or more in California (33%), Texas (32%) and Arizona (25%). Their shares are smallest in Vermont, Mississippi, Maine and West Virginia, accounting for 2% of the electorate in each of those states.
“The U.S. Electorate’s Changing Racial and Ethnic Makeup”
| Top states for White eligible voters | % of EVs who are White |
|---|---|
| Maine | 92 |
| Vermont | 91 |
| West Virginia | 91 |
| New Hampshire | 89 |
| Iowa | 87 |
| Top states for Hispanic eligible voters | % of EVs who are Hispanic |
| New Mexico | 43 |
| California | 33 |
| Texas | 32 |
| Arizona | 25 |
| Florida | 23 |
| Top states for Black eligible voters | % of EVs who are Black |
| District of Columbia | 41 |
| Mississippi | 36 |
| Georgia | 31 |
| Louisiana | 31 |
| Maryland | 30 |
| Top states for Asian eligible voters | % of EVs who are Asian |
| Hawaii | 37 |
| California | 15 |
| Nevada | 9 |
| New Jersey | 8 |
| Washington | 8 |
“The U.S. Electorate’s Changing Racial and Ethnic Makeup”
Black eligible voters do not make up the largest racial or ethnic share of any state’s electorate, but they represent three-in-ten or more in the District of Columbia (41%), Mississippi (36%), Georgia (31%), Louisiana (31%) and Maryland (30%). They are 1% or less of the electorate in New Hampshire, Maine, Utah, Wyoming, Vermont, Idaho and Montana.
Asian eligible voters make up 37% of Hawaii’s electorate – that state’s biggest racial or ethnic share, and the highest Asian share of any state. California comes second, with 15%. In all other places, their share is under 10%, including 40 states and D.C. where they represent less than 5% of the electorate.
“The U.S. Electorate’s Changing Racial and Ethnic Makeup”
| Top states for White eligible voters | White EVs, in millions |
|---|---|
| California | 10.6 |
| Florida | 9.5 |
| Texas | 9.5 |
| New York | 8.3 |
| Pennsylvania | 7.7 |
| Top states for Hispanic eligible voters | Hispanic EVs, in millions |
| California | 8.7 |
| Texas | 6.7 |
| Florida | 3.8 |
| New York | 2.2 |
| Arizona | 1.4 |
| Top states for Black eligible voters | Black EVs, in millions |
| Texas | 2.7 |
| Georgia | 2.5 |
| Florida | 2.3 |
| New York | 1.9 |
| North Carolina | 1.7 |
| Top states for Asian eligible voters | Asian EVs, in millions |
| California | 4.1 |
| New York | 1.1 |
| Texas | 1.0 |
| New Jersey | 0.6 |
| Washington | 0.5 |
“The U.S. Electorate’s Changing Racial and Ethnic Makeup”
Why the electorate’s racial and ethnic makeup does not mirror the overall U.S. population
Population growth does not immediately or automatically translate into growth of the electorate, as only U.S. citizens ages 18 and older are eligible to vote. As a result, groups can make up different shares of the electorate than they do of the nation’s population.
A large majority of the White population is eligible to vote (81%), followed by smaller shares of the Black (74%), Asian (60%) and Hispanic (52%) populations.
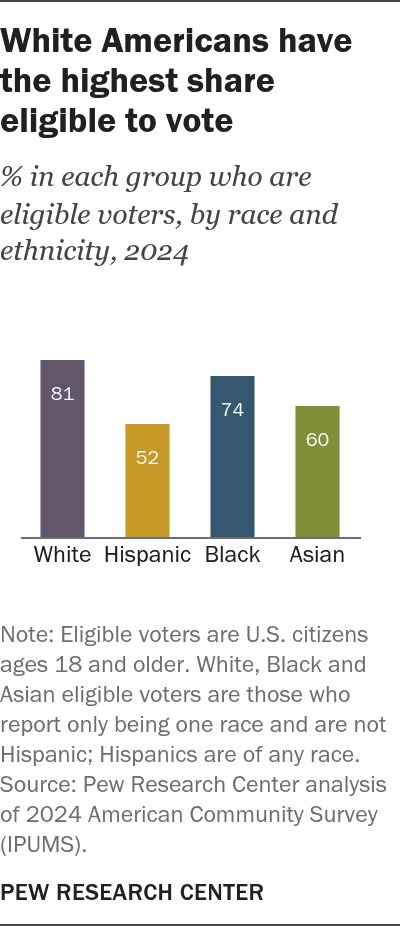
| 2024 | |
|---|---|
| White | 81 |
| Hispanic | 52 |
| Black | 74 |
| Asian | 60 |
Each of these percentages grew between 2006 and 2024, with the Hispanic population’s figure increasing the most (12 percentage points), followed by Asian (9 points), Black (6 points) and White Americans (4 points).
(The latest figures in this section are for 2024, the most recent year for which detailed population data is available. Refer to “Key terms” for how we report on racial and ethnic groups.)
The share of each population eligible to vote depends largely on two factors – the group’s age distribution and citizenship rate.
- Very small shares of White (1%) and Black Americans (4%) are noncitizens. Hispanics (21%) and Asians (25%) have much larger shares of noncitizens.
- Relatively small shares of White and Asian Americans are under 18 (18% each). Hispanic and Black Americans have larger shares of people in that age group (29% and 23%, respectively).
Demographic characteristics of eligible voters by race and ethnicity
Here’s a closer look at the demographic characteristics of eligible voters in each racial and ethnic group.
| All U.S. eligible voters | White | Hispanic | Black | Asian | |
|---|---|---|---|---|---|
| Gender | |||||
| Men | 49% | 49% | 49% | 47% | 47% |
| Women | 51 | 51 | 51 | 53 | 53 |
| Nativity | |||||
| U.S. born | 90 | 97 | 77 | 91 | 35 |
| Naturalized | 10 | 3 | 23 | 9 | 65 |
| Educational attainment | |||||
| Less than high school diploma | 8 | 6 | 17 | 11 | 10 |
| High school diploma | 27 | 26 | 31 | 32 | 15 |
| Some college | 30 | 29 | 31 | 32 | 22 |
| Bachelor’s degree | 22 | 24 | 15 | 15 | 32 |
| Postgraduate degree | 13 | 15 | 7 | 10 | 22 |
| Age | |||||
| 18-29 | 20 | 17 | 30 | 22 | 19 |
| 30-49 | 32 | 30 | 36 | 36 | 36 |
| 50-64 | 23 | 24 | 20 | 23 | 24 |
| 65+ | 24 | 28 | 14 | 19 | 21 |
| Median age (years)* | 48 | 52 | 39 | 45 | 47 |
Note: Eligible voters are U.S. citizens ages 18 and older. White, Black and Asian eligible voters are those who report only being one race and are not Hispanic; Hispanics are of any race. Eligible voters of other races and ethnicities, including those who chose more than one race, are included in the “All U.S. eligible voters” column but are not shown separately.
“The U.S. Electorate’s Changing Racial and Ethnic Makeup”
Age
On average, White eligible voters are the oldest group, with a median age of 52. Hispanic eligible voters are the youngest, with a median age of 39. Similarly, White eligible voters include the largest share of those ages 65 and older (28%), which is double the share of Hispanic eligible voters in the same age group (14%).
In contrast, Hispanic eligible voters have the largest share of adults under age 30 (30%), followed by Black (22%), Asian (19%) and White (17%) eligible voters.
Nativity
The vast majority of White eligible voters (97%) and Black eligible voters (91%) are U.S. born. A majority of Hispanic eligible voters also are U.S. born (77%). In contrast, most Asian eligible voters are naturalized citizens, while 35% are U.S. born.
Education
Compared with White and Asian eligible voters, Hispanic and Black eligible voters have lower levels of educational attainment. Similar shares of Hispanic (47%) and Black eligible voters (43%) have a high school diploma or less education – including 17% of Hispanic eligible voters who have not graduated from high school. White and Asian eligible voters have larger shares of adults with a bachelor’s degree or higher (38% and 54%, respectively), including 22% of Asian eligible voters who have a postgraduate degree.


