Pew Research Center conducted this analysis to understand the rich diversity of people of Asian origin or ancestry living in the United States and their views of identity. The study is part of the Center’s multiyear, comprehensive, in-depth quantitative and qualitative research effort focused on the nation’s Asian population. Its centerpiece is this nationally representative survey of 7,006 Asian adults exploring the experiences, attitudes and views of Asians living in the U.S. The survey sampled U.S. adults who self-identify as Asian, either alone or in combination with other races or Hispanic ethnicity. It was offered in six languages: Chinese (Simplified and Traditional), English, Hindi, Korean, Tagalog and Vietnamese. Responses were collected from July 5, 2022, to Jan. 27, 2023, by Westat on behalf of Pew Research Center.
The Center recruited a large sample to examine the diversity of the U.S. Asian population, with oversamples of the Chinese, Filipino, Indian, Korean and Vietnamese populations. These are the five largest origin groups among Asian Americans. The survey also includes a large enough sample of self-identified Japanese adults, making findings about them reportable. In this report, the six largest ethnic groups include those who identify with one Asian ethnicity only, either alone or in combination with a non-Asian race or ethnicity. Together, these six groups constitute 81% of all U.S. Asian adults, according to a Pew Research Center analysis of the Census Bureau’s 2021 American Community Survey (ACS), and are the six groups whose attitudes and opinions are highlighted throughout the report. Survey respondents were drawn from a national sample of residential mailing addresses, which included addresses from all 50 states and the District of Columbia. Specialized surnames list frames maintained by the Marketing Systems Group were used to supplement the sample. Those eligible to complete the survey were offered the opportunity to do so online or by mail with a paper questionnaire. For more details, see the Methodology. For questions used in this analysis, see the Topline Questionnaire.
The survey research plan and questionnaire were reviewed and approved by Westat’s institutional review board (IRB), which is an external and independent committee of experts specializing in protecting the rights of research participants.
Even though the U.S. Asian population was the fastest growing racial and ethnic group in the country from 2000 to 2019, it is still a relatively small population. According to the 2021 American Community Survey, the country’s Asian population constitutes 7% of the U.S. population (of all ages) and 7% of adults (those ages 18 and older).
Pew Research Center designed this study with these details in mind to be as inclusive as possible of the diversity of Asian American experiences. Even so, survey research is limited when it comes to documenting the views and attitudes of the less populous Asian origin groups in the U.S. To address this, the survey was complemented by 66 pre-survey focus groups of Asian adults, conducted from Aug. 4 to Oct. 14, 2021, with 264 recruited participants from 18 Asian origin groups. Focus group discussions were conducted in 18 different languages and moderated by members of their origin groups.
Findings for less populous Asian origin groups in the U.S., those who are not among the six largest Asian origin groups, are grouped under the category “Other” in this report and are included in the overall Asian adult findings in the report. These ethnic origin groups each make up about 2% or less of the Asian population in the U.S., making it challenging to recruit nationally representative samples for each origin group. The group “Other” includes those who identify with one Asian ethnicity only, either alone or in combination with a non-Asian race or Hispanic ethnicity. Findings for those who identify with two or more Asian ethnicities are not presented by themselves in this report but are included in the overall Asian adult findings.
To learn more about how members of less populous Asian origin groups in the U.S. identify, see the quote sorter based on our focus group discussions. There, you can read how participants describe their identity in their own words.
For this analysis, an additional national survey of 5,132 U.S. adults was conducted from Dec. 5 to 11, 2022, using Pew Research Center’s American Trends Panel. The survey of U.S. adults was conducted in English and Spanish. Respondents are recruited through national, random sampling of residential addresses.
Pew Research Center has conducted multiple studies that focus on Asian Americans. Previous demographic studies examined the diversity of origins, key facts, and rising income inequality among Asians living in the U.S. and key findings about U.S. immigrants. Qualitative studies have focused on what it means to be Asian in America as well as barriers to English language learning among Asian immigrants. Previous surveys have focused on concerns over discrimination and violence against Asian Americans, as well as studies about their religious beliefs. Find these publications and more on the Center’s Asian Americans topic page.
Pew Research Center is a subsidiary of The Pew Charitable Trusts, its primary funder. The Center’s Asian American portfolio was funded by The Pew Charitable Trusts, with generous support from The Asian American Foundation; Chan Zuckerberg Initiative DAF, an advised fund of the Silicon Valley Community Foundation; the Robert Wood Johnson Foundation; the Henry Luce Foundation; the Doris Duke Foundation; The Wallace H. Coulter Foundation; The Dirk and Charlene Kabcenell Foundation; The Long Family Foundation; Lu-Hebert Fund; Gee Family Foundation; Joseph Cotchett; the Julian Abdey and Sabrina Moyle Charitable Fund; and Nanci Nishimura.
We would also like to thank the Leaders Forum for its thought leadership and valuable assistance in helping make this survey possible.
The strategic communications campaign used to promote the research was made possible with generous support from the Doris Duke Foundation.
The terms Asian, Asians living in the United States, U.S. Asian population and Asian Americans are used interchangeably throughout this report to refer to U.S. adults who self-identify as Asian, either alone or in combination with other races or Hispanic identity.
Ethnicity and ethnic origin labels, such as Chinese and Chinese origin, are used interchangeably in this report for findings for ethnic origin groups, such as Chinese, Filipino, Indian, Japanese, Korean or Vietnamese. For this report, ethnicity is not nationality. For example, Chinese in this report are those self-identifying as of Chinese ethnicity, rather than necessarily being a current or former citizen of the People’s Republic of China. Ethnic origin groups in this report include those who self-identify as one Asian ethnicity only, either alone or in combination with a non-Asian race or ethnicity.
Less populous Asian origin groups in this report are those who self-identify with ethnic origin groups that are not among the six largest Asian origin groups. The term includes those who identify with only one Asian ethnicity. These ethnic origin groups each represent about 2% or less of the overall Asian population in the U.S. For example, those who identify as Burmese, Hmong or Pakistani are included in this category. These groups are unreportable on their own due to small sample sizes, but collectively they are reportable under this category.
The terms Asian origins and Asian origin groups are used interchangeably throughout this report to describe ethnic origin groups.
Immigrants in this report are people who were not U.S. citizens at birth – in other words, those born outside the U.S., Puerto Rico or other U.S. territories to parents who are not U.S. citizens. Immigrant, first generation and foreign born are used interchangeably to refer to this group.
Naturalized citizens are immigrants who are lawful permanent residents who have fulfilled the length of stay and other requirements to become U.S. citizens and who have taken the oath of citizenship.
U.S. born refers to people born in the 50 U.S. states or the District of Columbia, Puerto Rico or other U.S. territories.
Second generation refers to people born in the 50 states or the District of Columbia, Puerto Rico or other U.S. territories with at least one first-generation (immigrant) parent.
Third or higher generation refers to people born in the 50 states or the District of Columbia, Puerto Rico or other U.S. territories with both parents born in the 50 states, D.C., Puerto Rico or other U.S. territories.
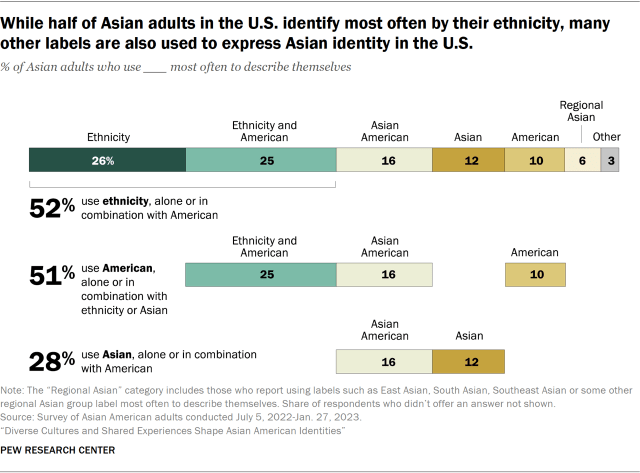
The nation’s Asian population is fast growing and diverse. Numbering more than 23 million, the population has ancestral roots across the vast, ethnically and culturally rich Asian continent. For Asians living in the United States, this diversity is reflected in how they describe their own identity. According to a new, nationwide, comprehensive survey of Asian adults living in the U.S., 52% say they most often use ethnic labels that reflect their heritage and family roots, either alone or together with “American,” to describe themselves. Chinese or Chinese American, Filipino or Filipino American, and Indian or Indian American are examples of these variations.
There are other ways in which Asians living in the U.S. describe their identity. About half (51%) of Asian adults say they use American on its own (10%), together with their ethnicity (25%) or together with “Asian” as Asian American (16%) when describing their identity, highlighting their links to the U.S.
And while pan-ethnic labels such as Asian and Asian American are commonly used to describe this diverse population broadly, the new survey shows that when describing themselves, just 28% use the label Asian (12%) on its own or the label Asian American (16%).
The survey also finds that other labels are used by Asian Americans. Some 6% say they most often prefer regional terms such as South Asian and Southeast Asian when describing themselves.
Asian adults see more cultural differences than commonalities across their group as well. When asked to choose between two statements – that Asians in the U.S. share a common culture, or that Asians in the U.S. have many different cultures – nearly all (90%) say U.S. Asians have many different cultures. Just 9% say Asians living in the U.S. share a common culture. This view is widely held across many demographic groups among Asian Americans, according to the survey.
The view that Asian Americans have many different cultures is also one held by the general public, according to another Pew Research Center survey of U.S. adults, conducted in December 2022. Among all U.S. adults, 80% say Asians in the U.S. have many different cultures, while 18% say they share a common culture.1
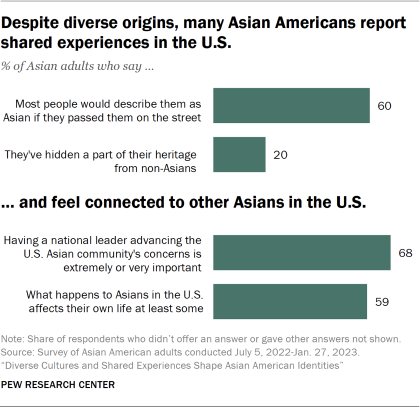
Though Asian Americans’ identities reflect their diverse cultures and origins, Asian adults also report certain shared experiences. A majority (60%) say most people would describe them as “Asian” while walking past them on the street, indicating most Asian adults feel they are seen by others as a single group, despite the population’s diversity. One-in-five say they have hidden a part of their heritage (their ethnic food, cultural practices, ethnic clothing or religious practices) from others who are not Asian, in some cases out of fear of embarrassment or discrimination. Notably, Asian adults ages 18 to 29 are more likely to say they have done this than Asians 65 and older (39% vs. 5%).
Asian adults in the U.S. also feel connected with other Asian Americans. About six-in-ten (59%) say that what happens to Asians in the U.S. affects their own lives, at least to some extent.2 And about two-thirds (68%) of Asian Americans say it is extremely or very important to have a national leader advocating for the concerns and needs of the Asian population in the U.S.
The new survey also shows that large majorities of Asian adults share similar views on what it takes to be considered truly American. And they consider many of the same factors to be important in their views of the American dream.
These are among the key findings from Pew Research Center’s new survey of Asian American adults, conducted by mail and online from July 5, 2022, to Jan. 27, 2023. This is the largest nationally representative survey of its kind to date that focused on Asian Americans. The survey was conducted in English and five Asian languages, among a representative sample of 7,006 Asian adults living in the United States.
Asian Americans are 7% of the U.S. population, according to a Pew Research Center analysis of the 2021 American Community Survey. Their population is diverse, with roots in more than 20 countries in East Asia, Southeast Asia and the Indian subcontinent. About 54% of the national Asian population are immigrants. The six largest origin groups (Chinese, Filipino, Indian, Japanese, Korean and Vietnamese), a focus of this survey and report, together account for 79% of all Asian Americans.
Overall, about 34% of Asian Americans are the U.S.-born children of immigrant parents, and another 14% are of third or higher generation (meaning their parents were born in the U.S. as well), according to a Pew Research Center analysis of the 2022 Current Population Survey, March Annual Social and Economic Supplement.
This survey and report focus on Asian adults in the U.S. The six largest origin groups together account for 81% of Asian adults. And 68% of Asian American adults are immigrants, according to Center analysis of the 2021 American Community Survey. Additionally, 25% are the U.S.-born children of immigrant parents and 10% are of third or higher generation, according to Center analysis of government data.
The making of Asian American identity and knowledge of Asian history in the U.S.
The pan-ethnic term “Asian American” emerged in Berkeley, California, in the 1960s as part of a political movement to organize the diverse U.S. Asian population. The creation of an Asian American identity was in reaction to a long history of exclusion of Asians in the country, including the 1882 Chinese Exclusion Act and a pair of Supreme Court cases in the 1920s clarifying that Asians, including South Asians, are not “free White persons” and therefore were excluded from becoming naturalized U.S. citizens.3 Subsequently, the term was adopted by the federal government and today is the principal identity label used by media, academics, researchers and others to describe today’s diverse Asian American population.
In most cases today, someone is considered Asian or Asian American if they self-identify as such. But Asian Americans do not necessarily agree on which regional or ethnic groups from the Asian continent they consider to be Asian, according to the new survey. The vast majority of Asian adults say they consider those from East Asia, such as Chinese or Koreans (89%); Southeast Asia, such as Vietnamese or Filipinos (88%); and to a lesser extent South Asia such as Indians or Pakistanis (67%) to be Asian.
But Asian adults are split on whether they consider Central Asians such as Afghans or Kazakhs to be Asian (43% of Asian adults say they are). While about half of Indian adults (56%) say they would include Central Asians in the category Asian, fewer than half of Filipino (40%), Chinese (39%), Japanese (34%), Korean (32%) and Vietnamese (30%) adults consider them Asian.
Few Asians say they are knowledgeable about U.S. Asian history
Asian Americans have a long history in the United States. From Chinese laborers who helped build the first transcontinental railroad, to Japanese immigrants who arrived as plantation workers in what is now the state of Hawaii, to the incarceration of Japanese Americans during World War II, to Filipinos being treated as U.S. nationals while the Philippines was a U.S. territory, the Asian American experience has been a part of U.S. history.
With the passage of the landmark Immigration and Nationality Act of 1965, a new wave of immigrants from Asia began arriving in the United States, creating a new, contemporary U.S. Asian history. The Vietnam War and other conflicts in Southeast Asia brought Vietnamese and other Southeast Asian refugees to the U.S., first with the passage of the 1975 Indochina Migration and Refugee Assistance Act and then with the Refugee Act of 1980. The 1990 Immigration Act raised immigration ceilings and set in place processes that allowed the flows of Asian immigrants, particularly of high-skilled immigrants, to continue and expand. The U.S. technology boom of the 1990s and 2000s attracted many high-skilled immigrants, particularly from India and China, to tech centers around the country.
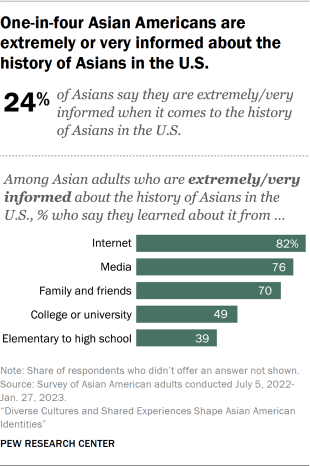
This rich history, however, is little-known to Asian adults, according to the new survey. One-in-four (24%) say they are very or extremely informed about history of Asians in the United States, while an equal share (24%) say they are little or not at all informed.
The majority of those very or extremely informed about the history of Asians in the U.S. say they learned about this history through informal channels: internet (82%), media (76%) and family and friends (70%). In contrast, 49% learned about it from college or university courses and 39% from elementary through high school.
Immigrant ties shape Asian Americans’ identities and their life in the U.S.
Immigration experiences, connections with home countries, and how long someone has lived in the U.S. shape many Asian Americans’ identities. Among Asian adults in the U.S., immigrants are more likely than those who are U.S. born to describe their identity most often with their ethnic labels, either alone or together with the label American (56% vs. 41%).
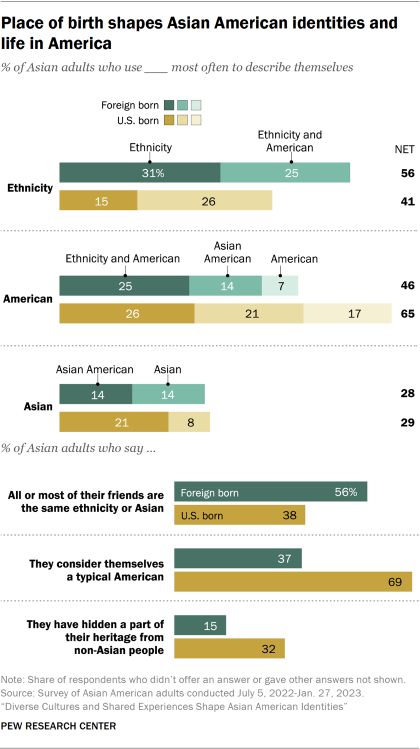
Meanwhile, Asian immigrants are less likely than U.S.-born Asians (46% vs. 65%) to say they most often describe themselves as American in some way – whether by their ethnic label combined with American, as Asian American, or simply as American. Still, nearly half of Asian immigrants describe themselves in one of these three ways.
When it comes to identifying with the label Asian – either alone or as Asian American – immigrant and U.S.-born Asians are about equally likely to say they do so (28% and 29% respectively). Immigrant Asians are less likely than U.S.-born Asians to identify most often as Asian American (14% vs. 21%).
On the question of seeing themselves more as a “typical American” or “very different from a typical American,” Asian immigrant adults are far less likely than those born in the U.S. to think of themselves as a typical American (37% vs. 69%).
Nativity is also tied to how Asians in the U.S. develop their friendships. Those who immigrated to the U.S. are more likely to have friends who are Asian or of the same ethnicity as them than are U.S.-born Asians (56% vs. 38%).
Asian immigrants (15%) are also less likely than U.S.-born Asians (32%) to have ever hidden a part of their heritage from people who are not Asian. When asked in an open-ended question to explain why they hide aspects of their culture, some U.S.-born respondents mentioned phrases such as “fear of discrimination,” “being teased” and “embarrassing.”
Views of identity among Asian American immigrants are often tied to time spent in the U.S.
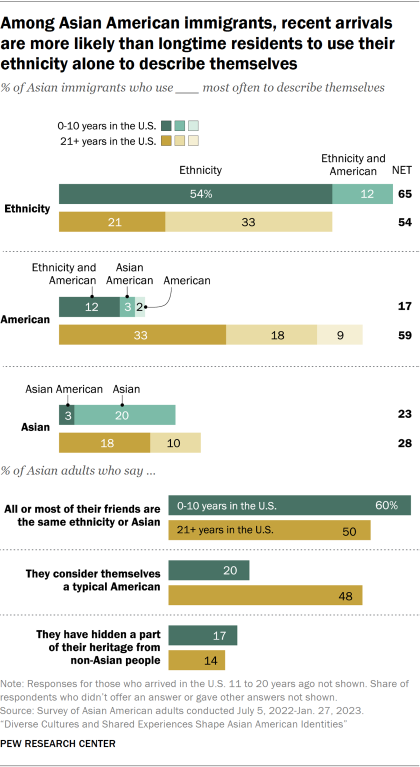
How long Asian immigrants have lived in the U.S. also shapes their identity and experiences. Those who arrived in the U.S. in the past 10 years are more likely than those who arrived more than 20 years ago to say they most often use their ethnicity, such as Filipino or Vietnamese, to describe themselves. And about two-thirds (65%) of those who arrived in the U.S. in the past decade describe their identity most often with their ethnicity’s name, either alone or combined with American, compared with 54% among those who have been in the country for more than two decades.
Roughly half (54%) of those who have arrived in the past 10 years say they most often use only their ethnicity to describe themselves, compared with just 21% of those who arrived more than two decades ago who say the same.
On the other hand, just 17% of Asian immigrants who arrived in the country in the past 10 years describe themselves most often as American, by their ethnic label combined with American, or as Asian American, while 59% of those who arrived more than 20 years ago do so.
When it comes to their circle of friends, 60% of Asian immigrants who arrived in the past 10 years say most or all of their friends are also Asian Americans, while 50% of those who arrived more than 20 years ago say the same.
And when asked if they think of themselves as typical Americans or not, Asian immigrants who arrived in the U.S. in the past decade are substantially less likely than those who arrived more than two decades ago to say they are typical Americans (20% vs. 48%).
Asians in the U.S. share similar views among themselves and with the U.S. public on what it means to be American
The new survey also explored the views Asian Americans have about traits that make one “truly American.” Overall, Asian Americans and the general U.S. population share similar views of what it means to be American. Nearly all Asian adults and U.S. adults say that accepting people of diverse racial and religious backgrounds (94% and 91%), believing in individual freedoms (92% and 94%) and respecting U.S. political institutions and laws (89% and 87%) are important for being truly American.
Similarly, Asian Americans and the U.S. general population share in their views about the American dream. They say having freedom of choice in how to live one’s life (96% and 97% respectively), having a good family life (96% and 94%), retiring comfortably (96% and 94%) and owning a home (both 86%) are important to their view of the American dream. Smaller shares of Asian and U.S. adults (30% and 27%) say owning a business is important to their view of the American dream.
Here are other survey findings highlighting the diverse views and attitudes of Asian adults living in the U.S.:
- Indian adults are the most likely of the six largest Asian origin groups to say they most often use their ethnicity, without the addition of “American,” to describe themselves. About four-in-ten Indian adults (41%) say they do this. By comparison, smaller shares of Korean (30%), Filipino (29%), Chinese (26%) and Vietnamese (23%) adults do the same. Japanese adults (14%) are the least likely among the largest groups to use their ethnic identity term alone.
- Japanese adults are the least likely among the largest Asian origin groups to say they have friendships with other Asians. About one-in-three Japanese adults (34%) say most or all their friends share their own ethnicity or are otherwise Asian. By contrast, about half of all Indian (55%), Vietnamese (55%), Chinese (51%), Korean (50%) and Filipino (48%) respondents say the same.
- One-in-four Korean adults (25%) say they have hidden part of their heritage from people who are not Asian. Some 20% of Indian, 19% of Chinese, 18% of Vietnamese, 16% of Filipino and 14% of Japanese adults say they have done the same.
- Across the largest ethnic groups, about half or more say that what happens to Asians in the U.S. affects what happens in their own lives. About two-thirds of Korean (67%) and Chinese (65%) adults say this. By comparison, 61% of Japanese, 54% of Filipino, 55% of Indian and 52% of Vietnamese adults say they are impacted by what happens to Asians nationally.
- Most Asian adults among the largest ethnic origin groups say a national leader advancing the U.S. Asian community’s concerns is important. Roughly three-in-four Filipino (74%) and Chinese (73%) adults say it is very or extremely important to for the U.S. Asian community to have a national leader advancing its concerns. A majority of Vietnamese (69%), Korean (66%), Japanese (63%) and Indian adults (62%) says the same.
- About half of Vietnamese registered voters (51%) identify with or lean to the Republican Party. In contrast, about two-thirds of Indian (68%), Filipino (68%) and Korean (67%) registered voters identify with or lean toward the Democratic Party. And 56% of Chinese registered voters also associate with the Democratic Party.