Pew Research Center designed the focus groups to understand the diverse experiences and perspectives of Asians living in the United States. This research was conducted by PSB Insights for Pew Research Center and was reviewed by an IRB (internal review board) for human subject research. The purpose of the focus groups was to gain further understanding of identity, economic mobility, representation in popular culture and political life, and experiences with immigration and discrimination among Asians living in the United States. The analysis presented in this data essay is intended to provide insight into these topics and is not meant to be an exhaustive representation of public opinion on these topics or of specific demographic groups.
About the groups
We conducted 66 online focus groups with 264 adult participants from across the United States from Aug. 4 to Oct. 14, 2021. Recruited participants came from 18 Asian origin groups. Each person was offered an incentive amount of $175 to participate. Focus groups were 2 hours in length with 15 minutes allocated to introductions, warm-up questions and debriefs.1
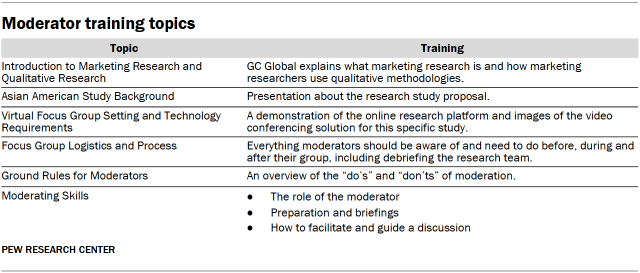
The topics for discussion during the focus groups were as follows:
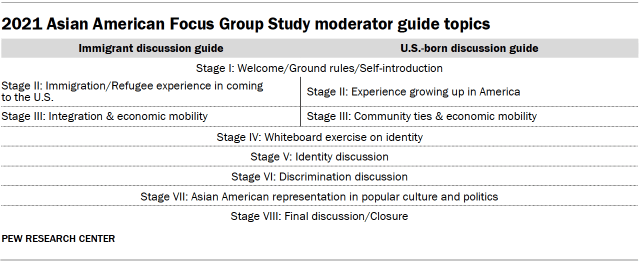
Researchers created two broad moderator guides on these topics listed in the table above, one for focus groups made up of U.S.-born Asians and another for focus groups made up of immigrant Asians. Guides for immigrant Asian focus groups were translated into 17 non-English languages. (You can find the moderator guides for immigrant focus group discussions here and for U.S.-born focus group discussions here. The guides published here are limited to the identity discussion: stages I, IV and V, as findings from these sections are the ones reported in this data essay.)
Study design and group criteria
For each focus group, six participants were recruited while four were ultimately selected to participate. The research team overrecruited participants to account for “no-shows,” as well as participants who may experience technical issues that prevent participation.
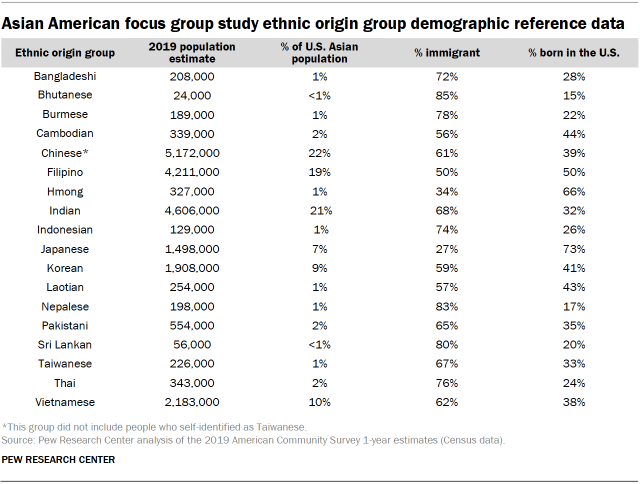
The study included focus groups from 18 distinct Asian origin groups. These included participants from the six largest Asian origin groups (Chinese, Indian, Filipino, Japanese, Korean and Vietnamese) which made up 85% of the national Asian American population in 2019. The study also included participants from 12 smaller origin groups (Bangladeshi, Bhutanese, Burmese, Cambodian, Hmong, Indonesian, Laotian, Nepalese, Pakistani, Sri Lankan, Taiwanese and Thai). These ethnic origin groups were selected for the study to include the voices of those from smaller populations.
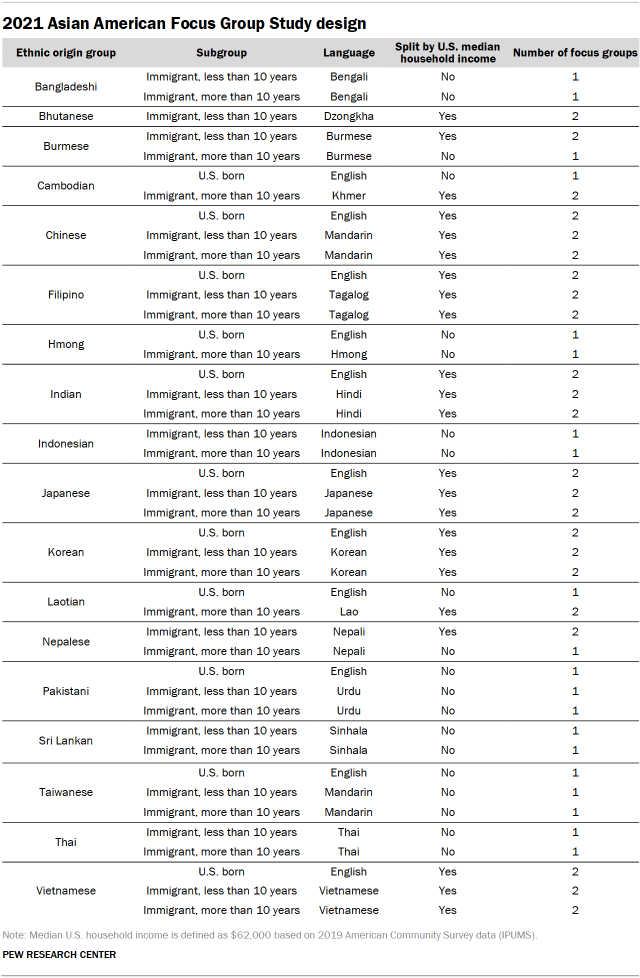
Focus groups were further stratified by other demographic characteristics such as nativity, duration of U.S. residency, and household income, based on American Community Survey data (see table below). For nativity, researchers classified participants as either born in the U.S. or born outside of the U.S. based on self-reported birthplace information provided in the screener survey. Immigrant participants were segmented into those who have been in the U.S. for 10 years or longer and those who have been in the U.S. for less than 10 years. For some origin groups, participants were also grouped by their reported household income, with those reporting household incomes at the U.S. national median ($62,000) or above classified as “higher income” and those with household incomes below the median classified as “lower income.”
Participant recruitment procedures
Recruitment of focus group participants was conducted via local Asian community member networks, organized by language and ethnicity. Recruitment was conducted in person following guidance on COVID-19 restrictions (i.e., personal visits, community meetings, etc.), via social media (e.g., Facebook, Line, WeChat, WhatsApp) or by phone or email.
All potential participants were screened for eligibility based on a questionnaire designed by Pew Research Center, which included criteria such as ethnic origin affiliation, country of birth, length of time in the U.S. (for immigrants), household income and other demographic profile questions. Once eligible participants were identified, they confirmed if they were available for the focus group and signed an informed consent form.
Eligible participants were reviewed and approved by the Pew Research Center team weekly. For each focus group, researchers selected four preferred participants and sought to ensure diversity across dimensions for which there were no hard quotas, including gender, educational qualifications, partisan identification and geography. If one of the four preferred participants did not show up to the focus group or experienced technical difficulties to the extent that they could not participate, they were replaced by one of the two overrecruited participants. When replacing participants, the research team strove to keep the groups as diverse as possible with a special emphasis on maintaining gender parity.
Moderator qualification
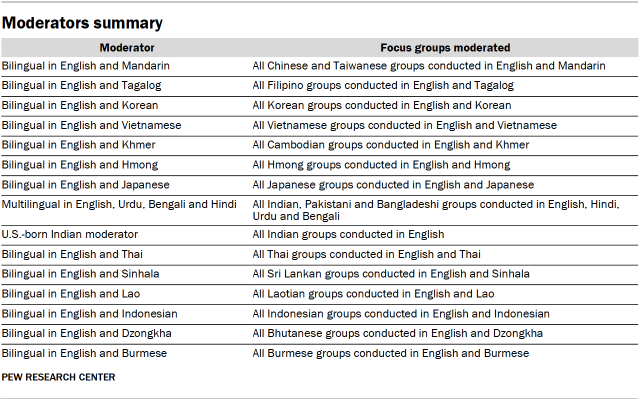
PSB Insights partnered with GC Global to help facilitate moderation and interpretation. Recruitment for focus group moderators emphasized the importance of native language speakers as well as matching moderators’ ethnicity to each origin group to help build rapport and facilitate an open conversation with participants.
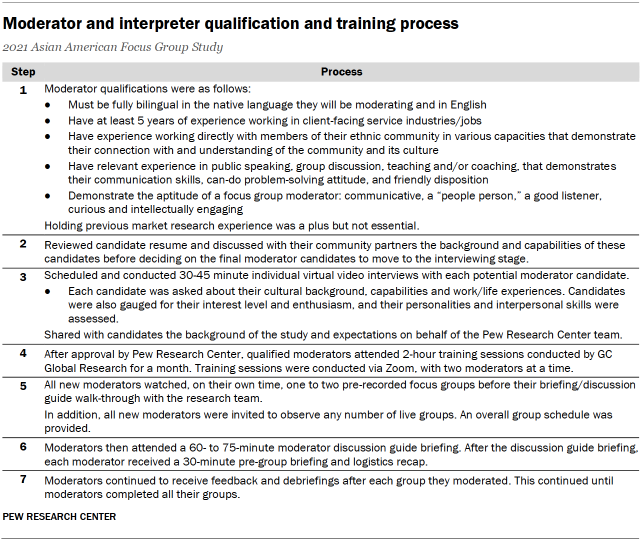
Before fielding any focus groups, moderators attended trainings conducted by the Pew Research Center team and PSB Insights on the moderator guides and the overall research objectives of the study. Researchers prioritized moderators with more prior experience moderating focus groups, especially on social science research topics. Researchers also weighted moderators’ understanding and connection with the community where participants come from. During the training session with the moderators, researchers shared best practices about how to handle questions about personal experiences and how to moderate disagreements during the focus group discussion.
Accessibility during virtual focus groups
The study provided an in-language tech support person for each of the non-English-speaking focus groups. These individuals assisted with checking the technology of all the respondents who could not speak English prior to the focus groups. The in-language technician attended the focus group 15-20 minutes before and after the focus group’s start time.
Data analysis
The conversations among group participants were conducted virtually and were video recorded, transcribed, and translated into English for immigrant focus groups. The final data sent to Pew Research Center was anonymized. To analyze the focus group transcripts, Center researchers utilized ATLAS.ti, a qualitative data analysis and research software.
All 66 focus group transcripts were coded using the following structure for each group and individual participant within the focus group:
- Origin group
- Nativity
- Years of living in the U.S. (for immigrants)
- Age group
- Gender
- Income level
The transcripts were also coded by topic, including but not limited to:
- Racial or ethnic identity
- Experiences growing up in America (for U.S.-born participants)
- Early experiences after coming to the U.S. (for immigrant participants)
- Connection with the community that shares the same ethnic culture
- Adapting their lives to living in the U.S. (for immigrant participants)
- Getting ahead in life financially
- Discrimination
- Media, social and political representations of Asians in America
Within each topic, we used a list of detailed codes to identify the theme of each response. For example, in the identity section, the research team used the following codes to label responses related to racial/ethnic identity regardless of participant’s attitudes toward each label:
- Identified as Asian
- (code label: “ID: Asian”)
- Identified as American
- (code label: “ID: American”)
- Identified as Asian American
- (code label: “ID: Asian American”)
- Identified by their ethnicity (for example: Hmong, Vietnamese or Korean)
- (code label: “ID: Ethnicity”)
- Identified as [ethnic] American (i.e., Hmong American, Vietnamese American or Korean American)
- (code label: “ID: [Ethnic] American”)
- Identified by a regional Asian name (for example: South Asian or Southeast Asian)
- (code label: “ID: Regional Asian”)
- Other identities (for example: woman or immigrant)
- (code label: “ID: Other”)
The research team then evaluated the same response and added an additional layer of codes to identify the purpose of the discussion. For example, if a participant gave their own understanding of what being American means, the quote would be coded as “ID: American” and “ID: Definition.” If a participant explained why they see themselves as Cambodian, the quote would be coded as “ID: Ethnicity,” “ID: Self” and “ID: Reason.” Below is a list of purpose codes for the identity discussion.
- ID: Definition (When participants talked about the definition of an identity term)
- ID: Self-identification (When participants talked about how they identify themselves)
- ID: Reason (When participants gave a reasoning behind their comments)
- ID: Perceived (When participants shared the way others see them)
- ID: Linked fate (When participants talked about things that happened to others can happen to them)
Participants also talked about factors that bring them closer to their ethnic heritage or things that pushed them away from their ethnic heritage at different stages of their lives. We used two codes to identify these two themes.
- ID: Pull factor ethnic ID
- ID: Push factor ethnic ID
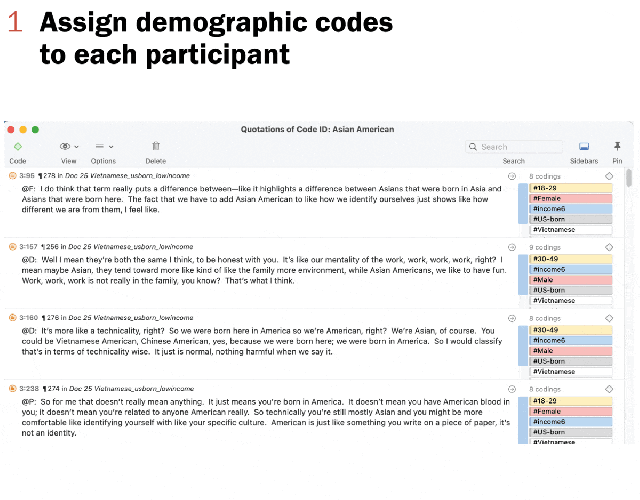
The following shows the process from transcript coding to final themes. First, the researcher identified the demographic codes for each participant in the focus group, such as age group, gender and income level. These identified codes were auto detected through the name match process and assigned to each participant’s quotes automatically. Researchers then reviewed the transcript document and applied detailed topic codes to each quote.
A number of quality control checks were conducted. After coding all transcript documents, researchers viewed organized quotes of all focus groups by detailed topic codes with demographic codes alongside them. A different researcher then evaluated the codes and made suggestions for changes. Any discrepancies were resolved among the primary coding researcher and the reevaluating researcher. When they could not reach the agreement, the lead researcher would reconcile the coding and set standardized coding practices for similar quotes.
The finalized quotations were exported into a spreadsheet where each row represented one quote. The research team identified the themes within each detailed topic code and rearranged and extracted quotations into different themes for publication.
While we highlight the sentiments expressed by individual participants in the data essay, they are chosen to highlight the themes discussed by the group more broadly. They are not necessarily representative of the majority opinion in any particular group.
Quotations in the data essay have been edited for grammar, spelling and clarity.