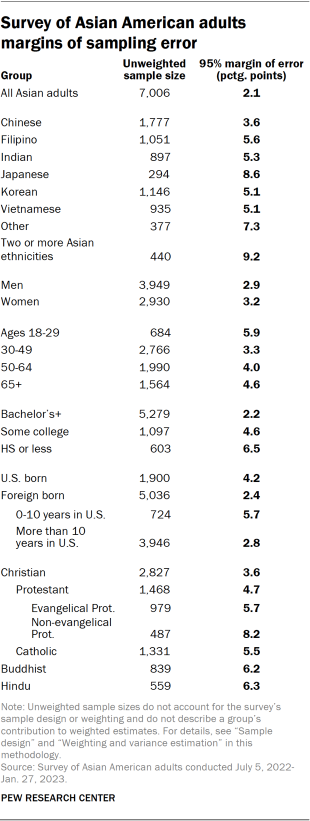
The data in this report is drawn from a national cross-sectional survey conducted for Pew Research Center by Westat. The sampling design of the survey was an address-based sampling (ABS) approach, supplemented by list samples, to reach a nationally representative group of respondents. The survey was fielded July 5, 2022, through Jan. 27, 2023. Self-administered screening interviews were conducted with a total of 36,469 U.S. adults either online or by mail, resulting in 7,006 interviews with Asian American adults. It is these 7,006 Asian Americans who are the focus of this report. After accounting for the complex sample design and loss of precision due to weighting, the margin of sampling error for these respondents is plus or minus 2.1 percentage points at the 95% level of confidence.
The survey was administered in two stages. In the first stage, a short screening survey was administered to a national sample of U.S. adults to collect basic demographics and determine a respondent’s eligibility for the extended survey of Asian Americans. Screener respondents were considered eligible for the extended survey if they self-identified as Asian (alone or in combination with any other race or ethnicity). Note that all individuals who self-identified as Asian were asked to complete the extended survey.
To maintain consistency with the Census Bureau’s definition of “Asian,” individuals responding as Asian but who self-identified with origins that did not meet the bureau’s official standards prior to the 2020 decennial census were considered ineligible and were not asked to complete the extended survey or were removed from the final sample. Those excluded were people solely of Southwest Asian descent (e.g., Lebanese, Saudi), those with Central Asian origins (e.g., Afghan, Uzbek) as well as various other non-Asian origins. The impact of excluding these groups is small, as together they represent about 1%-2% of the national U.S. Asian population, according to a Pew Research Center analysis of the 2021 American Community Survey.
Eligible survey respondents were asked in the extended survey how they identified ethnically (for example: Chinese, Filipino, Indian, Korean, Vietnamese, or some other ethnicity with a write-in option). Note that survey respondents were asked about their ethnicity rather than nationality. For example, those classified as Chinese in the survey are those self-identifying as of Chinese ethnicity, rather than necessarily being a citizen or former citizen of the People’s Republic of China. Since this is an ethnicity, classification of survey respondents as Chinese also includes those who are Taiwanese.
The research plan for this project was submitted to Westat’s institutional review board (IRB), which is an independent committee of experts that specializes in helping to protect the rights of research participants. Due to the minimal risks associated with this questionnaire content and the population of interest, this research underwent an expedited review and received approval (approval # FWA 00005551).
Throughout this methodology statement, the terms “extended survey” and “extended questionnaire” refer to the extended survey of Asian Americans that is the focus of this report, and “eligible adults” and “eligible respondents” refer to those individuals who met its eligibility criteria, unless otherwise noted.
Sample design
The survey had a complex sample design constructed to maximize efficiency in reaching Asian American adults while also supporting reliable, national estimates for the population as a whole and for the five largest ethnic groups (Chinese, Filipino, Indian, Korean and Vietnamese). Asian American adults include those who self-identify as Asian, either alone or in combination with other races or Hispanic identity.
The main sample frame of the 2022-2023 Asian American Survey is an address-based sample (ABS). The ABS frame of addresses was derived from the USPS Computerized Delivery Sequence file. It is maintained by Marketing Systems Group (MSG) and is updated monthly. MSG geocodes their entire ABS frame, so block, block group, and census tract characteristics from the decennial census and the American Community Survey (ACS) could be appended to addresses and used for sampling and data collection.
All addresses on the ABS frame were geocoded to a census tract. Census tracts were then grouped into three strata based on the density of Asian American adults, defined as the proportion of Asian American adults among all adults in the tract. The three strata were defined as:
- High density: tracts with an Asian American adult density of 10% or higher
- Medium density: tracts with a density 3% to less than 10%
- Low density: tracts with a density less than 3%
Mailing addresses in census tracts from the lowest density stratum, strata 3, were excluded from the sampling frame. As a result, the frame excluded 54.1% of the 2020 census tracts, 49.1% of the U.S. adult population, including 9.1% of adults who self-identified as Asian alone or in combination with other races or Hispanic ethnicity. For the largest five Asian ethnic subgroups, Filipinos had the largest percentage of excluded adults with 6.8%, while Indians had the lowest with 4.2% of the adults. Addresses were then sampled from the two remaining strata. This stratification and the assignment of differential sampling rates to the strata were critical design components because of the rareness of the Asian American adult population.
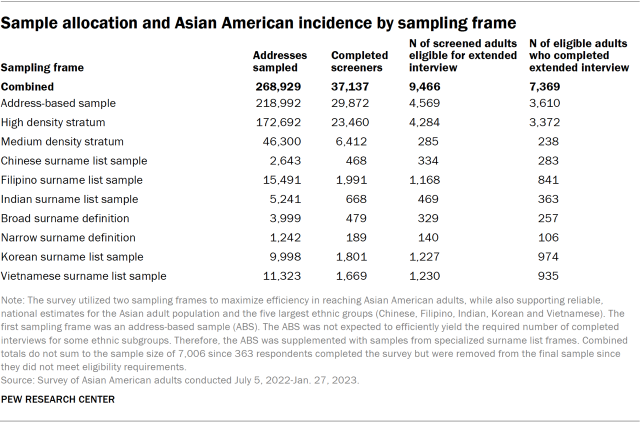
Despite oversampling of the high- and medium-density Asian American strata in the ABS sample, the ABS sample was not expected to efficiently yield the required number of completed interviews for some ethnic subgroups. Therefore, the ABS sample was supplemented with samples from the specialized surnames list frames maintained by the MSG. These list frames identify households using commercial databases linked to addresses and telephone numbers. The individuals’ surnames in these lists could be classified by likely ethnic origin. Westat requested MSG to produce five list frames: Chinese, Filipino, Indian, Korean and Vietnamese. The lists were subset to include only cases with a mailing address. Addresses sampled from the lists, unlike those sampled from the ABS frame, were not limited to high- and medium-density census tracts.
Once an address was sampled from either the ABS frame or the surname lists, an invitation was mailed to the address. The invitation requested that the adult in the household with the next birthday complete the survey.
Data collection
To maximize response, the survey used a sequential mixed-mode protocol in which sampled households were first directed to respond online and later mailed a paper version of the questionnaire if they did not respond online.
The first mailing was a letter introducing the survey and providing the information necessary (URL and unique PIN) for online response. A pre-incentive of $2 was included in the mailing. This and remaining screener recruitment letters focused on the screener survey, without mentioning the possibility of eligibility for a longer survey and associated promised incentive, since most people would only be asked to complete the short screening survey. It was important for all households to complete the screening survey, not just those who identify as Asian American. As such, the invitation did not mention that the extended survey would focus on topics surrounding the Asian American experience. The invitation was generic to minimize the risk of nonresponse bias due to topic salience bias.
After one week, Westat sent a postcard reminder to all sampled individuals, followed three weeks later by a reminder letter to nonrespondents. Approximately 8.5 weeks after the initial mailing, Westat sent nonrespondents a paper version screening survey, which was a four-page booklet (one folded 11×17 paper) and a postage-paid return envelope in addition to the cover letter. If no response was obtained from those four mailings, no further contact was made.
Eligible adults who completed the screening interview on the web were immediately asked to continue with the extended questionnaire. If an eligible adult completed the screener online but did not complete the extended interview, Westat sent them a reminder letter. This was performed on a rolling basis when it had been at least one week since the web breakoff. Names were not collected until the end of the web survey, so these letters were addressed to “Recent Participant.”
If an eligible respondent completed a paper screener, Westat mailed them the extended survey and a postage-paid return envelope. This was sent weekly as completed paper screeners arrived. Westat followed these paper mailings with a reminder postcard. Later, Westat sent a final paper version via FedEx to eligible adults who had not completed the extended interview online or by paper.
Incentives
A pre-incentive of $2 (in the form of two $1 bills) was sent to all sampled addresses with the first letter, which provided information about how to complete the survey online. This and subsequent screener invitations only referred to the pre-incentive without reference to the possibility of later promised incentives.
Respondents who completed the screening survey and were found eligible were offered a promised incentive of $10 to go on and complete the extended survey. All participants who completed the extended web survey were offered their choice of a $10 Amazon.com gift code instantly or $10 cash mailed. All participants who completed the survey via paper were mailed a $10 cash incentive.
In December 2022 a mailing was added for eligible respondents who had completed a screener questionnaire, either by web or paper but who had not yet completed the extended survey. It was sent to those who had received their last mailing in the standard sequence at least four weeks earlier. It included a cover letter, a paper copy of the extended survey, and a business reply envelope, and was assembled in a 9×12 envelope with a $1 bill made visible through the envelope window.
In the last month of data collection, an additional mailing was added to boost the number of Vietnamese respondents. A random sample of 4,000 addresses from the Vietnamese surname list and 2,000 addresses from the ABS frame who were flagged as likely Vietnamese were sent another copy of the first invitation letter, which contained web login credentials but no paper copy of the screener. This was sent in a No. 10 envelope with a wide window and was assembled with a $1 bill visible through the envelope window.
Languages
The mail and web screening and extended surveys were developed in English and translated into Chinese (Simplified and Traditional), Hindi, Korean, Tagalog and Vietnamese. For web, the landing page was displayed in English initially but included banners at the top and bottom of the page that allowed respondents to change the displayed language. Once in the survey, a dropdown button at the top of each page was available to respondents to toggle between languages.
The paper surveys were also formatted into all six languages. Recipients thought to be more likely to use a specific language option, based on supplemental information in the sampling frame or their address location, were sent a paper screener in that language in addition to an English screener questionnaire. Those receiving a paper extended instrument were sent the extended survey in the language in which the screener was completed. For web, respondents continued in their selected language from the screener.
Weighting and variance estimation
Household-level weighting
The first step in weighting was creating a base weight for each sampled mailing address to account for its probability of selection into the sample. The base weight for mailing address k is called BWk and is defined as the inverse of its probability of selection. The ABS sample addresses had a probability of selection based on the stratum from which they were sampled. The supplemental samples (i.e., Chinese, Filipino, Indian, Korean and Vietnamese surname lists) also had a probability of selection from the list frames. Because all of the addresses in the list frames are also included in the ABS frame, these addresses had multiple opportunities for these addresses to be selected, and the base weights include an adjustment to account for their higher probability of selection.
Each sampled mailing address was assigned to one of four categories according to its final screener disposition. The categories were 1) household with a completed screener interview, 2) household with an incomplete screener interview, 3) ineligible (i.e., not a household, which were primarily postmaster returns), and 4) addresses for which status was unknown (i.e., addresses that were not identified as undeliverable by the USPS but from which no survey response was received).
The second step in the weighting process was adjusting the base weight to account for occupied households among those with unknown eligibility (category 4). Previous ABS studies have found that about 13% of all addresses in the ABS frame were either vacant or not home to anyone in the civilian, non-institutionalized adult population. For this survey, it was assumed that 87% of all sampled addresses from the ABS frame were eligible households. However, this value was not appropriate for the addresses sampled from the list frames, which were expected to have a higher proportion of households as these were maintained lists. For the list samples, the occupied household rate was computed as the proportion of list cases in category 3 compared to all resolved list cases (i.e., the sum of categories 1 through 3). The base weights for the share of category 4 addresses (unknown eligibility) assumed to be eligible were then allocated to cases in categories 1 and 2 (known households) so that the sum of the combined category 1 and 2 base weights equaled the number of addresses assumed to be eligible in each frame. The category 3 ineligible addresses were given a weight of zero.
The next step was adjusting for nonresponse for households without a completed screener interview to create a final household weight. This adjustment allocated the weights of nonrespondents (category 2) to those of respondents (category 1) within classes defined by the cross-classification of sampling strata, census region, and sample type (e.g., ABS and list supplemental samples). Those classes with fewer than 50 sampled addresses or large adjustment factors were collapsed with nearby cells within the sample type. Given the large variance in the household weights among the medium density ABS stratum, final household weights for addresses within this stratum were capped at 300.
Weighting of extended survey respondents
The extended interview nonresponse adjustment began by assigning each case that completed the screener interview to one of three dispositions: 1) eligible adult completed the extended interview; 2) eligible adult did not complete the extended interview; and 3) not eligible for the extended interview.
An initial adult base weight was calculated for the cases with a completed extended interview as the product of the truncated number of adults in the household (max value of 3) and the household weight. This adjustment accounted for selecting one adult in each household.
The final step in the adult weighting was calibrating the adult weights for those who completed the extended interview so that the calibrated weights (i.e., the estimated number of adults) aligned with benchmarks for non-institutionalized Asian adults from the 2016-2020 American Community Surveys Public Use Microdata Sample (PUMS). Specifically, raking was used to calibrate the weights on the following dimensions:
- Ethnic group (Chinese, Filipino, Indian, Japanese, Korean, Vietnamese, other single Asian ethnicities, and multiple Asian ethnicities)
- Collapsed ethnic group (Chinese, Filipino, Indian, Korean, Vietnamese, all other single and multiple Asian ethnicities) by age group
- Collapsed ethnic group by sex
- Collapsed ethnic group by census region
- Collapsed ethnic group by education
- Collapsed ethnic group by housing tenure
- Collapsed ethnic group by nativity
- Income group by number of persons in the household
The control totals used in raking were based on the entire population of Asian American adults (including those who live in the excluded stratum) to correct for both extended interview nonresponse and undercoverage from excluding the low-density stratum in the ABS frame.
Variance estimation
Because the modeled estimates used in the weighting are themselves subject to sampling error, variance estimation and tests of statistical significance were performed using the grouped jackknife estimator (JK2). One hundred sets of replicates were created by deleting a group of cases within each stratum from each replicate and doubling the weights for a corresponding set of cases in the same stratum. The entire weighting and modeling process was performed on the full sample and then separately repeated for each replicate. The result is a total of 101 separate weights for each respondent that have incorporated the variability from the complex sample design.7
Response rates
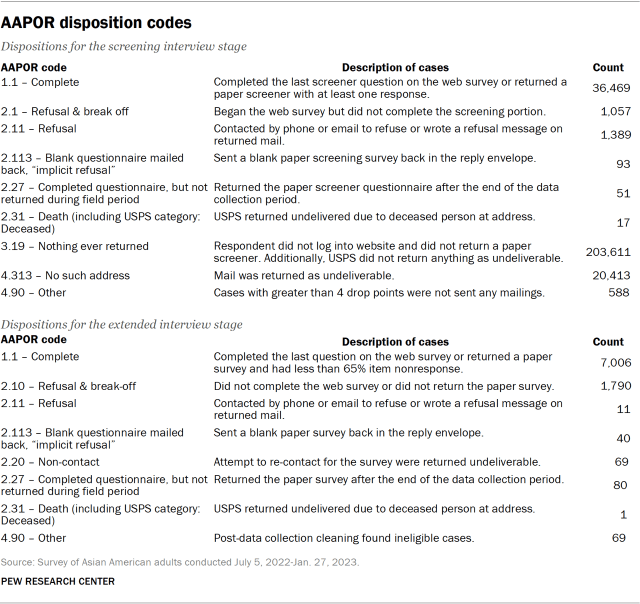
Westat assigned all sampled cases a result code for their participation in the screener, and then they assigned a result for the extended questionnaire for those who were eligible for the survey of Asian Americans. Two of the dispositions warrant some discussion. One is the category “4.313 No such address.” This category is for addresses that were returned by the U.S. Postal Service as not being deliverable. This status indicates the address, which was on the USPS Delivery Sequence File at the time of sampling, currently is not occupied or no longer exists. The second category is “4.90 Other.” This category contains 588 addresses that were never mailed because they had a drop count of greater than four. Drop points are addresses with multiple households that share the same address. The information available in the ABS frame on drop points is limited to the number of drop points at the address, without information on the type of households at the drop point, or how they should be labeled for mailing purposes. In this survey, all drop points were eligible for sampling, but only those with drop point counts of four or fewer were mailed. Westat treated drop point counts of five or more as out of scope, and no mailing was done for those addresses.
Westat used the disposition results to compute response rates consistent with AAPOR definitions. The response rates are weighted by the base weight to account for the differential sampling in this survey. The AAPOR RR3 response rate to the screening interview was 17.0%.8 The RR1 response rate to the extended Asian American interview (77.9%) is the number of eligible adults completing the questionnaire over the total sampled for that extended questionnaire. The overall response rate is the product of the screener response rate and the conditional response rate for the extended questionnaire. The overall response rate for the Asian American sample in the Pew Research Center survey was 13.3% (17.0% x 77.9%).
Identifying ‘distinctive’ language in open-ended responses to hiding heritage from others
As part of the survey, respondents were asked if they have ever hidden a part of their heritage from people who are not Asian. Those who answered yes were asked in a follow-up open-ended question on why they do so. Pointwise mutual information was used to identify the 100 most distinctive terms that distinguish responses from U.S.-born and foreign-born respondents. The terms identified through this method represent the language that characterizes how respondents from either group answered the open-ended question.