
Income inequality, a measure of the economic gap between the rich and poor, has risen steadily in the United States since the 1970s. More recently, the issue burst into public consciousness with the Occupy Wall Street movement in 2011 and subsequent calls for a $15 minimum wage. An important part of the story of rising income inequality is that experiences within America’s racial and ethnic communities vary strikingly from one group to the other.
Today, income inequality in the U.S. is greatest among Asians. From 1970 to 2016, the gap in the standard of living between Asians near the top and the bottom of the income ladder nearly doubled, and the distribution of income among Asians transformed from being one of the most equal to being the most unequal among America’s major racial and ethnic groups.
In this process, Asians displaced blacks as the most economically divided racial or ethnic group in the U.S., according to a new Pew Research Center analysis of government data. While Asians overall rank as the highest earning racial and ethnic group in the U.S., it is not a status shared by all Asians: From 1970 to 2016, the gains in income for lower-income Asians trailed well behind the gains for their counterparts in other groups.
An increase in income inequality matters because of the potential for social and economic consequences. People at the lower rungs of the income ladder may experience diminished economic opportunity and mobility and have less political influence. Researchers have also linked growing inequality to greater geographic segregation by income. In addition, there is evidence that rising inequality may harm overall economic growth by reducing consumption levels, causing excessive borrowing by lower- to middle-income families, or limiting investment in education.
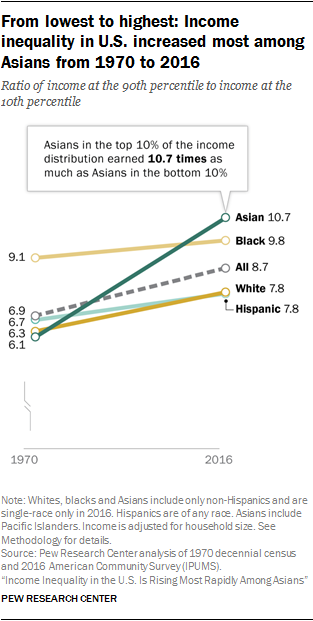
The income gap between Americans at the top and the bottom of the income distribution widened 27% from 1970 to 2016. Among all Americans, those near the top of the income ladder had 8.7 times as much income as those near the bottom in 2016, $109,578 compared with $12,523. In 1970, Americans near the top had 6.9 times as much income as those near the bottom, $63,512 compared with $9,212. (All income estimates are adjusted for household size and expressed in 2016 dollars.)
This measure of inequality, known as the 90/10 ratio, takes the ratio of the income needed to place among the top 10% of earners in the U.S. (the 90th percentile) to the income at the threshold of the bottom 10% of earners (the 10th percentile).1 It is a simple measure of the gap in income between the top and the bottom of the income ladder and is commonly used by researchers and government agencies. (See text box for more on measuring inequality.)
The 90/10 ratio varies widely by race and ethnicity. In 2016, Asians at the 90th percentile of their income distribution had 10.7 times the income of Asians at the 10th percentile. The 90/10 ratio among Asians was notably greater than the ratio among blacks (9.8), whites (7.8) and Hispanics (7.8).
This pattern of inequality across groups represents a significant shift from the past. In 1970, the 90/10 ratio among Asians was 6.1, about as low as among whites (6.3). But the top-to-bottom gap in income among Asians increased 77% from 1970 to 2016, a far greater increase than among whites (24%), Hispanics (15%) or blacks (7%).2 This marked difference in the growth in inequality reflects the fact that Asians near the top experienced more growth in income from 1970 to 2016 than any other group while Asians near the bottom experienced the least growth.
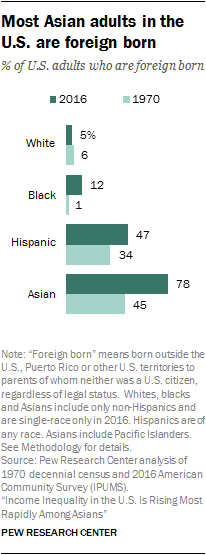
The Asian experience with inequality is partly driven by immigration.3 Immigrants accounted for 81% of the growth in the Asian adult population from 1970 to 2016, and the foreign-born share among Asians increased from 45% to 78% in this period.4 The surge in Asian immigration followed the Immigration and Nationality Act in 1965, which favored family reunification, and the end to the war in Vietnam in 1975, which brought in a wave of refugees. One result was that the share of new Asian immigrants working in high-skill occupations decreased from 1970 to 1990, and the share working in low-skill occupations increased.5
More recently, the Immigration Act of 1990 sought to increase the inflow of skilled immigrants. Coinciding with a boom in the technology sector, a new wave of Asian immigrants, many from India, followed under the auspices of the H-1B visa program. Thus, since 1990, there has been an increase in the share of Asian immigrants employed in high-skill occupations.
Education levels and incomes vary widely among Asians living in the U.S. In 2015, the share with at least a bachelor’s degree, among adults ages 25 and older, ranged from 72% among Indians to 9% among Bhutanese, median household income varied from $100,000 among Indians to $36,000 among Burmese, and poverty rates ranged as high as 35% among the Burmese and 33% among the Bhutanese.6 This diversity in their origins and experiences is reflected in the relatively high level of income inequality among Asians.
These are among the key findings from a new Pew Research Center analysis of American Community Survey (ACS) data from the U.S. Census Bureau in conjunction with decennial census data. The period of analysis is 1970 to 2016, from the decade marking the rise in inequality in modern times to the latest available data. The sample for the analysis is the U.S. adult, civilian household population, with some omissions.7
The focus of this report is on income inequality within the major racial and ethnic communities in the U.S., and on the gaps in income across people in these groups at the bottom, middle and upper points of the income distribution. Income inequality is measured using the 90/10 income ratio and the Gini coefficient (see text box). The term “income” in this report refers to what is afforded a person by the combined resources of his or her household, whether the person had personal earnings or not. Thus, people’s incomes are represented by their household’s income adjusted for household size.8 All members of a household have the same income, or standard of living.9
The standard of living of lower-income Asians stagnated from 1970 to 2016
As evidenced by the rise in inequality from 1970 to 2016, higher-income adults in the U.S. experienced more of an increase in income than lower-income adults within all racial and ethnic groups, and this disparity was most pronounced among Asians.
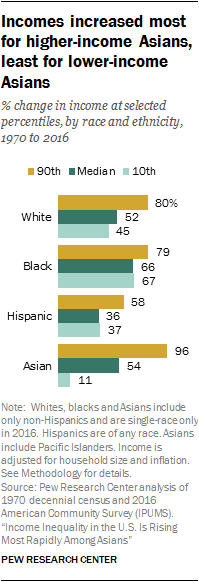
The income of higher-income Asians – those at the 90th percentile – nearly doubled from 1970 to 2016, rising 96%. Asians at the median-income level (50th percentile) experienced a 54% increase in income. But the income of Asians at the 10th percentile increased only 11% over this period.
Thus, inequality among Asians increased overall as those at the top of the income ladder pulled away from those at the middle and bottom, and Asians at the middle also pulled away from those near the bottom. Moreover, the gains for lower-income Asians lagged behind the gains for lower-income blacks (67%), whites (45%) and Hispanics (37%).
Whites, blacks and Hispanics at the 90th percentile also experienced relatively large gains in income (80%, 79% and 58% respectively). These improvements in the standard of living were greater than the gains at the median: 52% for whites, 66% for blacks and 36% for Hispanics. Lower-income whites, blacks and Hispanics, while losing ground to those at the top, mostly kept pace with those at the middle of their income distributions.
The trends in income growth also show that blacks made some progress in closing the gap with whites. Blacks at the median and at the 10th percentile experienced more of an increase in income than similarly situated whites, and blacks at the 90th percentile kept pace with whites.10 Hispanics experienced smaller increases in income than whites at all percentiles, however. Thus, lower-, middle- and upper-income Hispanics all lost ground to their white counterparts from 1970 to 2016.
As it has with Asians, immigration has been an important part of the Hispanic experience in recent decades. In 2016, 47% of adult Hispanics were foreign born, up from 34% in 1970. The inflow of immigrants accounted for 50% of the total increase in the Hispanic adult population from 1970 to 2016 and was tilted to the lower ends of the income distribution.11 In 2015, 47% of foreign-born Hispanics 25 and older had not graduated from high school, compared with 13% of Americans overall of this age. The influx of lower-skill, lower-income immigrants likely exerted a drag on the measured growth in income for Hispanics.
The majority of Asians have a higher standard of living than other groups, but some lag behind
Differences in income within racial and ethnic groups are not the only sources of inequality in the U.S., of course. The gaps in the standard of living across whites, blacks, Hispanics and Asians are also sizable and longstanding. These gaps are usually measured through differences in the mean or median incomes of groups.12 However, the sizes of the gaps are different at different tiers of the income ladder.
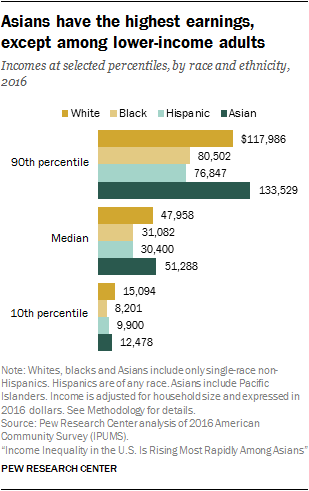
In 2016, Asians at the middle of their income distribution earned more than white, black or Hispanic adults at the middle of their income distributions. The median annual income for Asian adults was $51,288, compared with $47,958 for whites, $31,082 for blacks and $30,400 for Hispanics (incomes are adjusted for household size and expressed in 2016 dollars).
Asians also held the edge in standard of living over other groups at the top of the income distribution. The income of Asians at the 90th percentile was 13% higher than the income of whites at the 90th percentile in 2016, $133,529 versus $117,986. Upper-income blacks ($80,502) and Hispanics ($76,847) had a similar standard of living in 2016, and both were outdistanced by Asians and whites by a wide margin.
In contrast, lower-income Asians lagged behind lower-income whites. Asians at the 10th percentile of their income distribution lived on $12,478 in 2016, 17% less than the income of whites at the 10th percentile ($15,094). Lower-income blacks and Hispanics trailed by even more, with incomes of $8,201 and $9,900, respectively.
Income inequality and income gaps: Two windows into the well-being of racial and ethnic groups
The state of income inequality within racial and ethnic groups and the gaps in incomes across them provide complementary, yet distinct, insights into the well-being of these groups of Americans.13 The fact that inequality increased within each racial and ethnic group shows that no community was immune to the factors said to have raised U.S. inequality since 1970. These factors include technological change, globalization, the decline of unions and the eroding value of the minimum wage.
At the same time, the drivers of income inequality appear to have had a disproportionate impact on some racial and ethnic groups, as evidenced by the differences in the level of inequality and the degree to which it increased for each group. That could be because of differences in the characteristics of workers, such as educational attainment (greater among Asians and whites) and the share foreign born (greater among Asians and Hispanics). Also, larger societal forces may have affected some groups more than others, such as the disparately high rate of incarceration among black men (see text box).
The aforementioned differences in worker characteristics also contribute to the gaps in incomes across racial and ethnic groups. In addition, the historical legacy and current impact of discrimination are considered to be important factors in these gaps. Some scholars hold the view that discrimination not only distorts the hiring practices of employers but also contributes to gaps in skills across groups, disadvantaging racial minorities prior to their entry into the labor market.
It is worth noting that overall income inequality in the U.S. would persist even if the gaps in income across racial and ethnic groups were eliminated. For example, suppose that blacks, Hispanics and Asians had the same income distribution as whites. In that case, everyone at any given rung of the income ladder – lower, middle or upper – would have the same income regardless of race or ethnicity. However, the 90/10 ratio for the U.S. would fall only from 8.7, its actual level, to 7.8, the level that currently prevails among whites.14
Conversely, easing income inequality within racial and ethnic groups may have little impact on the gaps across groups. Suppose that incomes at the lower rungs of the ladder are raised 10% and incomes at the top are reduced 10%. This would reduce inequality overall and within each group, but the gaps in income across groups would be unchanged.
Inequality in the U.S. is higher than in other advanced economies
The level of inequality in the U.S., and the fact that it is comparable with the levels that existed in the 1920s by at least one measure, is of concern to many. Then-Federal Reserve Chair Janet Yellen remarked in 2014, “The extent of and continuing increase in inequality in the United States greatly concern me.” But others are more sanguine, arguing that the trends in U.S. inequality do not constrain opportunities for those at the bottom of the income distribution.
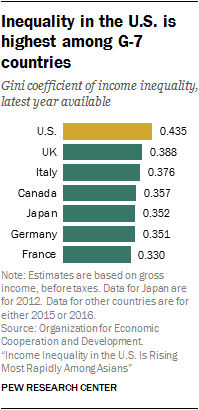
In the midst of this debate, it is worth noting that income inequality in the U.S. is higher than among other advanced economies and has also increased more rapidly in recent decades. Cross-national comparisons of income inequality are often based on the Gini coefficient, a widely used measure of inequality (see text box). The Gini coefficient in the U.S. stood at 0.435 in 2016 (based on gross income and on a scale of 0 to 1), according to the Organization for Economic Cooperation and Development (OECD).15 This was the highest of any of the G-7 countries, which ranged from 0.330 in France to 0.388 in the UK.
Indeed, OECD estimates show that the Gini coefficient for the U.S. is closer to the Gini for India (0.495) than to most of the G-7 countries. The level of inequality in the U.S. is also higher than the level of inequality in other OCED countries, with the exceptions of Chile, Mexico and Turkey.16 Globally, inequality is highest in countries in southern Africa (Gini coefficients of about 0.6) and lowest in eastern Europe and parts of northern Europe (Gini coefficients of about 0.25), according to World Bank estimates.
Researchers interested in the economic progress of black Americans in the post-Civil Rights era have expressed concern that an increase in incarceration in recent decades may affect the estimated trends. According to them, incarceration amounts to selective removal of individuals with limited earnings potential from the labor market. This could inflate statistical measures of the economic status of a group, such as its mean income, if the potential earnings of the incarcerated population are not accounted for in the analysis.
This issue is of particular concern to researchers focused on the economic status of black men relative to that of white men. As noted in one study, the share of black men ages 25 to 54 who are institutionalized increased from 3% in 1970 to 6% in 1990. Meanwhile, the share of white men ages 25 to 54 who are institutionalized held steady at 1%.
The institutionalized population consists of people residing in correctional institutions, mental institutions, homes for the elderly and other similar institutions. Currently, public-use versions of decennial census data and American Community Survey data do not separately identify the incarcerated population. But, according to Census Bureau estimates, nearly 60% of residents of institutional facilities were in correctional institutions in 2010. This share was about 20% in 1980.
To determine the impact of incarceration, researchers generally include the institutionalized population in their analysis, assigning people in institutions a wage based on a statistical imputation of their potential labor market earnings. In effect, this amounts to the construction of a hypothetical counterfactual economy in which there is no incarceration, or no difference in incarceration rates by race and ethnicity.
The main inference is that there has been little to no reduction in the black-white male earnings gap in recent decades if one accounts for the higher rate of incarceration among black men. Incarceration is also found to have had a negative impact on other labor market outcomes, such as employment, for black men. (See “Is the Convergence in the Racial Wage Gap Illusory?”, “The Prison Boom and the Lack of Black Progress after Smith and Welch,” “The Socioeconomic Status of Black Males: The Increasing Importance of Incarceration,” and “Incarceration & Social Inequality.”)
Although incarceration is an issue in analyses of the economic well-being of black men, its role in analyses of the economic well-being of the broader population is less certain. In part, that is because institutionalization rates for the broader population are smaller. In the household sample used in this report, 1.2% of the U.S. adults were institutionalized in 2016, compared with 1.6% in 1970 (see Appendix B). By race and ethnicity the share in 2016 was highest among blacks (3.7%), followed by Hispanics (1.5%), whites (0.8%) and Asians (0.3%).
From 1970 to 2016, income growth skews to the top, more so among Asians
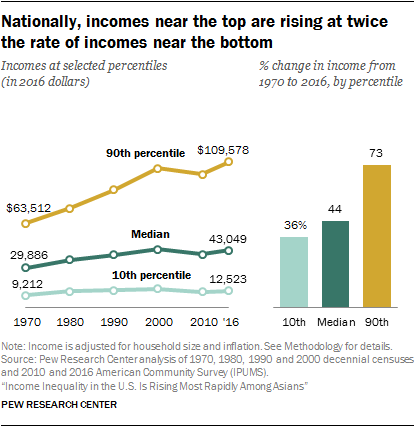
Among Americans overall, those at the 90th percentile of the income distribution earned $109,578 in 2016. That compared with $43,049 at the median (the 50th percentile) and $12,523 at the 10th percentile. The income at the 90th percentile in 2016 was 73% higher than in 1970, compared with an increase of 44% in the median income and an increase of 36% in the income at the 10th percentile. (Incomes are adjusted for household size and expressed in 2016 dollars.)
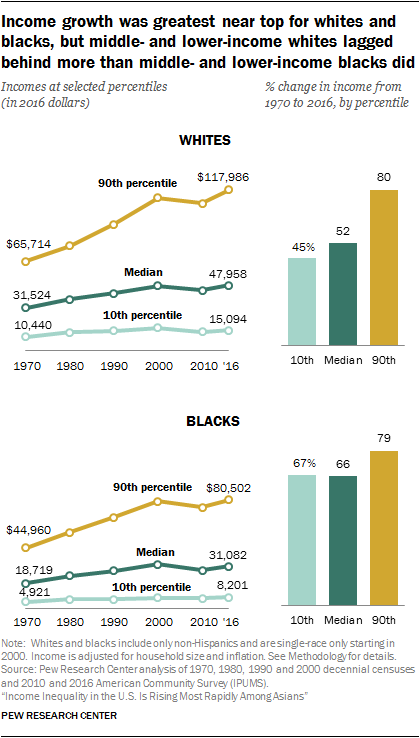
The pattern observed nationally is also present among whites, blacks, Hispanics and Asians, but to varying degrees. Whites at the 90th percentile of their income distribution earned $117,986 in 2016. Meanwhile, the median income for whites was $47,958 and their income at the 10th percentile was $15,094. From 1970 to 2016, the 90th percentile income for whites increased 80%, notably greater than the increase of 52% at the median and an increase of 45% at the 10th percentile.
Changes in income at the various points of the income distribution were somewhat more balanced among blacks. For blacks, the income at the 90th percentile was $80,502 in 2016, compared with $31,082 at the median and $8,201 at the 10th percentile. Compared with 1970, these income levels represented an increase of 79% at the 90th percentile, 66% at the median, and 67% at the 10th percentile.
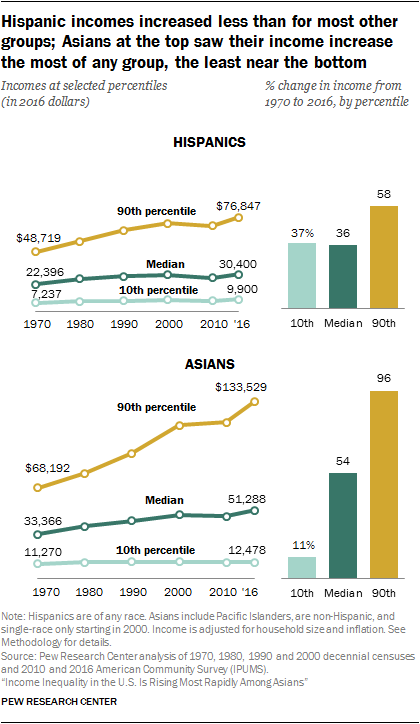
Income growth for Hispanics lagged behind the growth for other racial and ethnic groups at most points of the income distribution. In 2016, Hispanics at the 90th percentile earned $76,847, some 58% more than in 1970. The income of Hispanics at the median stood at $30,400 in 2016, up 36% from 1970. Meanwhile, Hispanics at the 10th percentile earned $9,900 in 2016, 37% higher than in 1970. These gains in income were less than the gains for other groups at the three points of the income distribution, except for Asians at the 10th percentile.
The Asian experience is distinguished by sharp differences in the growth in incomes across the distribution. In 2016, incomes for Asians ranged from $12,478 at the 10th percentile to $133,529 at the 90th percentile, with a median of $51,288. The income at the 90th percentile of the Asian income distribution in 2016 was roughly double the income at that percentile in 1970, rising 96% over the period. That stood in sharp contrast with the growth at the median (54%) and at the 10th percentile (only 11%).
Income growth slowed for all from 2000 to 2016, but income inequality continued to rise
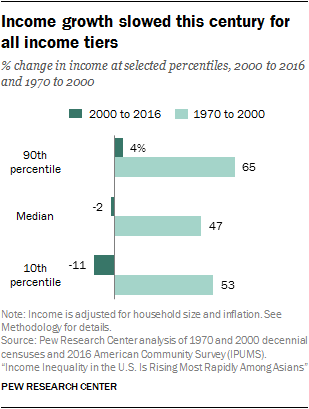
A hallmark of income growth in the U.S. this century is the marked slowdown that ensued with the economic recession in 2001 and the Great Recession of 2007-09. This slowdown affected people in all racial and ethnic groups and at all rungs of the income ladder.
Nationally, the income at the 90th percentile increased 65% from 1970 to 2000, but it increased only 4% from 2000 to 2016. Likewise, the median income in the U.S. increased 47% from 1970 to 2000, compared with a decrease of 2% from 2000 to 2016. At the 10th percentile, an increase of 53% from 1970 to 2000 was followed by a decrease of 11% this century.
The two periods are of different durations, of course. But the decrease in total growth at any percentile is well in excess of what the difference in years might explain. For example, the average annual rate of growth at the 90th percentile was 1.7% from 1970 to 2000 and fell to 0.3% from 2000 to 2016.17
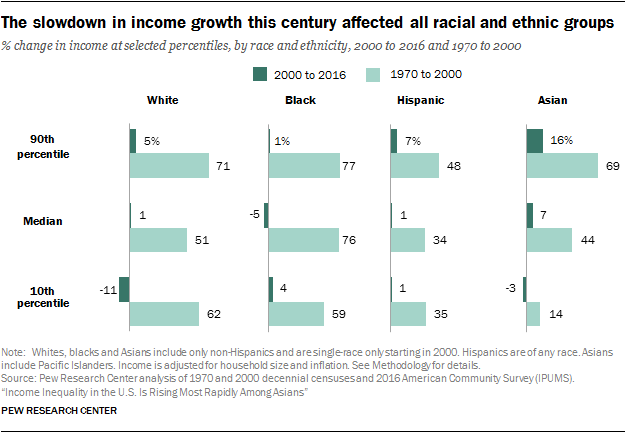
The trend observed nationally repeated within each racial and ethnic group. Among Asians, for instance, the income at the 90th percentile increased 16% from 2000 to 2016, compared with 69% from 1970 to 2000; the median income increased 7% this century, compared with 44% from 1970 to 2000; and the income at the 10th percentile decreased 3% from 2000 to 2016, compared with an increase of 14% in the earlier period.
The slowdown in income growth this century did not alter the general trajectory toward a rise in income inequality, however. Those at the top of the economic ladder fared better than those at the bottom through the economic slowdowns this century. The one exception was among blacks, with those at the 10th percentile experiencing slightly higher growth in income from 2000 to 2016 than those at the 90th percentile, 4% compared with 1%.
Following a rapid increase from 1970 to 2016, income inequality is highest among Asians
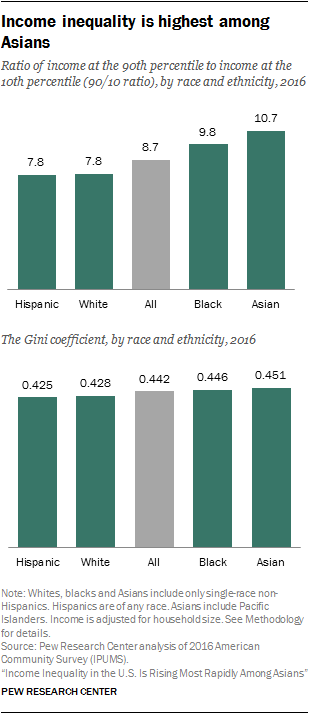
Asians are the highest-earning racial and ethnic group in the U.S., on average.18 However, their overall prosperity conceals a wide and rapidly growing economic divide between higher- and lower-income Asians. As noted, Asians at the 90th percentile had an income of $133,529 in 2016, compared with $12,478 for those at the 10th percentile. Thus, in 2016, the ratio of these two incomes – the 90/10 ratio – stood at 10.7 for Asians.
The level of income inequality among Asians was greater than among other racial and ethnic communities in 2016. Income inequality among blacks was the second highest – with a 90/10 ratio of 9.8 – followed by whites and Hispanics, each with a 90/10 ratio of 7.8. Nationally, the 90/10 ratio in 2016 is estimated to be 8.7.19
The pattern of inequality revealed by the 90/10 ratio is mirrored in the Gini coefficient. The Gini coefficient takes a value from 0 to 1, by construction. A value of 0 indicates a state of perfect equality, with everyone holding an equal share of aggregate income. A value of 1 implies that all income created in the economy is in the hands of one person, a state of absolute inequality. In essence, the estimated value of the Gini coefficient measures the deviation from perfect equality. (See the text box on measuring inequality.)
Looking within racial and ethnic groups in 2016, the Gini coefficient for the distribution of income among Asians was 0.451, followed by blacks (0.446), whites (0.428) and Hispanics (0.425).20 Thus, as also revealed by the 90/10 ratios, Asians and blacks are more economically divided than whites and Hispanics and, in this respect, there is a meaningful degree of separation between these two pairs of racial and ethnic groups.21
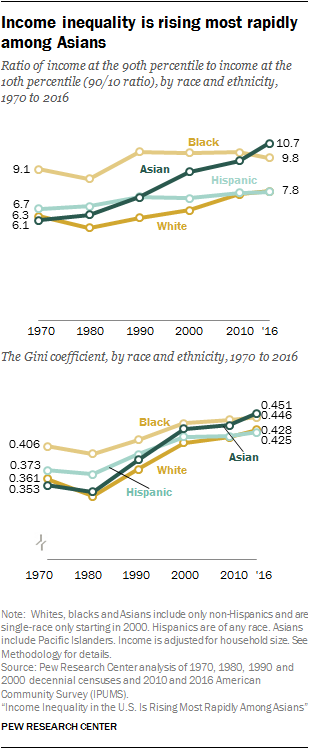
Asians have not always experienced the highest level of income inequality, however. In 1970, the 90/10 ratio among Asians was 6.1, similar to the ratio of 6.3 for whites and lower than among Hispanics and blacks. But inequality among Asians increased every decade since 1970, propelling the 90/10 ratio for them to 10.7 in 2016, an increase of 77%.
Blacks experienced the highest level of income inequality in 1970, and through most of the period examined. In 1970, the 90/10 ratio for blacks stood at 9.1, well above the ratios for the other groups. But after peaking around 10 in 1990, the 90/10 ratio for blacks edged down to 9.8 in 2016. Over the period from 1970 to 2016, income inequality among blacks increased only 7% by this measure. That was the smallest increase in inequality among the major racial and ethnic groups.
The increase in inequality among whites and Hispanics was greater than among blacks. For whites, the 90/10 ratio increased from 6.3 in 1970 to 7.8 in 2016, a 24% increase. The 90/10 ratio for Hispanics increased from 6.7 in 1970 to 7.8 in 2016 (15%). Despite the increase, whites and Hispanics had the lowest levels of income inequality in 2016.
Changes in the Gini coefficient show the same pattern of change in income inequality.22 Among Asians, the Gini coefficient increased from 0.353 in 1970, the lowest at the time, to 0.451 in 2016, the highest of all groups. A key difference is that the increase in the Gini coefficient for Asians is less than the increase in the 90/10 ratio, 28% compared with 77%.
Nonetheless, the increase in the Gini coefficient for Asians was notably greater than the increase for other racial and ethnic groups. The Gini coefficient for whites increased 19%, from 0.361 in 1970 to 0.428 in 2016, followed by an increase of 14% for Hispanics, from 0.373 to 0.425, and an increase of 10% for blacks, from 0.406 to 0.446. These percentage changes are similar to the changes in the 90/10 ratios for these groups.
Immigration looms large in defining the Asian experience
Asians are America’s fastest growing major racial and ethnic population. The Asian adult civilian household population in the U.S. increased fourteenfold from 1970 to 2016, compared with an eightfold increase in the Hispanic population, the second-fastest growing group. The overall adult civilian household population roughly doubled from 1970 to 2016.23
The increase in the Asian population is fueled by immigration. From 1970 to 2016, immigrants accounted for 81% of the increase in the Asian adult population, and the immigrant share in the Asian population increased to 78% in 2016, from 45% in 1970.24 The change in the economic profile of the Asian population in recent decades reflects the immigrant experience to a large degree.
Overall, Asian immigrants have higher levels of education than native-born Americans. In 2015, 29% of immigrants from South and East Asia,25 ages 25 and older, held a bachelor’s degree, compared with 19% of native-born Americans this age. Another 23% of these immigrants had an advanced college degree, about double the rate among native-born Americans (11%).
As a result, many Asian immigrants are settling in at the top of the income distribution and likely stretching its boundaries into higher reaches. As of 2016, the foreign-born population among the top 10% of earners in the Asian income distribution had increased to 26 times what it was in 1970, compared with a nineteenfold increase in the overall Asian foreign-born population in the U.S.26
At the same time, the Asian immigrant population includes many with lower levels of education and income. From 1970 to 2016, the foreign-born population among the bottom 10% of earners in the Asian income distribution increased seventeenfold. This change is not as sharp as the change at the top of the income distribution but is of notable magnitude nonetheless.
In 2015, some 15% of immigrants from South and East Asia lacked a high school diploma, compared with 9% of native-born Americans. Meanwhile, poverty rates were as high as 35% among Burmese, 33% among Bhutanese, and 28% among Hmong and Malaysians, compared with 15.1% in the U.S. overall.27 The wide diversity in the education and income profiles of Asian origin groups is reflected in the relatively wide gap in their income distribution.
The growth in income inequality among Asians also reflects shifting trends in immigration to a degree. In recent decades, Asian immigration was first driven by the Immigration and Nationality Act in 1965 and the end to the war in Vietnam in 1975. These events brought in a wave of refugees and other immigrants under the family reunification program. As a result, the share of new Asian immigrants working in low-skill occupations increased from 1970 to 1990. A second wave of Asian immigration followed the passage of the Immigration Act of 1990. This act, in concert with a boom in the technology sector, led to a new wave of higher-skilled Asian immigrants under the H-1B visa program.
Income gaps across racial and ethnic groups persist and, in some cases, are wider than in 1970
America’s major racial and ethnic groups are divided into two distinct income brackets. Whites and Asians are in the bracket at the top and blacks and Hispanics, with incomes largely comparable with each other, are in the bracket below. The gaps between the two brackets are sizable and the shifts since 1970, with few exceptions, have been modest.
Whites and Asians out-earn blacks and Hispanics at all rungs of the income ladder
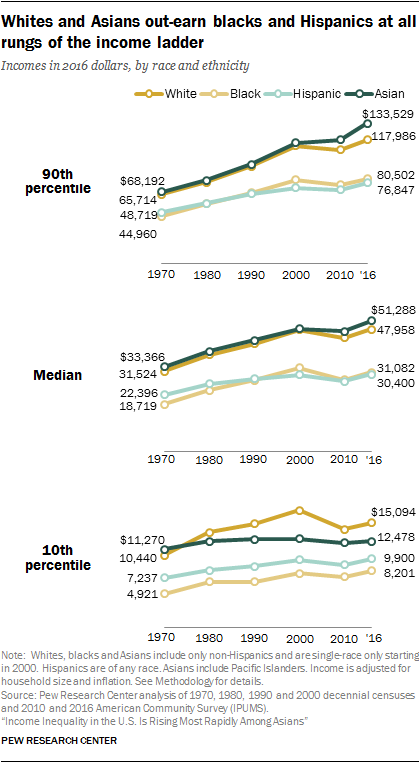
In 2016, Asians earned more than other groups at the middle and near the top of the income distribution. Asians at the 90th percentile of their distribution had an income of $133,529, considerably higher than the incomes of 90th percentile whites ($117,986), blacks ($80,502) and Hispanics ($76,847). (Incomes are adjusted for household size and expressed in 2016 dollars.)
The same ranking by income exists at the median (50th percentile). The median income of Asians in 2016 – $51,288 – was higher than the median income of whites ($47,958) and considerably greater than that of blacks ($31,082) and Hispanics ($30,400).
Asians did not hold the same edge over all other groups at the lower rungs, however. Asians at the 10th percentile of their income distribution had an income of $12,478 in 2016, trailing whites, who had an income of $15,094 at the 10th percentile. Hispanics ($9,900) earned more than blacks ($8,201) at the lower end of the income distribution.
Hispanics and blacks switched positions near the top of the income ladder from 1970 to 2016. In 1970, the 90th percentile income of Hispanics ($48,719) was greater than the 90th percentile income of blacks ($44,960). In 2016, blacks at the 90th percentile ($80,502) earned more than Hispanics at the 90th percentile ($76,847).
At the median, Hispanics earned more than blacks in 1970, $22,396 compared with $18,719. But this gap eroded over time, and by 2016 the median incomes of Hispanics ($30,400) and blacks ($31,082) were similar. The influx of Hispanic immigrants in recent decades, many with less education, likely played a role in shaping these trends (see below).28
Another notable change from 1970 is in the relative standing of lower-income Asians. In 1970, the 10th percentile income for Asians ($11,270) was similar to the 10th percentile incomes for whites ($10,440). But the income of Asians at this percentile increased just 11% from 1970 to 2016. As a result, whites had the highest income at the 10th percentile in 2016, and lower-income blacks and Hispanics narrowed the gap with lower-income Asians in recent decades.
Blacks inch closer to whites in earnings, Hispanics fall behind more, and Asians see mixed results
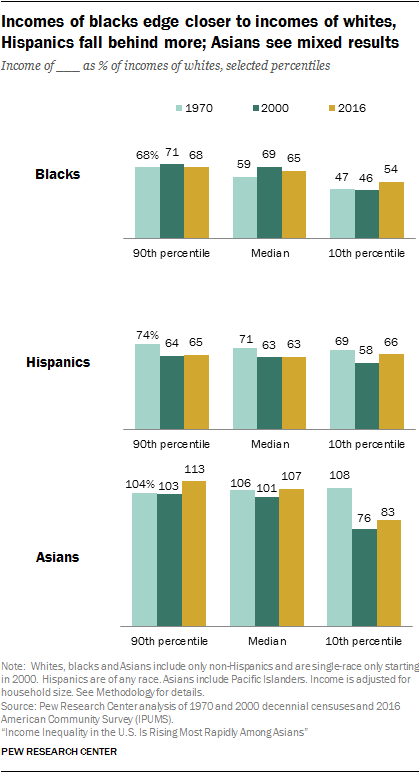
From 1970 to 2016, higher-income Asians moved further out in front of higher-income whites, but lower-income Asians did not keep pace. At the 90th percentile, Asians earned 4% more than whites in 1970, and this gap stretched to 13% in 2016. At the 10th percentile, Asians earned 8% more than whites in 1970, but in 2016, they earned 17% less, a considerable turnaround.
The gaps in income between whites and blacks are large, but they narrowed slightly from 1970 to 2016. In 1970, blacks at the 90th percentile of their distribution earned 68% as much as whites at the 90th percentile of their distribution. Nearly five decades later, this gap was unchanged in 2016. However, at the median, blacks earned 65% as much as whites in 2016, up from 59% in 1970. Similarly, lower-income blacks narrowed the gap from 47% in 1970 to 54% in 2016.
While the gap between blacks and whites closed a bit from 1970 to 2016, Hispanics fell even further behind, whether at the 10th percentile, the median or the 90th percentile. Near the top, Hispanics earned 65% as much as whites in 2016 compared with 74% in 1970. Near the bottom, the income of Hispanics slipped from 69% of the income of whites in 1970 to 66% in 2016.
Gaps in income across the entirety of the income distribution
A closer look at the gap between whites and other groups across the income distribution reveals the diversity of experiences from 1970 to 2016. The majority of Asians, especially those at the lower rungs of the income ladder, ceded ground to whites from 1970 to 2000, but all experienced a rebound to some extent this century. Hispanics, regardless of where they were in the income distribution, fell behind from 1970 to 2000, but lower-income Hispanics recovered some ground from 2000 to 2016. Among blacks, some of the gains from 1970 to 2000 were erased since 2000.
In 1970, Asians, as long as they were situated above the 5th percentile of their income distribution, had incomes equal to or greater than the incomes of whites. Asians at the 5th percentile earned 96% as much as whites at the 5th percentile in 1970, but Asians at other points of their income distribution earned about as much as or more than whites (income ratios equal to or greater than the parity level of 100).
However, from 1970 to 2000, incomes in the bottom half of the Asian income distribution did not grow at the same rate as incomes in the bottom half of the white income distribution. In 2000, Asians at the 5th percentile earned only 63% as much as whites at the 5th percentile, compared with 96% as much in 1970. At the 25th percentile, the income of Asians as a proportion of the income of whites fell to 92% in 2000, from 104% in 1970. Indeed, the incomes of about half the Asian adult population – those with incomes less than the median (the 50th percentile) – were less than the incomes of whites in 2000. Asians with incomes above the median still out-earned whites in 2000, but often by smaller margins than in 1970.
Since 2000, Asians gained on whites all across the distribution, reversing the trend from 1970 to 2000. In 2016, Asians at the 5th percentile earned 73% as much as whites, up from 63% in 2000. Also, Asians at the 95th percentile earned 109% as much as whites, compared with 98% in 2000. About one-in-four Asians, those at the 25th percentile of income and below, earned less than whites at similar points in the income distribution in 2016, however.
As noted, the ebb and flow in the economic status of Asians, compared with whites, is perhaps related to the ebb and flow in the skill characteristics of Asian immigrants. Asians who came to the U.S. as part of the wave spurred by the Immigration and Nationality Act in 1965 and the end of the war in Vietnam in 1975 were relatively low-skilled, but a second wave driven by the technology boom in the 1990s and the H1-B visa program brought relatively high-skilled workers.
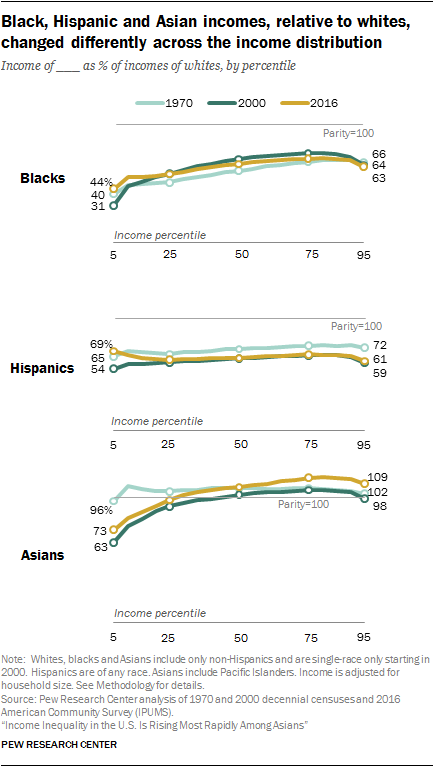
Most blacks, with the exception of those at the 95th percentile, saw gains relative to whites from 1970 to 2016. But there were two distinct episodes in this period, with gains from 1970 to 2000 followed by setbacks from 2000 to 2016. For example, the median income of blacks increased from 59% as much as the median income of whites in 1970 to 69% as much in 2000. But the median for blacks decreased to 65% of the median for whites in 2016. A similar regression describes the experience of most blacks with incomes above the 25th percentile of the income distribution from 1970 to 2016.
The reversal for blacks this century may reflect the impact of the Great Recession of 2007-09. Although no group was immune to the effects of the recession, the unemployment rate for blacks spiked to a high of 16.8% in March 2010, meaning one-in-six blacks in the workforce did not have a job. Also, the employment of blacks dipped below its potential (what it might have been absent a recession) more so than among whites during the Great Recession.
It is worth noting that the economic downturns this century came on the heels of a record-long expansion in the 1990s that yielded noticeable benefits for blacks. The unemployment rate for blacks dropped to a then-historic low of 7% in April 2000, narrowing the gap in unemployment with respect to whites. Meanwhile, the median household income for blacks, as reported by the Census Bureau, increased by 24% from 1990 to 2000, compared with a gain of 12% for whites.
For Hispanics, incomes sagged in comparison with whites at all points of the distribution from 1970 to 2000. The slippage was almost uniformly high across the distribution, near 10 percentage points whether at the 5th percentile, the median or the 95th percentile. There was little change from 2000 to 2016, with the notable exception of gains for lower-income Hispanics. While they continue to earn much less than their white counterparts, Hispanics at the lowest percentiles of the income distribution experienced an improvement in their relative position from 2000 to 2016.
Immigration helped shape the Hispanic experience from 1970 to 2016
The regression in the economic status of Hispanics relative to whites may be driven by the characteristics of immigrants in recent decades. Immigration accounted for 50% of the total increase in the Hispanic adult population from 1970 to 2016, and the share of the Hispanic population that is foreign born increased from 34% to 47% during the period.29
The Hispanic immigrant population tilts to the lower end of the income and skill distribution, however. In 2015, 47% of foreign-born Hispanics 25 and older had not graduated from high school, compared with 13% of Americans overall. Also, only 11% of Hispanic immigrants had attained at least a bachelor’s degree, compared with 31% of Americans overall.
The result is that Hispanic immigrants streamed into the lower rungs of the income ladder at a faster rate than into the higher rungs. From 1970 to 2016, the foreign-born population among the bottom 10% of earners in the Hispanic income distribution increased tenfold, compared with a fivefold increase in the foreign-born population among the top 10% of earners.30
Another characteristic of the Hispanic foreign-born population is the sharp rise in the number of unauthorized immigrants in recent decades. From 1990 to 2015, the Hispanic foreign-born population (all ages) increased from 7.8 million to 19.4 million, by 11.6 million. Meanwhile, from 1990 to 2014, the number of unauthorized immigrants in the U.S. who arrived from Latin America increased from an estimated 3.0 million to 8.6 million, by 5.6 million.31 Thus, unauthorized migration accounts for almost half of the increase in the Hispanic foreign-born population since 1990.
The increase in the unauthorized immigrant population from Latin America leveled off in 2007, however. In 2007, there were 9.8 million unauthorized immigrants from Latin America in the U.S., compared with 8.6 million in 2014, the latest available estimate. The decrease in new arrivals meant that unauthorized immigrants increasingly are likely to have been in the U.S. for 10 years or more – 66% in 2014, compared with 41% in 2005.32
The rapid rise and more recent leveling off of the unauthorized immigrant population may explain some of the change in the economic status of Hispanics relative to whites. Because the earnings of unauthorized immigrants are much lower than average, their initial influx likely dampened the earnings potential of Hispanics, which explains at least some of the widening of the income gap with whites since 1970. More recently, unauthorized immigrants are a declining share of the Hispanic population, and those who remain are longer tenured in the U.S., likely with higher potential earnings. That could help explain some of the improvement in the economic status of lower-income Hispanics relative to whites since 2000.
“Income” in this report refers to what is afforded a person by the combined resources of his or her household, whether the person had personal earnings or not. Thus, people’s incomes are represented by their household’s income adjusted for household size. All members of a household have the same income. Incomes are expressed in 2016 dollars.
Income is the sum of earnings from work, capital income such as interest and dividends, rental income, retirement income, and transfer income (such as government assistance), before payments for income taxes and social security contributions. The terms “income” and “earnings” are used interchangeably in this report.
The 90/10 ratio, a widely used measure of income inequality, is the ratio of the income at the 90th percentile of the income distribution to the income at the 10th percentile.
The Gini coefficient, another commonly used measure of income inequality, is derived from the share of aggregate income held by each individual. In a perfectly equal world, everyone has the same income, or the same share of aggregate income, and the Gini coefficient equals zero. In a perfectly unequal world, one individual holds all of the aggregate income and the Gini coefficient is equal to one.
Income distributions, incomes at various percentiles, and measures of inequality are computed separately for each racial and ethnic group.
Whites, blacks and Asians include only the single-race, non-Hispanic component of those groups. Hispanics are of any race. Asians include Pacific Islanders. Other racial/ethnic groups are included in all totals but are not shown separately.
“Foreign born” refers to people born outside of the United States, Puerto Rico or other U.S. territories to parents of whom neither was a U.S. citizen, regardless of legal status. The terms “foreign born” and “immigrant” are used interchangeably in this report.
Differences between numbers or percentages are computed before the underlying estimates are rounded.


