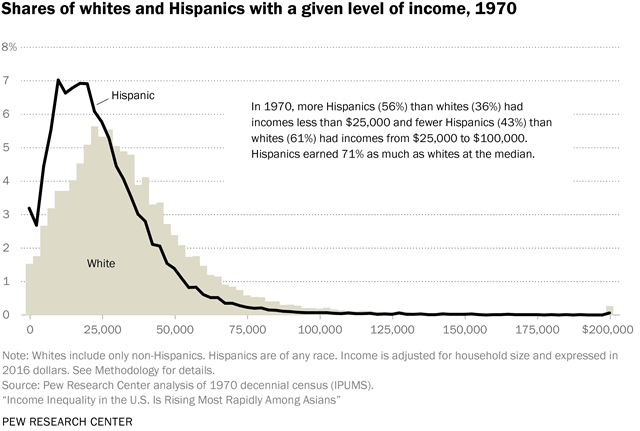
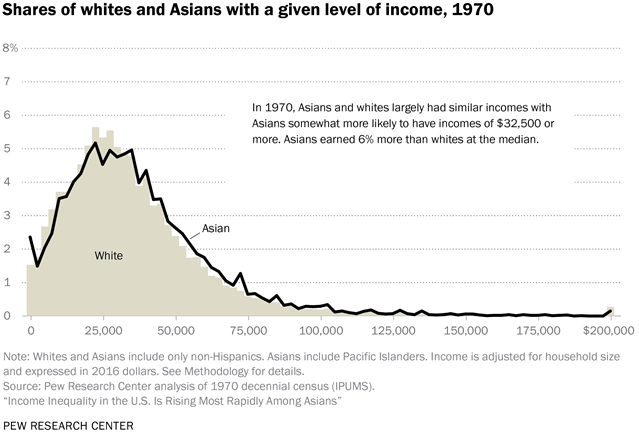
The charts in this appendix show the distributions of white, black, Hispanic and Asian adults in the U.S. by their incomes in 1970 and 2016. The first set of charts shows the income distribution for a given racial and ethnic group, say Hispanics, in the two years. The second and third sets of charts compare the income distributions of blacks, Hispanics and Asians with the income distribution of whites for 2016 and 1970, respectively.
Adults in each racial and ethnic group are further divided into 81 groups with incomes ranging from $0-2,499, $2,500-4,999, $5,000-7,499, and so on up to the highest income category of $200,000 or greater. Each chart shows the share of adults of a given race or ethnicity with incomes in the stated range.
“Income” refers to what is afforded a person by the combined resources of his or her household, whether the person had personal earnings or not. Thus, people’s incomes are represented by their household’s income adjusted for household size. All members of a household have the same income, which is expressed in 2016 dollars for both years.
The distributions are based on the adult, civilian household population, less adults living in households for which half or more of its income is imputed (allocated) by the U.S. Census Bureau. (See Methodology for details).
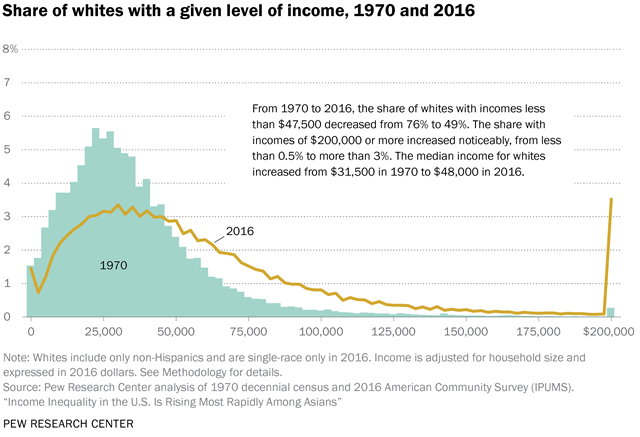
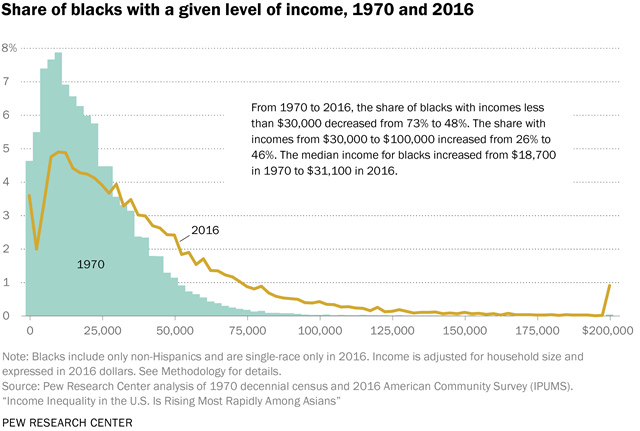
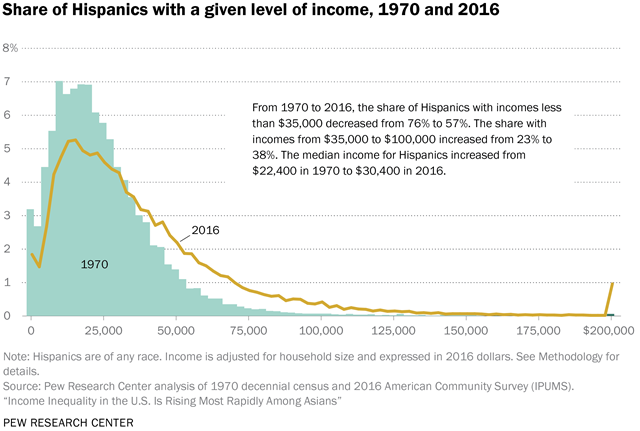
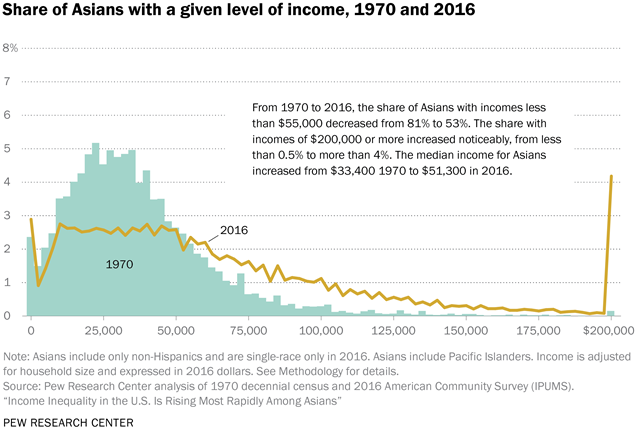
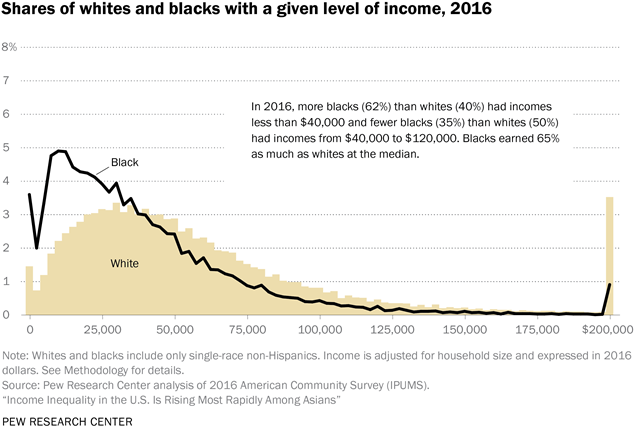
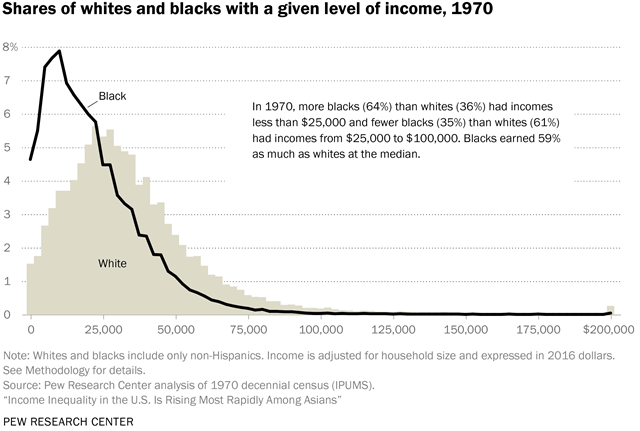
Overall, the income distributions show that the share of adults at lower income levels decreased among all racial and ethnic groups and the shares at middle and higher income levels increased. For example, the share of blacks with incomes in the range of $10,000 to $12,499 decreased from 8% in 1970 to 5% in 2016 and the share of blacks with incomes in the range of $50,000 to $52,499 increased from 1% in 1970 to 2% in 2016. The shares of adults within single income intervals of about $125,000 or more are quite low. For example, 0.4% of whites had incomes of $125,000 to $127,499 in 2016. There is a “spike” in the shares at the highest category ($200,000 or more) because the distribution is top coded at that income level.
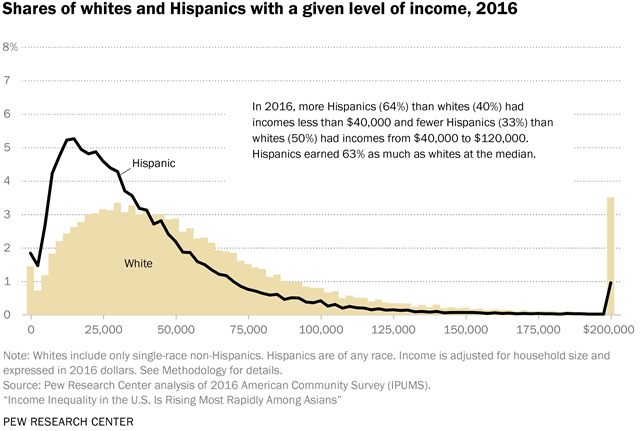
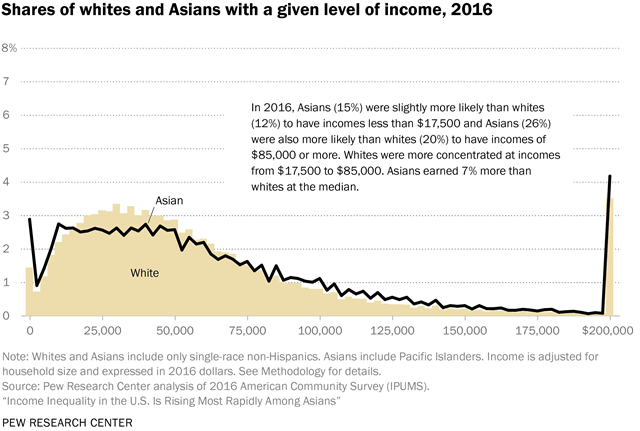
The charts comparing blacks and Hispanics with whites clearly show that there is a greater concentration of blacks and Hispanics at lower income levels and a greater concentration of whites at middle and higher income levels in both years. In 2016, Asians are somewhat more likely than whites to be middle or upper income and somewhat less likely to be lower income (with the exception of incomes up to about $17,499 in 2016). There was little difference in the income distributions of Asians and whites in 1970.