
The U.S. public’s views of both the Republican and Democratic parties are more unfavorable than favorable, with a record number of Americans (28%) now expressing unfavorable views of both parties.
Yet most Republicans and Democrats characterize their own party in positive terms, saying that it respects democracy and governs honestly and ethically. And most say their own party generally has good ideas.
Party favorability ratings
About six-in-ten Americans (61%) say they have an unfavorable view of the Republican Party, and a nearly identical share (60%) rate the Democratic Party unfavorably.
For close to two decades, views of the Republican Party have been consistently more unfavorable than favorable, with little shift in the last few years. But current evaluations are among the most negative in nearly three decades of Pew Research Center polling – and throughout the mid-1990s and early 2000s, the GOP was seen more favorably than not by the public.
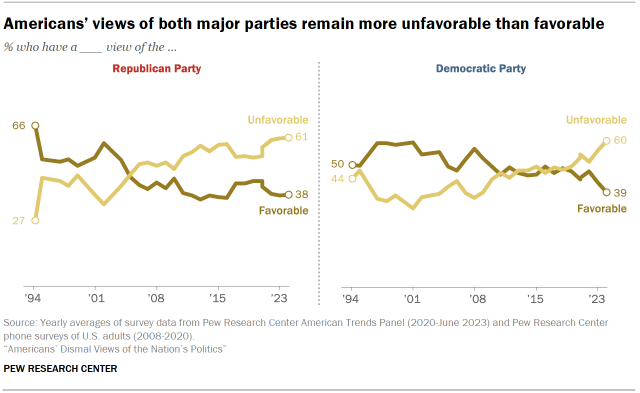
The negative turn in evaluations of the Democratic Party is more recent than for the Republican Party, with public views more mixed for much of the last decade and a half – and in positive territory for most of the mid-1990s through 2000s. In recent years, views of the Democratic Party have been more unfavorable than favorable and are now at their most negative point in the last three decades.
For 28% of Americans, both major parties get negative marks
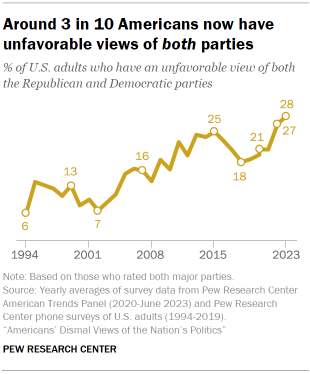
Nearly a third of Americans (28%) report holding negative views of both the Republican and Democratic parties. This is little changed since last year, but it is up considerably from a few years ago and is higher than at any other point in our nearly 30 years of polling.
Adults under 50 and political independents are more likely than others to have unfavorable views of both parties
About a third of adults ages 18 to 49 (35%) have unfavorable views of both of the major parties. This drops in older age groups: 24% of those 50 to 64 and an even smaller share (16%) of those 65 and older hold this combination of negative views.
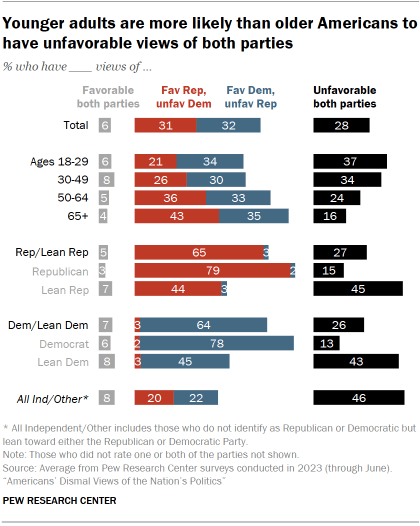
Nearly half of those who identify as politically independent or with something other than the Democratic or Republican Party (46%) view both parties negatively. Within this group, similar shares of those who lean Democratic (43%) and those who lean Republican (45%) rate both parties unfavorably. (Republican leaners who rate only one party positively overwhelmingly tilt to the GOP, while the reverse is true among Democratic leaners.)
Those who consider themselves Democrats or Republicans are much less likely to rate both parties negatively, with about eight-in-ten partisan identifiers viewing their own party positively. By contrast, independents and others who lean to a party have consistently been less likely to view that party positively.
Most characterize their party positively
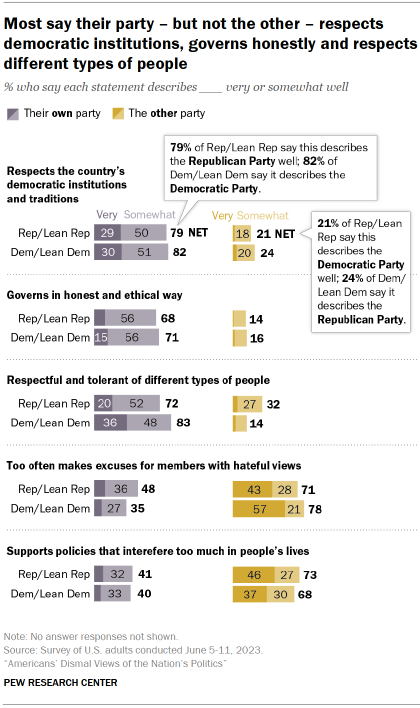
Most Americans characterize the party they identify with or lean toward in positive terms, viewing it as respectful of democracy, governing honestly and tolerant of different kinds of people. Far fewer say these traits characterize the other party.
Large majorities in both partisan coalitions say “respects the country’s democratic institutions and traditions” describes their party very or somewhat well (79% of Republicans and Republican leaners and 82% of Democrats and Democratic leaners say this).
Majorities also say their party is “respectful and tolerant of different types of people,” though Democrats (83%) are more likely than Republicans (72%) to say this characteristic applies to their own party.
About seven-in-ten in both parties say their party “governs in an honest and ethical way” (71% of Democrats, 68% of Republicans).
Sizable minorities see flaws in their party: 48% of Republicans and 35% of Democrats say their party “too often makes excuses for members with hateful views,” and about four-in-ten in both coalitions say their party “supports policies that interfere too much in people’s lives (41% of Republicans, 40% of Democrats). Still, even larger shares (at least two-thirds) say these negative attributes describe the other party.
Quality of the parties’ ideas
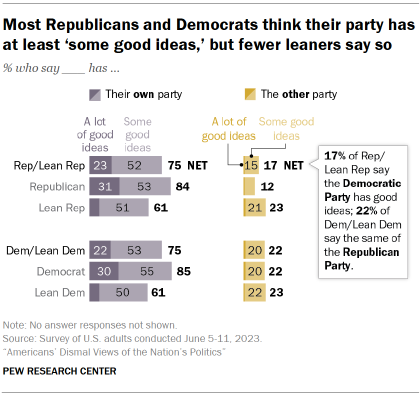
Clear majorities of Republicans and Democrats say their parties have at least some good ideas, while fewer than a quarter say the other party has some good ideas.
Within each partisan coalition, independents who lean toward the party are much less likely than those who identify with the party to say it has good ideas. About six-in-ten leaners in each party say the party has at least some good ideas, compared with more than eight-in-ten Republican and Democratic identifiers who say this.
Overall, most Americans (74%) say at least one of the two parties has some or a lot of good ideas, while 25% say that neither party does. Independents and others who don’t identify with the major parties are particularly likely to say that neither party has good ideas: 39% say this, including similar shares of Republican-leaning independents (35%) and Democratic-leaning independents (36%). In contrast, just 15% of Republican and 12% of Democratic identifiers say neither party has good ideas.
