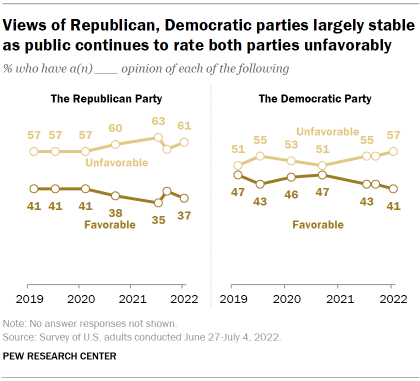
About six-in-ten U.S. adults (61%) have an unfavorable view of the Republican Party, with nearly as many (57%) holding a negative view of the Democratic Party. While there have been relatively modest changes in the overall ratings of each party over the last few years, the share of the public holding unfavorable views of both of the major parties has grown over the past few years and is now as high as at any point in more than two decades.
At the same time, deep partisan dislike of the “other side” in politics remains substantially higher than it was even a decade ago – and this is evident both among those who identify with a party and among independents who lean to a party.
Approval ratings for modern presidents mirror this trend. Over the course of Joe Biden’s presidency, the average gap between Democratic and Republican ratings of the president stands at 76 percentage points – roughly on par with the 80-point gap over the course of Donald Trump’s presidency, but wider than during the presidencies of Barack Obama (67 points) and George W. Bush (58 points). And the gaps under Biden and Trump are far wider than for presidencies in the mid-20th century (39 points during Dwight Eisenhower’s presidency, 30 points during Lyndon Johnson’s).
Leaners’ ratings of the opposing party are quite negative, but ratings of their ‘own’ party are lukewarm
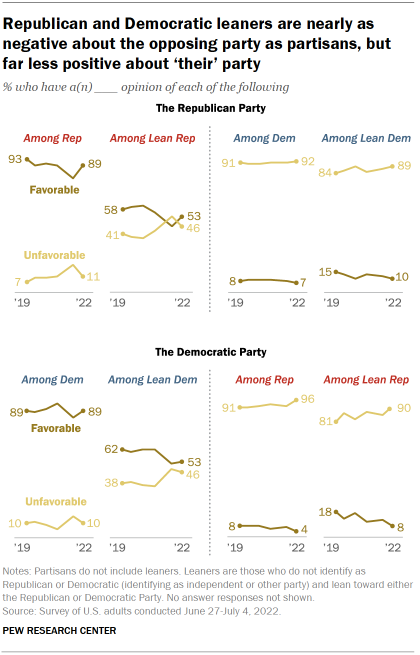
Overwhelming majorities of partisans – those who identify as Republicans or Democrats – view their party positively. About nine-in-ten Republicans and Democrats (both 89%) have a favorable view of their own party. Negative views of the opposing party are also near universal: 92% of Democrats have an unfavorable view of the GOP, while 96% of Republicans view the Democratic Party negatively.
Partisan leaners – those who identify as independent or something else, but lean Democratic or Republican – hold nearly as negative views of the opposing party as do partisan identifiers. Nine-in-ten Republican leaners have an unfavorable view of the Democratic Party, while a nearly identical share of Democratic leaners (89%) have an unfavorable view of the GOP.
But leaners diverge from partisans in that they are far less likely to hold favorable views of the party they lean toward – and these views are more negative today than they were a few years ago. About half of Democratic-leaning independents (53%) now have a favorable opinion of the Democratic Party, down from roughly six-in-ten from 2019 to 2021. Among Republican leaners, 53% now say they have a favorable view of the Republican Party; as recently as two years ago, 61% had a favorable view.
Intensely negative feelings about the opposing party grow
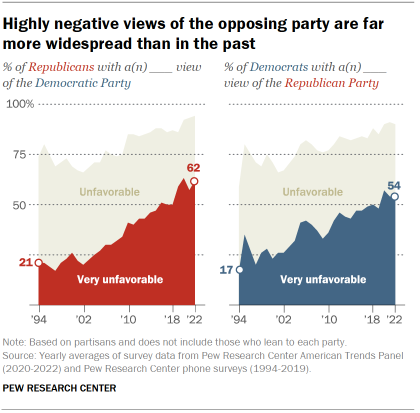
Clear majorities of both Republicans and Democrats have long viewed the other party negatively, but the shares saying their opinions are very unfavorable in recent years is considerably higher today than it was in prior decades.
Across Pew Research Center surveys conducted this year, 62% of Republicans and 54% of Democrats say they holdvery unfavorable views of the other party.
By comparison, 10 years ago, 43% of Republicans and 46% of Democrats had very unfavorable views of the other party. And 10 years before that (in 2002), just two-in-ten Republicans (20%) and about a quarter of Democrats (26%) expressed very unfavorable views of the opposing party.
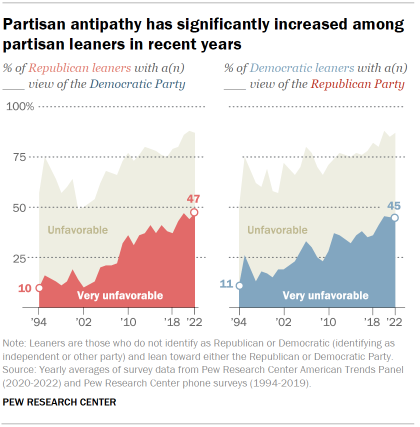
Partisan antipathy has increased not just among partisan identifiers, but also among those who lean to a party.
About half of Republican leaners (47%) have very unfavorable views of the Democratic Party – a substantial increase since 2012, when 36% of Republican leaners held this view, and far higher than the share with very unfavorable views of the Democratic Party in 2002 (10%).
Views of the Republican Party among Democratic leaners have followed the same pattern: 45% of Democratic leaners have a very unfavorable view of the Republican Party in Pew Research Center surveys this year – a significantly larger share than the 36% who said this in 2012 and the 19% who held this view in 2002.
A rise in the share of Americans with unfavorable views of both parties
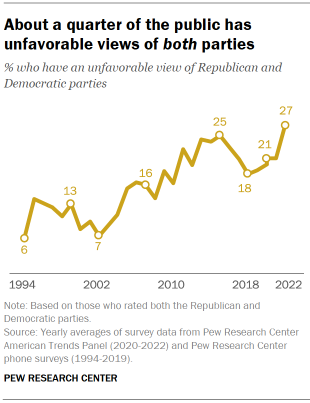
Unfavorable views of both the Republican and Democratic parties have increased among the public over the last two decades.
Today, about a quarter of Americans (27%) have unfavorable views of both parties, a substantial increase from the roughly four times the share who held this combination of views in 2002 (7%). The percentage of the public that expresses unfavorable opinions of both parties is as high as it has been in more than two decades of polling.
Around two-thirds of Americans have a favorable opinion of one party and an unfavorable view of the other: 31% view the GOP favorably but the Democratic Party unfavorably, while 35% rate the Democratic Party favorably while viewing the Republican Party unfavorably. Few Americans (6%) view both of the parties favorably.
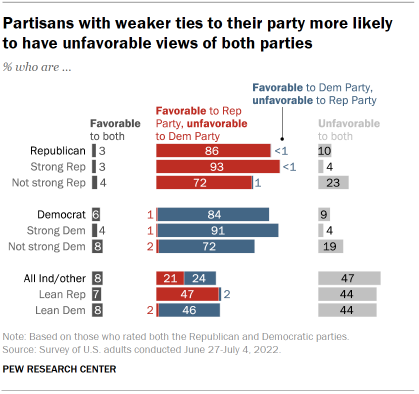
Unfavorable opinions of both parties are concentrated among independents and those with other political affiliations: About half of all independents and others who decline to identify with a party (47%) have unfavorable views of both the Republican and Democratic parties. Those who lean toward the Republican Party and those who lean Democratic are equally likely to view both parties unfavorably (44% for both).
Most Americans who identify with a party – even if the attachment is not strong – have a favorable view of their party and an unfavorable view of the other party. Fully 86% of Republicans and 84% of Democrats view their party favorably but the other unfavorably. About nine-in-ten strong partisans hold this combination of views, compared with about seven-in-ten not strong partisans. About two-in-ten not strong Republicans (23%) and not strong Democrats (19%) see both parties in a negative light.
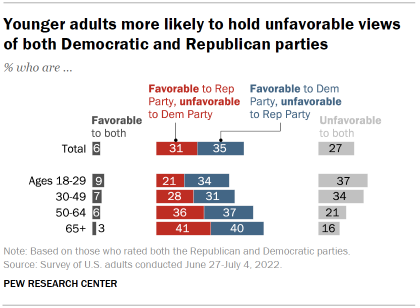
Younger adults are more likely to hold an unfavorable view of both political parties than those who are older: About a third of adults under age 50 (35%) say they hold unfavorable views of both major parties, compared with about two-in-ten of those ages 50 to 64 (21%) and 16% of those 65 and older.
In most age groups, there is a roughly equal balance of opinion between those who have a favorable view of the Republican Party but an unfavorable view of the Democratic Party, and those who have a favorable view of the Democratic Party but an unfavorable view of the Republican Party. Adults ages 18 to 29 are an exception: On balance, a larger share of adults under 30 view just the Democratic Party favorably than just the Republican Party favorably (34% vs. 21%).
The partisan gap in presidential approval ratings has grown over time
There has long been a partisan gap in assessments of presidential performance, with members of the party occupying the White House expressing more positive evaluations of the president’s job performance than those whose party is in opposition. However, the partisan gap has grown in the modern polling era, primarily driven by an increase in negative sentiments from those in the opposing party.
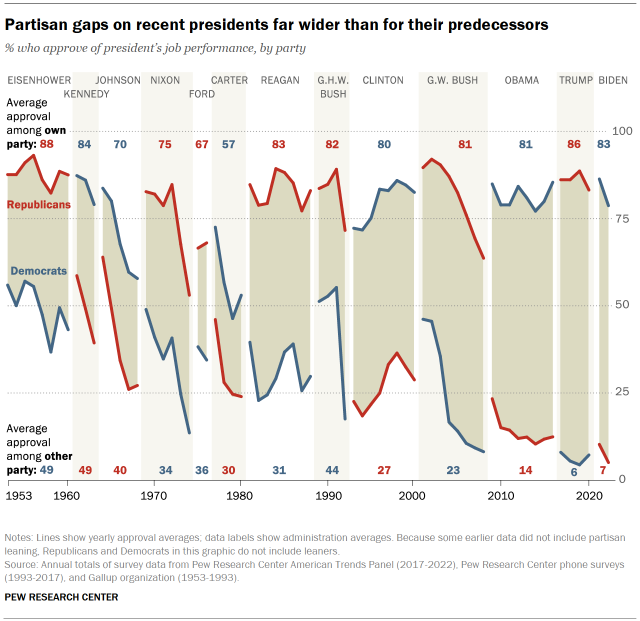
More than six decades ago, President Eisenhower enjoyed an average 88% approval rating from Republicans and a 49% approval rating from Democrats, a 39 percentage point partisan gap. And during Johnson’s presidency, 70% of Democrats, on average, approved of his handling of the job, compared with 40% of Republicans – a partisan gap of 30 points.
In the years since, the partisan divide in presidential ratings has grown relatively steadily, largely as average out-party ratings of the president’s job performance have declined. Across his eight years in office, an average of 23% of Democrats approved of George W. Bush’s performance. That dropped to an average of 14% of Republicans approving of Obama’s performance over his eight years, resulting in average partisan approval gaps of 58 points for Bush and 67 points for Obama.
The partisan gap grew even wider during Trump’s presidency. An average of just 6% of Democrats approved of Trump over the course of his four-year term, while an average of 86% of Republicans did so – a gap of 80 points. The partisan gap in views of Biden’s presidency to date is comparable to the gap during the Trump administration. While views of Biden among Democrats have declined since his first months in office, on average, 83% of Democrats have approved of his job performance over the course of his term. By contrast, an average of 7% of Republicans say they have approved of how Biden handles the job as president – a partisan gap of 76 percentage points.