
While trust in the federal government hovers near a historic low, public views of Congress, the Supreme Court and the president also are quite negative.
However, people’s ratings of the job performance of their own congressional representative – in contrast with views of Congress as a whole – are more positive than negative. Their assessments of their state’s governor also are positive, on balance. Yet both Democrats and Republicans are far more positive about both their governor and their member of Congress when that person shares their partisanship.
By more than two-to-one (56% to 26%), Americans say their local elected officials are doing a good job.
Views of the branches of the federal government
Congress
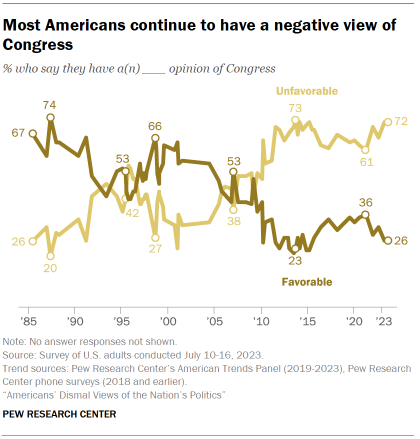
About seven-in-ten Americans (72%) say they have an unfavorable view of Congress, with 26% saying they have a favorable view.
While public views of Congress have been more negative than positive for over a decade, the share of Americans giving Congress an unfavorable rating is now among the highest in nearly four decades of polling.
Throughout much of the 1980s, ’90s and early 2000s, Congress was viewed more favorably than unfavorably. Views were more evenly split in the late 2000s and began to shift in a negative direction over the next several years.
Views of Congress by party
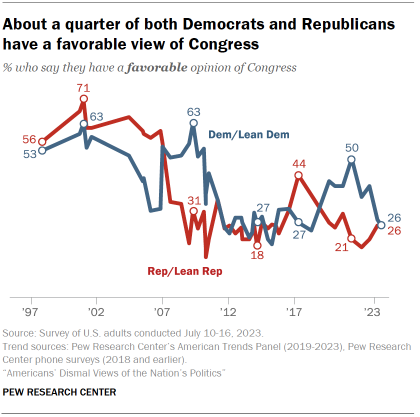
There is no partisan gap in ratings of Congress today, with 26% of both Republicans and Democrats expressing a favorable view of Congress.
Partisans’ ratings of Congress often shift as control of the two chambers shifts. For instance, Democratic favorability of Congress was higher in 2021 and 2022, when the party held control of both the House and Senate.
Conversely, Republican favorability of Congress is now slightly higher than it was in 2022, prior to the GOP taking control of the House. But it remains lower than it was in 2017 and 2018 (when Republicans last held control of both chambers).
House and Senate rated similarly by the public, but partisan gaps reflect chamber control
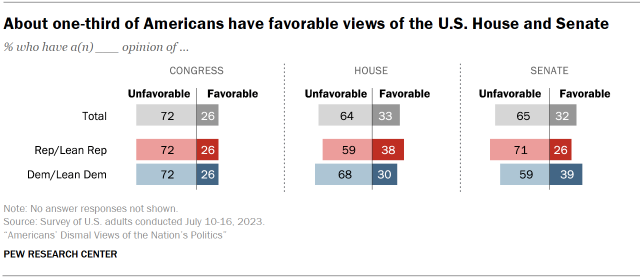
The House of Representatives and the Senate are both viewed somewhat more positively than “Congress”: About a third of Americans view each chamber positively, while 26% say the same of Congress.
This reflects that both Republicans and Democrats feel somewhat more positive about the chamber their party controls than about “Congress.”
For example, while the share of Republicans expressing a positive view of the Senate is identical to the 26% who say this about Congress, 38% of Republicans say they have a favorable view of the House.
Democrats rate both chambers more positively than “Congress.” Still, the pattern is similar, with the Democratic-controlled Senate viewed more positively than the GOP-controlled House (39% vs. 30%).
Supreme Court
Views of the Supreme Court are at their most negative point in more than three decades, with 54% of Americans now saying they have an unfavorable view of the court. The court’s favorable rating has declined 26 percentage points since 2020, primarily driven by a decline in the share of Democrats and Democratic leaners rating the court favorably.
Views of the president
President Joe Biden’s approval rating has hovered below 40% for the last few years, and ratings for his immediate predecessor – Donald Trump – were similarly more negative than positive. Presidents in prior decades tended to have higher approval ratings.
This is, in part, reflective of the rising partisan divide in presidential job approval, which has grown steadily in the past few decades – mostly a result of people in the “out party” becoming less likely to approve of the president.
Through 2022, an average of 82% of Democrats approved of how Biden had handled his job as president, while just 7% of Republicans did. These views are about the reverse of Trump’s approval over his time in office. In contrast, during George W. Bush’s presidency, an average of 23% of Democrats approved of his job performance, and during Bill Clinton’s presidency an average of 27% of Republicans approved of Clinton.
Americans’ ratings of their House member, governor and local officials
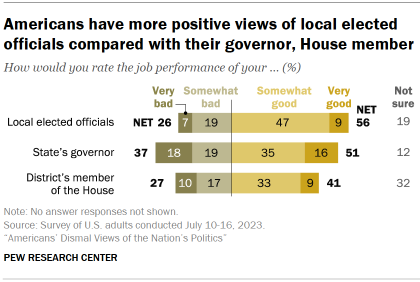
Overall, Americans rate the performance of their own elected officials more positively than negatively.
A 56% majority of U.S. adults say their local elected officials are doing a good job, while fewer than half as many (26%) say they are doing a bad job. About two-in-ten (19%) say they are not sure.
Roughly half of the public (51%) says their state’s governor is doing a good job, while 37% say the governor is going a bad job. Around one-in-ten (12%) say they aren’t sure about their governor’s job performance.
Americans are less likely to offer an opinion of the member of Congress who represents their district, with about a third (32%) declining to do so. But ratings of these officials also are more positive (41% good job) than negative (27% bad job).
Ratings of House member, by party
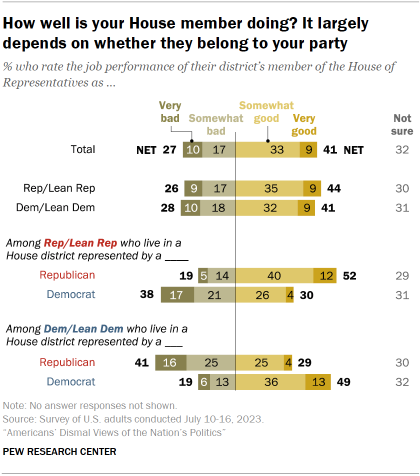
Just as Americans are more approving of the president when they share the president’s party, they are also more likely to say their other elected leaders are doing a good job when they are of the same party. This pattern is evident in Americans’ views of members of the House of Representatives and is even more pronounced in views of governors.
Overall, similar shares of Republicans (44%) and Democrats (41%) say their district’s House member is doing a good job.
However, Republicans in House districts represented by a Republican are far more likely to approve of the job performance of their representatives (52% good job) than are Republicans who live in places with Democratic House members (30% good job).
Similarly, about half of Democrats who live in a district represented by a Democrat (49%) say their House member is doing a good job, while just 29% of Democrats who are represented by a Republican say the same.
Ratings of governors, by party
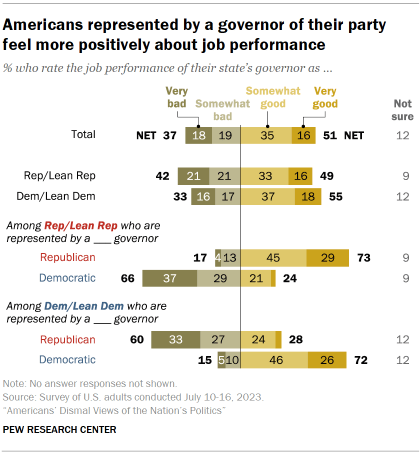
The partisan gap in views of state governors is even wider. Nearly three-quarters of both Democrats and Republicans who are represented by a governor who shares their partisanship say that governor does a good job. By comparison, six-in-ten Democrats and 66% of Republicans who live in states headed up by a governor of the opposing party say their governor does a bad job.
About half of all Republicans and Republican leaners (49%) and 55% of all Democrats and Democratic leaners say their state’s governor is doing a good job.
However, 73% of Republicans who are represented by a Republican governor say their governor does a good job. In contrast, 24% of Republicans living in states with a Democratic governor say the same.
Similarly, Democrats in states with a Democratic governor are far more positive about the job performance of their state’s governor (72% good job) than Democrats in states with a Republican governor (28%).


