
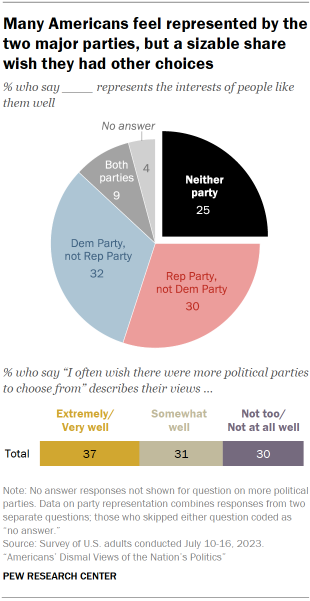
The Democratic and Republican parties are both viewed unfavorably by majorities of Americans. And while most adults say they feel at least somewhat well-represented by at least one of the two parties, a quarter (25%) say neither party represents the interests of people like them even somewhat well.
Reflecting dissatisfaction with the major parties, even among some loyal partisans, many Americans continue to be open to the possibility of having more political parties. Younger adults and those with loose partisan attachments are particularly likely to express a desire for more parties.
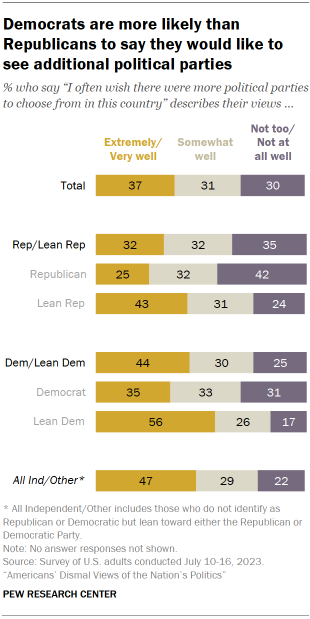
Among all U.S. adults, 37% say “I wish there were more political parties to choose from” describes their views extremely or very well; another 31% say it describes their feelings somewhat well.
Additional parties, however, are not seen as a promising fix for the country’s gridlock. Only about a quarter of Americans (26%) say having more than two major parties would make it easier to solve the country’s problems. A nearly identical share (24%) say it would make this harder.
And just a third think it is likely an independent candidate will win the White House in the next 25 years; 66% view this possibility as very or somewhat unlikely.
How different are the Republican and Democratic parties?
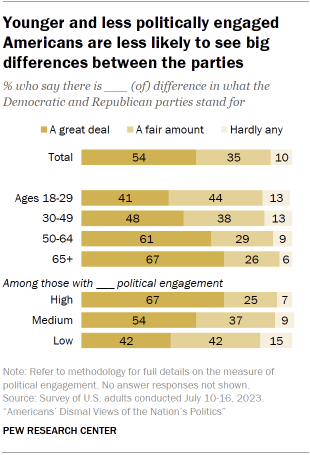
A narrow majority of Americans (54%) say there is a great deal of difference between what the Republican and Democratic parties stand for. Another 35% say there is a fair amount of difference in their values, while just 10% say there is hardly any difference between the two parties.
The share seeing a great deal of difference between the parties hasn’t changed much in recent years, but Americans remain more likely to see major differences between the parties than they were a few decades ago.
These views continue to vary by age, political engagement and the strength of a person’s ties to a party.
Age
Among adults ages 18 to 29, fewer than half (41%) say there is a great deal of difference in what the parties stand for. Older age groups are more likely to see big differences between the parties, with those 65 and older most likely to say this.
Level of political engagement
Two-thirds of the most politically engaged Americans think there is a great deal of difference between the parties. Slightly more than half of those with medium engagement (54%) and 42% of those with low engagement say the same. Political engagement is based on people’s interest in politics, as well as how often they follow government and public affairs and discuss politics.
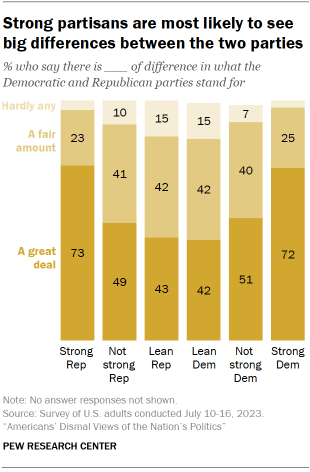
Strength of partisanship
Nearly three-quarters of strong Republicans (73%) and 72% of strong Democrats say there is a great deal of difference between the parties, compared with smaller shares of those who affiliate with a party, but not strongly, and those who lean to a party.
Views of how well the parties represent people’s interests
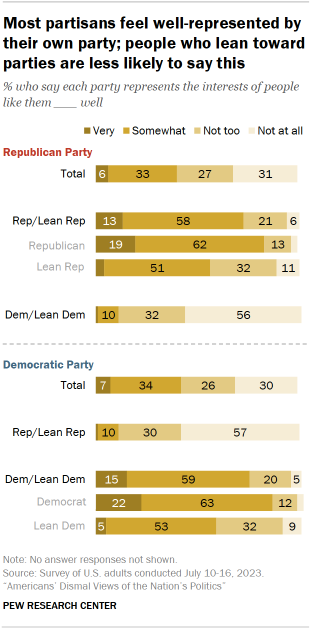
Large shares of Americans who identify with the Republican or Democratic Party say they feel well-represented – though relatively few feel very well-represented.
Those who only lean toward a party, by contrast, tend to be more skeptical of how well their party represents them.
- 71% of all Republicans and Republican-leaning independents say their party represents their interests very or somewhat well. Those who affiliate with the Republican Party are more likely to express this view (82%) than those who lean toward the GOP (55%).
- There are similar differences between Democrats and Democratic leaners. More than eight-in-ten Democrats (85%) say they feel well-represented, compared with 58% of Democratic-leaning independents.
Most Americans feel represented by at least one of the parties
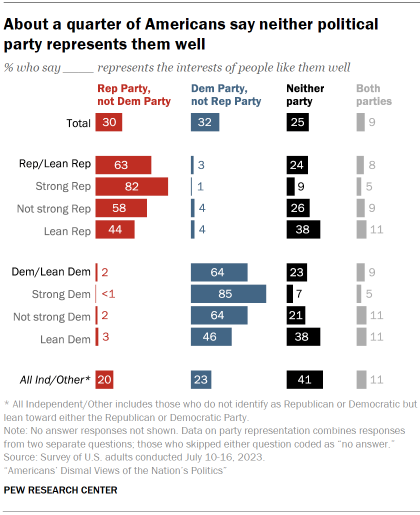
Among all U.S. adults, roughly a third say they feel well-represented by the Democratic Party, but not the Republican Party; about as many (30%) feel represented by the Republican Party but not the Democratic Party.
A quarter (25%) say neither party represents them well, while 9% feel well-represented by both parties.
About four-in-ten independents and those who identify with other parties (41%) say neither major party represents people like them well. Identical shares of independents who lean toward the GOP and the Democratic Party (38% each) say neither party represents them well.
Demographic differences in people’s views of which party, if any, represents them well
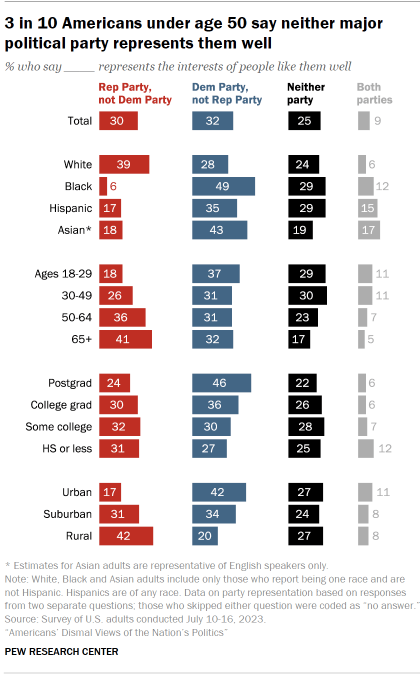
Americans’ views of how well the Republican and Democratic parties represent the interests of people like them vary across race, ethnicity, age, education and community type. These patterns largely mirror groups’ party identification and voting patterns.
More Republican-oriented demographic groups, such as older people, White adults and rural residents, are more likely to say the Republican Party, rather than Democratic Party, represents them well.
The reverse is true for Democratic-oriented groups, such as Black, Hispanic and Asian adults, as well as people with a postgraduate degree.
While three-in-ten adults under age 50 say neither party represents them well, a smaller share of people 50 and older (20%) say this.
What if there were more political parties?
Independents and those who identify with other parties are more supportive of the idea of having more parties to choose from.
Nearly half of all independents (47%) say they wish for more parties. However, a larger share of independents who lean toward the Democratic Party say this than among those who lean toward the Republican Party (56% vs. 43%, respectively).
People who identify as Democrats also are more interested than Republican identifiers in having additional parties. Democratic identifiers are 10 percentage points more likely than GOP identifiers to say that wishing for more parties describes their views extremely or very well (35% vs. 25%).
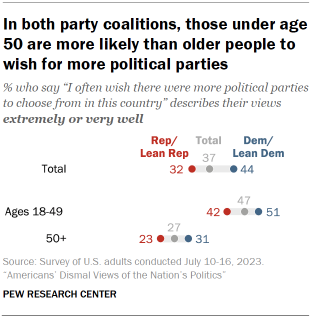
Republicans and Democrats (including leaners) ages 18 to 49 are about 20 points more likely than older members of their parties to say they wish there were more political parties to choose from in this country. About half of Democrats under age 50 (51%) say this, as do 42% of their Republican peers. By comparison, 31% of Democrats and 23% of Republicans 50 and older say the same.
Would more parties make solving problems easier or harder?
Despite the interest in having more parties to choose from, only 26% of the public says it would make the country’s problems easier to solve.
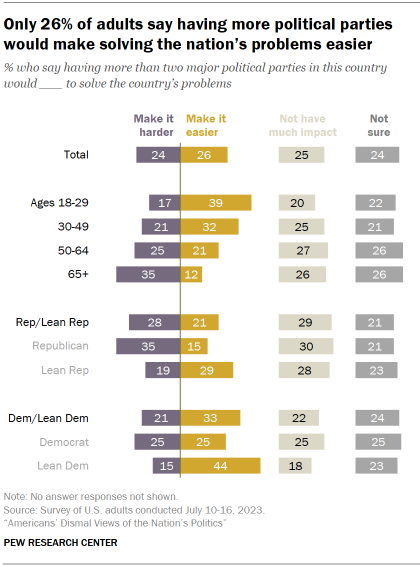
A similar share of Americans say having more major parties would make solving problems harder (24%). Another quarter say more parties wouldn’t have an impact on the nation’s ability to solve its problems, while 24% are unsure what impact it would have.
Younger adults are more likely than older Americans to say that more major parties would make it easier to address the country’s problems. About four-in-ten adults ages 18 to 29 say this, compared with 12% of those 65 and older.
Partisan leaners also are more likely than partisans to say that more political parties would make it easier to address the country’s problems. More than four-in-ten Democratic leaners (44%) and about three-in-ten Republican leaners (29%) say it would make solving problems easier. This compares with a quarter of those who identify as Democrats and 15% of Republican identifiers.
How likely is it that an independent candidate will become president?
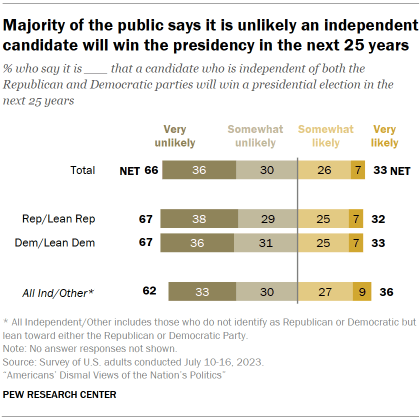
Few Americans think a candidate independent of the Republican and Democratic parties will win a presidential election in the next 25 years. About two-thirds of adults (66%) say it is very (36%) or somewhat unlikely (30%) this will happen.
There are no partisan differences in these expectations, and independents are only slightly more likely than partisan identifiers to say this is likely.
Two-thirds in both partisan coalitions say this is unlikely, as do 62% of independents and those who identify with other parties (including 66% of Republican-leaning independents and 64% of Democratic-leaning independents).
Americans who feel unrepresented by the parties have highly negative views of the political system
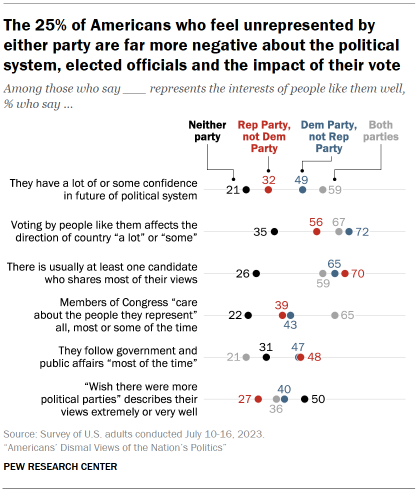
Compared with those who say they feel represented by the Republican or Democratic parties, the quarter of Americans who say neither party represents them well stand out for their negative views of much of the U.S. political system.
- Those who feel unrepresented by the parties are less optimistic about the future of the political system. Just 21% of Americans who feel unrepresented by both parties say they have a lot of or some confidence in the future of the system. This compares with 32% of those who feel represented well by the Republican Party, 49% of those who feel represented by the Democratic Party and 59% of those who say both parties represent them well.
- Adults who feel unrepresented doubt voting “by people like them” can impact the direction of the country. At least half of those who feel represented by the GOP (56%) or the Democrats (72%) say that their votes can affect the direction of the country at least some. By contrast, a far smaller share (35%) of those who feel unrepresented say this.
- Americans who say they are unrepresented by the parties also say political candidates do not share their views. About a quarter of those who say neither party represents them well (26%) say there is usually at least one candidate who shares their views. But clear majorities of those who feel represented by at least one of the two major parties say there is usually a candidate with their views.
- Negative evaluations of members of Congress are higher among those who feel neither party represents them. About four-in-ten of those who are represented well by one party but not the other (39% of those represented by the GOP and 43% of those represented by the Democrats) say members of Congress care about the people they represent at least some of the time. The share saying this falls to 22% among those who say neither party represents them well.
- Americans who feel unrepresented by the parties pay less attention to government and public affairs. About three-in-ten Americans who feel unrepresented by a major party (31%) say they follow government most of the time, compared with about half of those who say one of the two parties but not the other represents them well. (The 9% of Americans who feel well-represented by both parties are the least likely to be politically attentive.)
- The desire for more political parties is higher among those who feel unrepresented by both parties. Half of those unrepresented by the parties say they “wish there were more political parties,” compared with four-in-ten or fewer in the other groups.
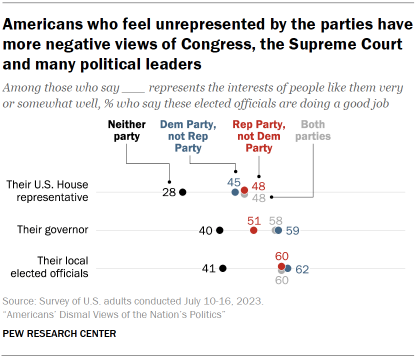
The Americans who say neither the Republican Party nor the Democratic Party represent people like them well give consistently lower job ratings to their district’s House representative, state governor and local elected officials:
- 28% in this group say their U.S. representative is doing a good job. Nearly half of those who feel well-represented by at least one of the two major parties view their representative’s performance positively.
- 40% who feel unrepresented say their governor does a good job. At least half of those in other groups approve of their governor’s performance.
- While about six-in-ten of those who feel well-represented by at least one party view their local elected officials’ job performance positively, a far smaller share (41%) of those who don’t feel well-represented say this.
