
In evaluating the current and future state of politics in the United States, Americans express largely negative views. And trust in the federal government, which has been low for nearly two decades, hovers near record lows.
Only 4% of Americans now say the political system is working extremely or very well, with nearly three-quarters saying it isn’t. A majority (63%) say they have little or no confidence in the future of the U.S. political system.
Views of Congress, the Supreme Court and the political parties also remain deeply – and in some cases, historically – negative.
Meanwhile, there are wide partisan differences in views of several aspects of federal-state relations. Democrats are far more likely than Republicans to say they are very or extremely concerned that a person’s rights and protections might vary depending on which state they are in.
By contrast, a much larger share of Republicans than Democrats express concern that the federal government is doing too much on issues better left to state governments.
Evaluations of the political system
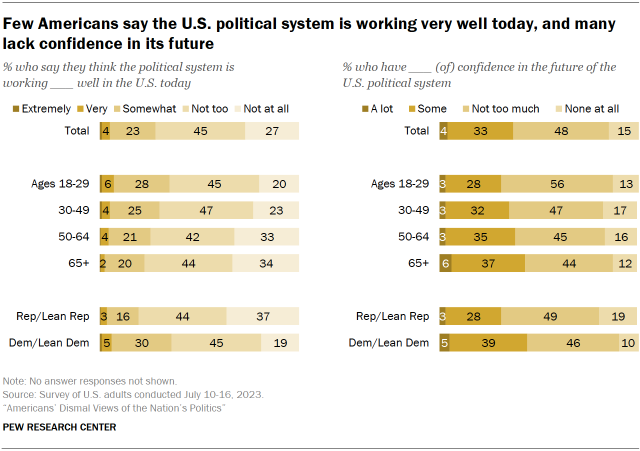
Only 4% of the public says the political system in the U.S. is working extremely or very well today, while 23% say it is working somewhat well. About seven-in-ten (72%) say the system is working not too (45%) or not at all (27%) well.
Looking to the future of the system, about six-in-ten Americans (63%) say they have not too much or no confidence at all. A third say they have some confidence, and just 4% express a lot of confidence.
Age
Younger adults are somewhat more likely than older adults to say the political system is working well: 35% of adults under age 30 say the system is working at least somewhat well, compared with 29% of those 30 to 49 and 24% of those 50 and older.
But older people are more likely to express confidence when it comes to the future of the U.S. political system. About four-in-ten adults 65 and older (43%) say they have at least some confidence in the future of the political system. That drops to three-in-ten among adults under 30.
Party
Republicans are more likely than Democrats to express negative views of the political system.
Roughly eight-in-ten Republicans and Republican-leaning independents (81%) say the political system is working not too or not at all well, including more than a third (37%) who say it is working not at all well. Among Democrats and Democratic leaners, 64% say the political system is working either not too or not at all well, with 19% saying it is not working well at all.
Older Republicans are particularly likely to say the system is not working well: 88% of Republicans 50 and older say this, compared with 77% of those 30 to 49 and 61% of those under 30. Democrats do not differ by age on this question.
Republicans also express less confidence in the future of the U.S. political system: 68% of Republicans and 56% of Democrats say they have not too much or no confidence at all in its future. While Republicans of all age groups are about equally likely to have confidence in the political system’s future (31% have a lot of or some confidence), older Democrats are more likely to say this than younger Democrats. A majority of Democrats 50 and older (54%) say they have at least some confidence, compared with 37% of those under 50.
Trust in the federal government
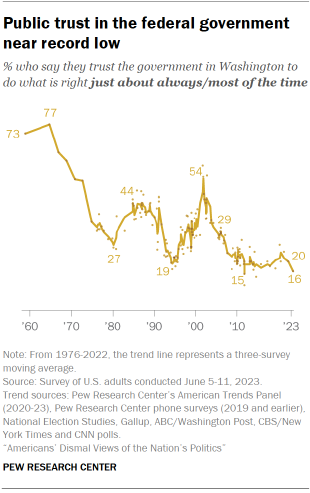
Just 16% of Americans say they trust the government in Washington to do the right thing just about always or most of the time. While public trust in government has been low for nearly two decades, the current measure is among the lowest in more than 70 years of polling.
Trust in the federal government is down 4 percentage points from last year and was somewhat higher in 2020 and 2021. The current measure is on par with public views in 2019.
For more on trust in the federal government over the last 70 years, please visit our trust interactive.
Trust in government by party
As in the past, trust in government is higher among those whose party holds the presidency. Today, a quarter of Democrats say they trust the government to do what is right at least most of the time, compared with just 8% of Republicans.
Democrats’ trust in government is now substantially higher than it was during the Trump administration but is down 8 points from the spring of 2021. In contrast, Republicans’ trust in government dropped between 2020 and 2021 but has changed little over the last few years.
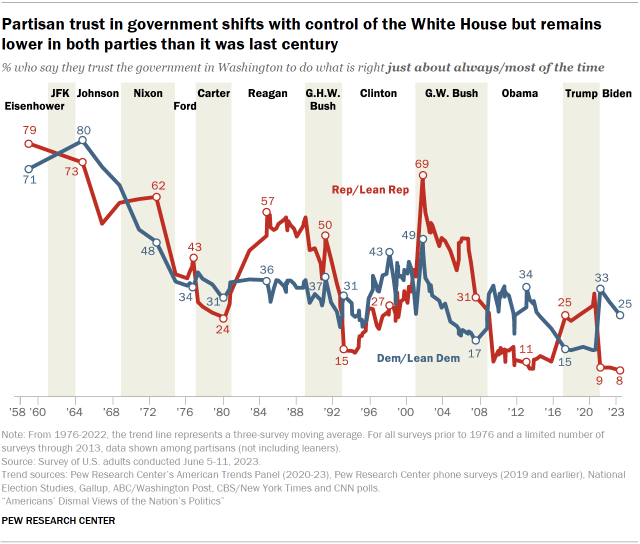
Republicans’ current level of trust in the federal government is among the lowest since the question was first asked in the 1950s. Prior to Joe Biden’s presidency, GOP trust in government had only hit similar lows during the Obama administration.
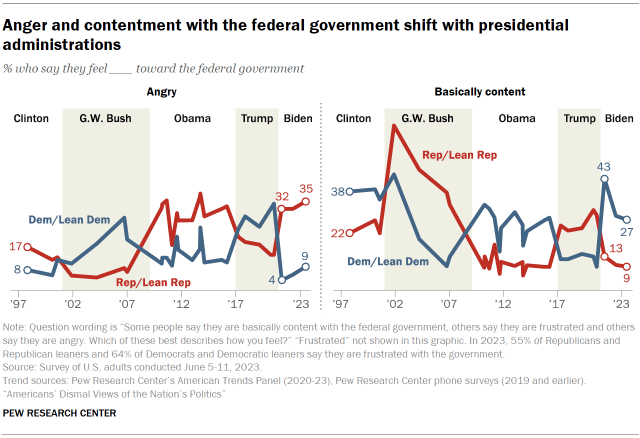
Feelings toward the federal government
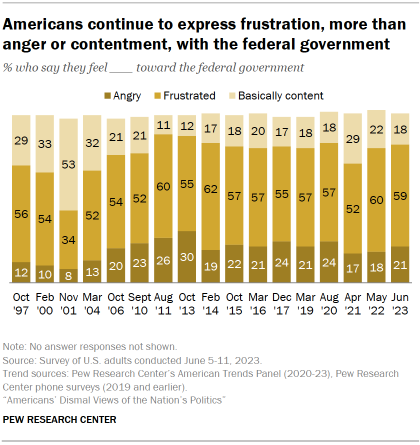
As has been the case for more than a decade, a majority of Americans (59%) say they feel frustrated toward the federal government. About two-in-ten (21%) say they feel angry toward the government, while 18% say they are basically content.
These views have changed only modestly in recent years. A slightly higher share express anger today than did so last year and the year before. Anger is now slightly lower than it was in the summer of 2020.
Feelings about the federal government by party
The share of Democrats and Democratic leaners saying they are basically content with the government is similar to the share who said the same a year ago (27% today, 29% then). In 2021, Democrats were 16 percentage points more likely to say they felt content toward the government. Nearly two-thirds of Democrats (64%) express frustration toward the government, a share unchanged in the last year but 12 points higher than in 2021. The share of Democrats who say they are angry remains low – 9% say this today – but is up 5 points since 2021.
About a third of Republicans and Republican leaners (35%) say they feel angry toward the federal government, while 55% say they feel frustrated and just 9% say they feel content. These figures are largely unchanged in recent years.
The relationship between the federal and state governments
Majority of Americans concerned rights and protections may be different in different states
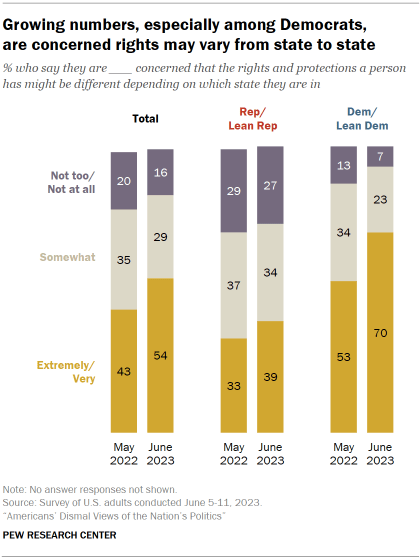
A majority of Americans (54%) now say they are extremely or very concerned that the rights and protections a person has might be different depending on which state they are in. About three-in-ten (29%) say they are somewhat concerned about this, while 16% are not too or not at all concerned.
The share reporting they are extremely or very concerned about this has risen 11 points since May of 2022.
Democrats are particularly likely to express concern that rights and protections may vary across states. Seven-in-ten Democrats now say they are extremely or very concerned about this, up from 53% a year ago.
Among Republicans, the share who say they are at least very concerned is up 6 points, from 33% to 39%.
Some concerned the federal government is doing too much that should be left to states
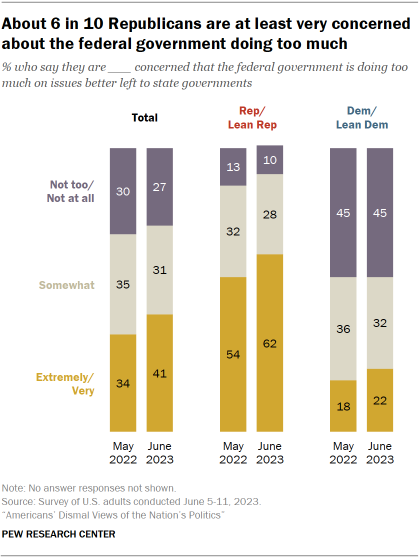
The share expressing concern about the federal government doing too much on issues better left to state governments has also risen over the past year: 41% now say they are extremely or very concerned about this, compared with 34% in May 2022.
Republicans express higher levels of concern than Democrats that the federal government is doing too much. Roughly six-in-ten Republicans (62%) are extremely or very concerned about this, compared with 22% of Democrats.
The share of Republicans who are at least very concerned is up 8 points in the past year, while the share of Democrats who say this has increased by 4 points.
Some concerned states are not willing enough to work with the federal government
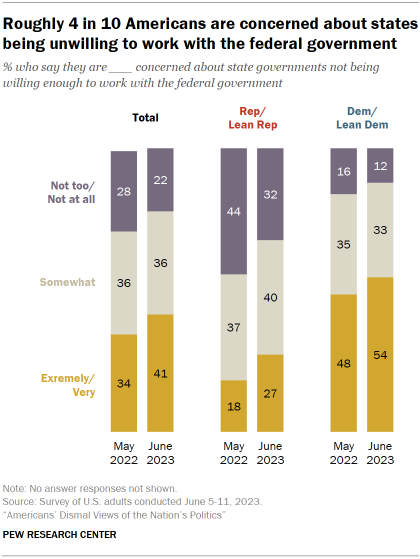
Overall, 41% of U.S. adults say they are extremely or very concerned about state governments not being willing enough to work with the federal government, up from 34% last year. Roughly a third (36%) say they are somewhat concerned about this, while 22% say they are not too or not at all concerned.
Democrats are more likely than Republicans to say they are concerned about state governments not being willing enough to work with the federal government: A majority of Democrats (54%) are extremely or very concerned about this. Just 27% of Republicans share that concern.
The share in each party who say they are at least very concerned about state governments’ unwillingness to work with the federal government has increased since 2022, by 9 points among Republicans and 6 points among Democrats.


