
It’s a question that has divided political analysts for years: Which is the bigger factor in a party’s electoral success – persuading voters to switch from their usual party, or getting more party loyalists to vote?
Pew Research Center conducted this study to better understand which voters cast ballots in the 2022 midterm elections and how they voted. We also wanted to compare how turnout and vote choices differed from previous elections in 2020, 2018 and 2016. Measuring turnout among different groups in the electorate is challenging; it is particularly difficult to assess changes in turnout from election to election.
Panel data provides us a unique opportunity to study elections. By surveying the same people over time, we can more clearly see how differences in who stays home – and who turns out to vote –impact each election. We can also measure how adults’ partisan voting preferences change (or do not change) between elections.
For this study, we surveyed U.S. adults online on our nationally representative American Trends Panel (ATP). We verified their turnout in the four general elections using commercial voter files that aggregate publicly available official state turnout records. Panelists who said they voted and for whom a voting record was located are considered validated voters; all others are presumed not to have voted.
Additionally, we revised our statistical approach for the 2020 survey. That produced new results that slightly changed the numbers we reported about the 2020 election but changed no substantive findings in our report.
Here are the questions used for this report, along with responses, and its methodology.
American Trends Panel: Pew Research Center’s online probability survey panel, which consists of more than 12,000 adults who take two to three surveys each month. Some panelists have been participating in surveys since 2014.
Defectors/Defection: People who either switch their vote to a different party’s candidate from one election to the next, or those who in a given election do not support the candidate of the party they usually support. Also referred to as “vote switching.”
Drop off/Drop-off voters: People who vote in a given election but not in a subsequent election. The term commonly refers to people who vote in a presidential election but not in the next midterm. It can also apply to any set of elections.
Midterm elections: General elections held in all states and the District of Columbia in the even-numbered years between presidential elections. All U.S. House seats are up for election every two years, as are a third of U.S. Senate seats (senators serve six-year terms).
Mobilize: Efforts by candidates, political campaigns and other organizations to encourage or facilitate eligible citizens to turn out to vote.
Nonvoter: Defined in our study as a person who says in a post-election survey they did not vote in the election, or their voting record cannot be located in a voter file.
Panel survey: A type of survey that relies on a group of people who have agreed to participate in multiple surveys over a time period. Panel surveys make it possible to observe how individuals change over time because the answers they give to questions in a current survey can be compared with their answers from a previous survey.
Party affiliation/Party identification: Psychological attachment to a particular political party, either thinking of oneself as a member of the party or expressing greater closeness to one party than another. Our study categorizes adults as Democrats or Republicans using their self-reported party identification in a survey.
Split-ticket voting/Straight-ticket voting: Voters typically cast ballots for more than one office in a general election. People who vote only for candidates of the same party are “straight-ticket” voters, while those who vote for candidates of different parties are “split-ticket” voters.
Turnout: Refers to “turning out” to vote, or simply “voting.” Also used to refer to the share of eligible adults who voted in a given election (e.g., “The turnout in 2020 among the voting eligible population in the U.S. was 67%”).
Validated voter/Verified voter: A person in a survey who says they voted in an election and who has a voter file record of voting. (The two terms are interchangeable.)
Voter file: A list of adults that includes information such as whether a person is registered to vote, which elections they have voted in, whether they voted in person or by mail, and additional data. Voter files do not say who a voter cast a ballot for. Federal law requires states to maintain electronic voter files, and businesses assemble these files to create a nationwide list of adults along with their voter information.
The correct answer, of course, is “both.” However, a new Pew Research Center analysis of the 2022 midterm elections underscores the power of partisan mobilization.
The analysis shows that relatively few people who voted in the 2018 midterms were persuaded to vote for a different party four years later.
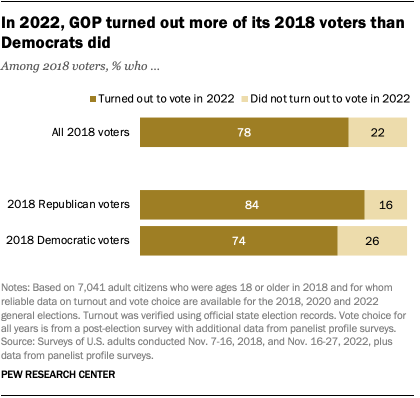
But when it comes to mobilizing voters, Republicans benefited more than Democrats did, with more of their 2018 voters turning out (i.e., casting a ballot) again in 2022. Republicans also won handily among 2022 voters who had not voted in 2018.
For a variety of reasons, the result of the 2022 midterms was hardly the sweeping victory that Republicans had hoped for. Yet the GOP won 51%-48% among all votes cast for the U.S. House, which was a marked improvement over its 9 percentage point popular vote deficit in the national vote for the House in 2018. This helped them gain a slight majority of House seats in the new Congress.
Among the main findings from the study:
- Few voters changed their party choice
 between 2018 and 2022. Just 3% of voters who cast ballots in 2018 and 2022 changed from a Democratic to a Republican House candidate, and only 2% changed from a Republican to a Democratic candidate.
 - Turnout differences favored Republican candidates; 84% of those who voted Republican in 2018 turned out in 2022, while just 74% of those who voted Democratic did so. Since the vast majority of these voters stuck with the party of their 2018 vote, the net effect benefited Republican candidates in 2022.
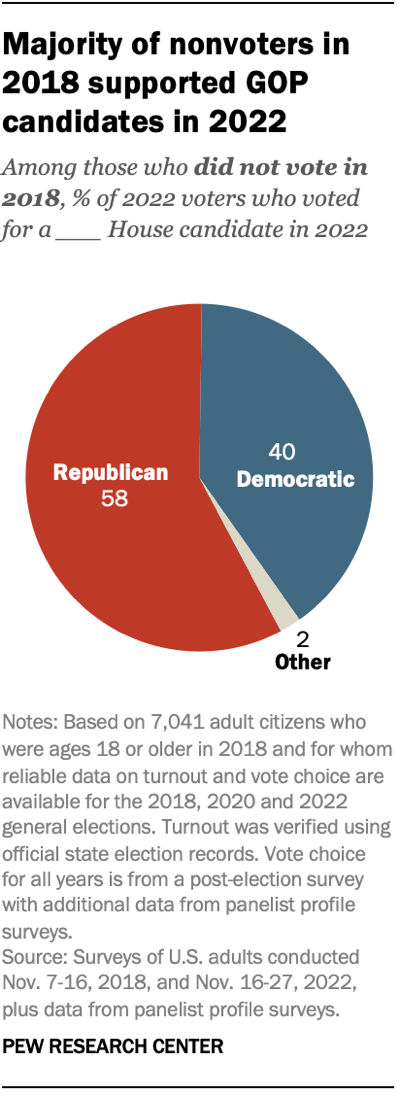
- 2018 nonvoters helped Republican candidates in 2022. About a fifth (21%) of those who voted in 2022 had not done so in 2018. These voters favored Republican candidates by a margin of 58%-40% in 2022.
In addition to documenting partisan mobilization, the Center’s new study examines how various subgroups of Americans voted in the 2022 midterms:
- Women voters narrowly voted Democratic. Women supported Democratic candidates by a slight margin (51%-48%) – a sizable shift from 2018, when they favored Democratic candidates by 18 points (58%-40%).
This change was not because large numbers of women switched their votes from Democratic to Republican candidates. Rather, turnout among those who voted in 2018 was higher among Republican women than Democratic women. In addition, women voters who had not voted in 2018 favored Republican candidates by a margin of 56%-41% in 2022.
- Hispanic voters continued to support Democrats, but by a smaller margin. Hispanic voters supported Democratic candidates by a 60%-39% margin in 2022. But that was far below the 47-point advantage Democrats had enjoyed among Hispanic voters four years earlier (72%-25%).
This change was mostly driven by differences in voter turnout among Hispanic adults, rather than changing preferences among individual Hispanic voters.
- Republicans made gains among rural voters. Rural voters have tended to vote
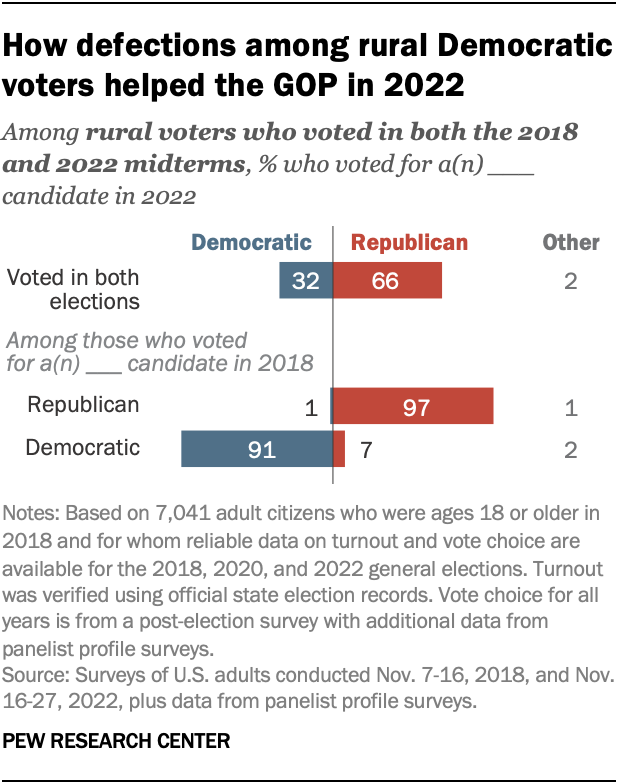 Republican for many years, but the GOP advantage increased substantially between 2018 and 2022. Republicans won rural voters by 40 points (69%-29%), nearly double their 21-point advantage four years earlier.
In contrast with many other groups, this shift came both from greater turnout among 2018 Republican voters and changing voter preferences. More rural voters changed their vote from a Democratic to a Republican candidate between 2018 and 2022 than the reverse.
Note: Here are the questions used for this report, along with responses, and its methodology.
