
Even before large pieces of the federal government shut down in October 2025, the Supplemental Nutrition Assistance Program, or SNAP – sometimes called the food stamp program – was in for some big changes.
The tax, spending and policy bill passed by Congress earlier this year expanded work requirements for SNAP, tightened eligibility rules, imposed new cost-sharing obligations on states and made other changes to the program. The Congressional Budget Office has estimated that the changes will reduce federal spending on SNAP by $186.7 billion over the next decade.
But the 43-day shutdown created further challenges for the program, which helps nearly 42 million Americans put food on the table. While October benefits were paid in full and on time, November’s payments got caught up in a tangle of lawsuits, conflicting court rulings and short-term, state-level fixes. The law reopening the government funds SNAP through September 2026, the end of the current fiscal year.
Here’s a closer look at the food stamp program, based on data from the U.S. Department of Agriculture (whose Food and Nutrition Service administers SNAP), the Census Bureau and other sources.
- How many Americans use food stamps?
- How has the number of food stamp recipients changed over time?
- Who is eligible for food stamps?
- What work requirements are there for receiving food stamps?
- What do we know about food stamp recipients in the U.S.?
- How much do food stamp recipients get each month?
- Where is food stamp usage highest and lowest?
- What can you buy with food stamps? What can’t you buy?
- Where can people use food stamps? Where do they use them most frequently?
- How much does the federal government spend on food stamps each year?
- How has the cost of the food stamp program changed over time?
- Why are they called “food stamps,” anyway?
How many Americans use food stamps?
The numbers vary from month to month. But in May 2025, the most recent month with available figures, 41.7 million people in 22.4 million households received SNAP benefits. That works out to nearly 1 in every 8 people in the country.
On average, 42.4 million people in 22.7 million households received monthly SNAP benefits through the first eight months of the 2025 fiscal year (October 2024 to May 2025).
SNAP operates in all 50 states, the District of Columbia, Guam and the Virgin Islands. A separate program provides nutrition assistance grants to Puerto Rico, American Samoa and the Northern Mariana Islands.
How has the number of food stamp recipients changed over time?

| Year | Recipients | Households |
|---|---|---|
| 1980 | 21,082,012 | 7,500,447 |
| 1981 | 22,429,574 | 8,215,412 |
| 1982 | 21,717,398 | 7,906,747 |
| 1983 | 21,624,639 | 7,851,018 |
| 1984 | 20,853,632 | 7,593,927 |
| 1985 | 19,899,052 | 7,331,142 |
| 1986 | 19,429,102 | 7,213,148 |
| 1987 | 19,113,129 | 7,132,443 |
| 1988 | 18,645,291 | 7,055,594 |
| 1989 | 18,806,463 | 7,231,080 |
| 1990 | 20,048,978 | 7,795,796 |
| 1991 | 22,624,627 | 8,877,435 |
| 1992 | 25,406,985 | 10,060,308 |
| 1993 | 26,986,775 | 10,790,246 |
| 1994 | 27,473,696 | 11,091,217 |
| 1995 | 26,618,773 | 10,879,367 |
| 1996 | 25,542,531 | 10,548,913 |
| 1997 | 22,858,137 | 9,454,705 |
| 1998 | 19,790,985 | 8,249,658 |
| 1999 | 18,182,538 | 7,668,481 |
| 2000 | 17,194,334 | 7,351,316 |
| 2001 | 17,318,458 | 7,449,156 |
| 2002 | 19,095,637 | 8,194,746 |
| 2003 | 21,249,626 | 9,152,912 |
| 2004 | 23,810,742 | 10,277,379 |
| 2005 | 25,628,456 | 11,195,797 |
| 2006 | 26,548,833 | 11,732,776 |
| 2007 | 26,316,045 | 11,787,765 |
| 2008 | 28,222,630 | 12,727,450 |
| 2009 | 33,489,975 | 15,232,115 |
| 2010 | 40,301,878 | 18,618,436 |
| 2011 | 44,708,726 | 21,072,113 |
| 2012 | 46,609,072 | 22,329,713 |
| 2013 | 47,636,090 | 23,052,396 |
| 2014 | 46,663,616 | 22,743,911 |
| 2015 | 45,766,672 | 22,522,261 |
| 2016 | 44,219,363 | 21,777,938 |
| 2017 | 42,316,550 | 20,897,709 |
| 2018 | 40,775,728 | 20,209,268 |
| 2019 | 35,702,472 | 17,964,076 |
| 2020 | 39,852,778 | 20,487,155 |
| 2021 | 41,603,712 | 21,706,157 |
| 2022 | 41,208,251 | 21,620,718 |
| 2023 | 42,176,946 | 22,309,532 |
| 2024 | 41,702,652 | 22,206,578 |
| 2025 | 42,406,479 | 22,689,984 |
The program now known as SNAP began in 1964 but took several years to ramp up. It wasn’t until July 1974 that states – which share administrative duties over SNAP with the federal government – were required to extend it to all jurisdictions within their borders. That year, 12.9 million people, or 6.1% of the resident U.S. population at the time, received SNAP benefits.
Program participation has ebbed and flowed over the ensuing decades, driven both by changes in economic conditions and eligibility rules. More people file for SNAP benefits during recessions, and participation generally doesn’t fall back until recoveries have fully taken hold.
For instance, between fiscal years 1980 and 2008, the share of all U.S. households receiving SNAP benefits stayed between about 7% and about 11%. But that percentage rose rapidly during the Great Recession, peaking at 18.8% in fiscal 2013 – representing 47.6 million people.
In March 2020, as the nation headed into COVID-19 lockdowns, Congress authorized extra SNAP benefits for recipients and suspended work and training requirements for the duration of the declared public health emergency. The number of recipients immediately jumped, from 37.2 million to 40.9 million in April 2020. Participation eventually reached just over 43 million recipients in September 2020, or 13% of the resident population.
Who is eligible for food stamps?
In general, a household qualifies for SNAP if it has a gross monthly income at or below 130% of the federal poverty level, as well as a net monthly income at or below 100% of the federal poverty level. For a family of four, this currently works out to $3,483 in gross monthly income and $2,680 in net monthly income. (These limits are higher in Alaska, Hawaii, Guam and the Virgin Islands.)
Households with people ages 60 and older or with disabilities only have to meet the net income requirement. And households of all types are limited in how much they can have in cash, investments and other assets and still qualify for SNAP. In addition, the policy law enacted by Congress in July 2025 places new restrictions on how households can deduct expenses for utilities and internet service from their gross income.
Households receiving other types of aid, such as Temporary Assistance for Needy Families (TANF) or Supplemental Security Income (SSI), may be eligible for SNAP automatically.
States have a certain degree of latitude in how they administer the SNAP program. For example, they can decide how broadly to extend its benefits to people receiving other TANF-funded benefits, whether to count vehicles as household assets, and whether to count child support payments as income. In addition, there are somewhat different eligibility rules for Alaska, Hawaii, Guam and the Virgin Islands.
What work requirements are there for receiving food stamps?
To receive SNAP benefits, most Americans ages 16 to 59 who aren’t disabled must register with their state SNAP agency or employment office; meet any work, job search or job training requirements set by their state; accept a suitable job if one is offered to them; and work at least 30 hours a week. Failure to comply with these rules can disqualify people from benefits.
In addition, nondisabled adults without dependents must either work or participate in a work program for 80 hours a month, or participate in a state workfare program. If they fail to do so, they can only receive SNAP benefits for three months out of any 36-month period.
Until recently, this additional work requirement only applied to people ages 18 to 49. A deal that resolved the 2023 debt-limit standoff raised the maximum age to 54, and the big domestic policy law enacted by Congress earlier this year raises it further, to 65. That law also removes exemptions from the work requirements for veterans, homeless people and young adults who have aged out of foster care, and it adds exemptions for Native Americans.
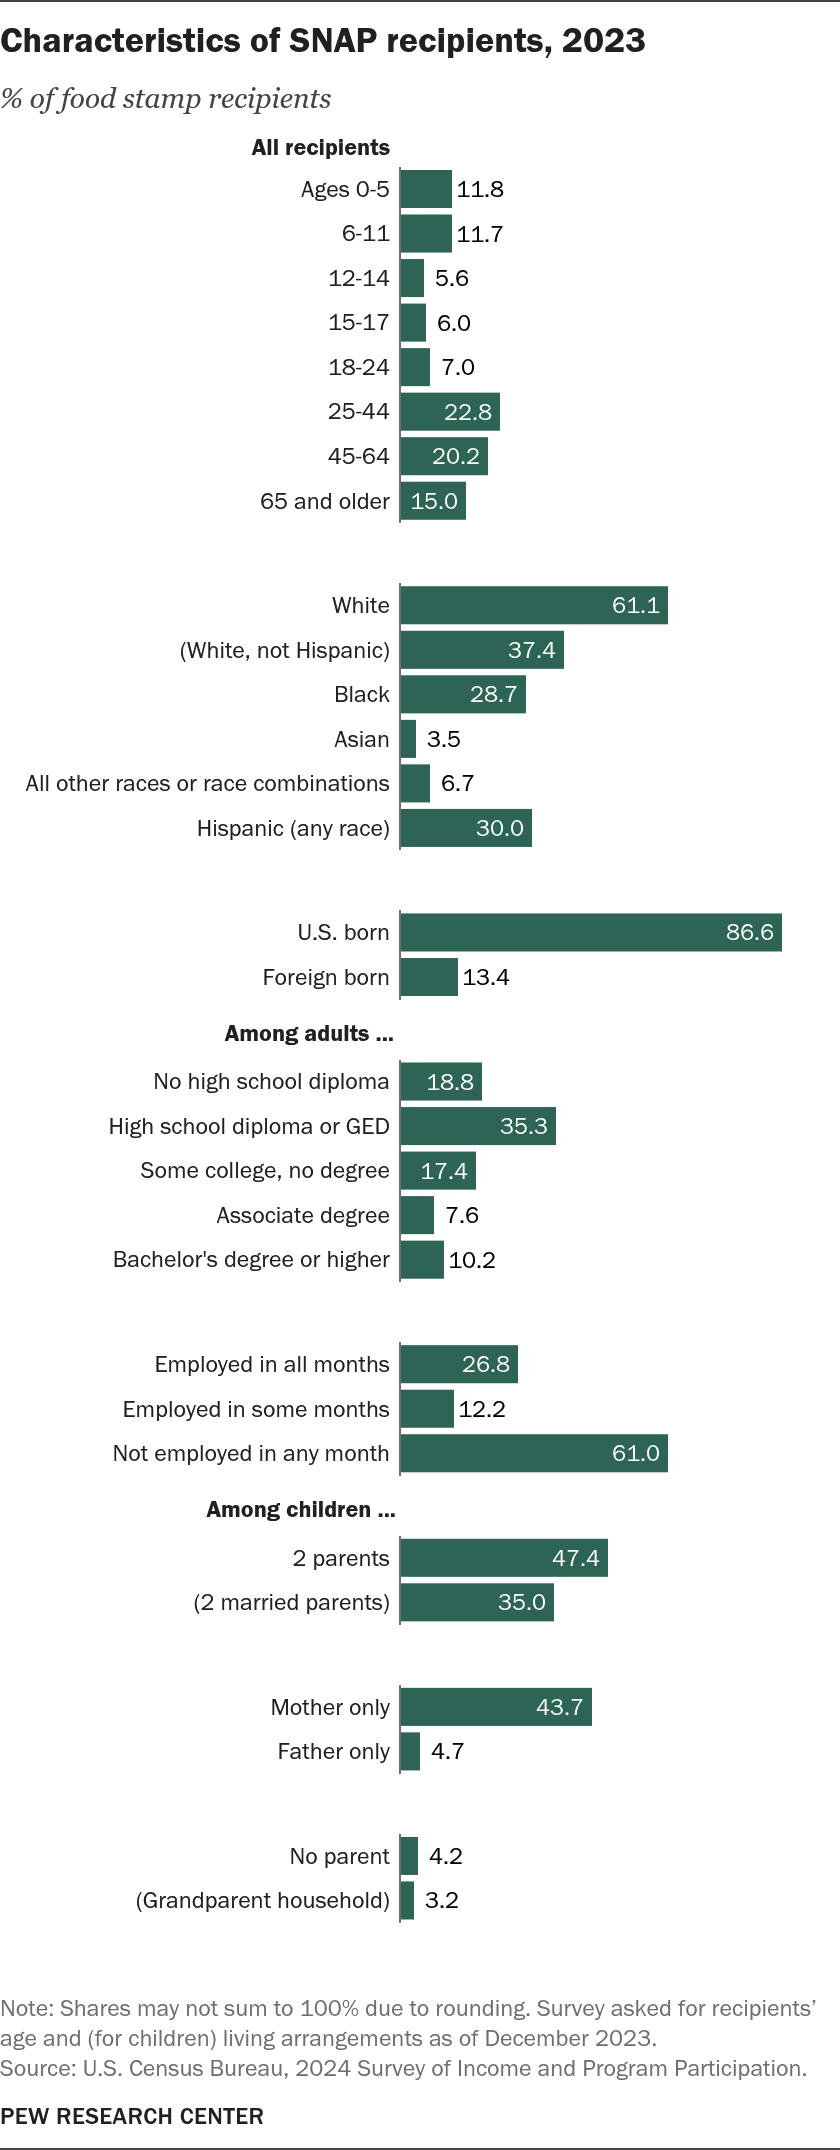
What do we know about food stamp recipients in the U.S.?
| Share | Among … | Category | |
|---|---|---|---|
| Ages 0-5 | 11.8% | All recipients | Age |
| 6-11 | 11.7% | All recipients | Age |
| 12-14 | 5.6% | All recipients | Age |
| 15-17 | 6.0% | All recipients | Age |
| 18-24 | 7.0% | All recipients | Age |
| 25-44 | 22.8% | All recipients | Age |
| 45-64 | 20.2% | All recipients | Age |
| 65 and older | 15.0% | All recipients | Age |
| White | 61.1% | All recipients | Race/ethnicity |
| (White, not Hispanic) | 37.4% | All recipients | Race/ethnicity |
| Black | 28.7% | All recipients | Race/ethnicity |
| Asian | 3.5% | All recipients | Race/ethnicity |
| All other races or race combinations | 6.7% | All recipients | Race/ethnicity |
| Hispanic (any race) | 30.0% | All recipients | Race/ethnicity |
| U.S. born | 86.6% | All recipients | Nativity |
| Foreign born | 13.4% | All recipients | Nativity |
| No high school diploma | 18.8% | Adults | Education |
| High school diploma or GED | 35.3% | Adults | Education |
| Some college, no degree | 17.4% | Adults | Education |
| Associate degree | 7.6% | Adults | Education |
| Bachelor’s degree or higher | 10.2% | Adults | Education |
| Employed in all months | 26.8% | Adults | Employment |
| Employed in some months | 12.2% | Adults | Employment |
| Not employed in any month | 61.0% | Adults | Employment |
| 2 parents | 47.4% | Children | Family structure (two parents) |
| (2 married parents) | 35.0% | Children | Family structure (two parents) |
| Mother only | 43.7% | Children | Family structure (one parent) |
| Father only | 4.7% | Children | Family structure (one parent) |
| No parent | 4.2% | Children | Family structure (no parent) |
| (Grandparent household) | 3.2% | Children | Family structure (no parent) |
The most comprehensive data source we have is the Census Bureau’s Survey of Income and Program Participation, although its most recent data is from 2023. That year, nearly 23 million SNAP recipients (65%) were adults, and 12.4 million (35%) were children.
Non-Hispanic White people accounted for 44.2% of adult SNAP recipients and 24.8% of child recipients in 2023. Nearly 27% of adult recipients and almost a third of child recipients (32.3%) were Black. Hispanics, who can be of any race, accounted for 24.2% of adult recipients and 40.7% of child recipients.
The vast majority of both adult and child recipients were born in the United States – 81.1% and 96.9%, respectively.
Among adult recipients, 54.1% had a high school diploma or less education. And despite the program’s work requirements, 61% said they had not been employed at all that year.
The Census Bureau also looked at households where at least one person received SNAP benefits. More than six-in-ten of these households (63.1%) reported having no children in 2023; almost a third (32.7%) said they lived alone. Among all SNAP-receiving households, 39% were in the South, the highest share of any region.
How much do food stamp recipients get each month?
In May 2025, the national average benefit was $188.45 per person and $350.89 per household. Amounts were considerably higher during the pandemic period, when Congress authorized extra benefits. At its peak in November 2022, the average monthly benefit was $259.50 per person and $493.76 per household.
The purchasing power of SNAP benefits held relatively steady for decades leading up to the Great Recession. The average per-person monthly benefit, in 2025 dollars, ranged from $122 to $151 between 1979 and 2008. The inflation-adjusted value of the average benefit rose during the Great Recession, and quite a bit more during the pandemic era – peaking in 2021 at $252.96 monthly.
However, those nationwide averages conceal a considerable amount of state-by-state variation. SNAP beneficiaries in New York received an average of $218.44 per person in May 2025, while recipients in Minnesota got $158.45 on average. (These rankings exclude Alaska, Hawaii, the Virgin Islands and Guam, where there are different rules in place to reflect higher food costs in those places.)
Why do benefits vary so much by state? One reason is that benefit amounts are largely determined by recipients’ income, minus certain expenses. Household size also factors into the calculation. So a state’s demographics and the condition of its economy will influence how much its residents can receive through SNAP.
The maximum SNAP benefit is based on the Thrifty Food Plan, an estimate by the Department of Agriculture (USDA) of how much it costs a family of two adults and two children to buy foods and beverages “on a limited budget to support a healthy diet through nutritious meals and snacks at home.” That amount is adjusted for other household types when determining benefit levels.
The Thrifty Food Plan was updated in 2021 for the first time in 15 years, and it had been scheduled for another reevaluation in 2026. However, under the policy law Congress passed in July, USDA can’t reevaluate the food plan until Oct. 1, 2027, at the earliest. Additionally, any cost increase is limited to the overall inflation rate. These changes are projected to reduce future benefit levels: By 2034, the Congressional Budget Office estimates, the average monthly benefit will be $213 rather than the $227 it would have been under prior law.
Where is food stamp usage highest and lowest?
In Guam, 22.5% of the population receives SNAP benefits – the highest rate of any state or territory, according to a Pew Research Center analysis. New Mexico is next highest (21.5%), followed by the District of Columbia (20%) and the Virgin Islands (19.9%).
Wyoming has the nation’s lowest rate of SNAP use: Just 4.6% of Cowboy State residents get the benefits. Wyoming’s neighbor, Utah, is close behind at 5.1%. Other states with low rates include New Hampshire (5.4%) and Kansas (6.3%).
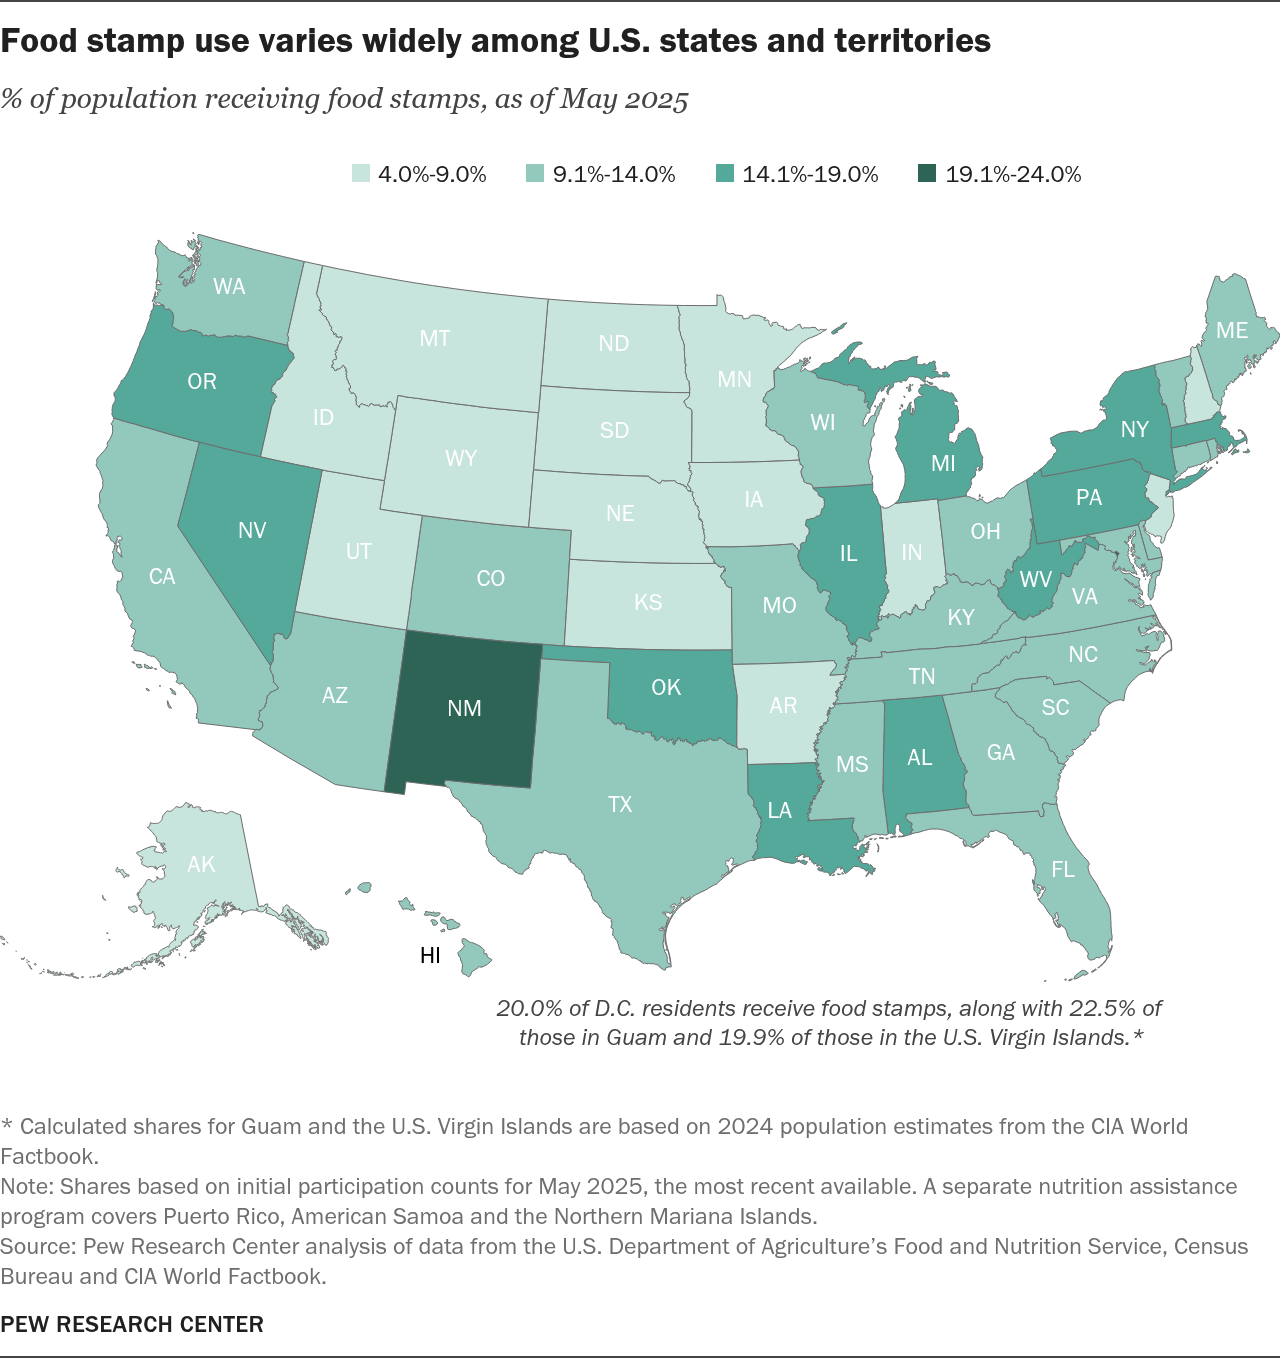
Note: Shares based on initial participation counts for May 2025, the most recent available. A separate nutrition assistance program covers Puerto Rico, American Samoa and the Northern Mariana Islands.
Source: Pew Research Center analysis of data from the U.S. Department of Agriculture’s Food and Nutrition Service, Census Bureau and CIA World Factbook.
| Name | FIPS | Share | Category |
|---|---|---|---|
| Alabama | 01 | 14.3 | 14.1%-19.0% |
| Alaska | 02 | 9.0 | 4.0%-9.0% |
| Arizona | 04 | 11.7 | 9.1%-14.0% |
| Arkansas | 05 | 7.8 | 4.0%-9.0% |
| California | 06 | 13.9 | 9.1%-14.0% |
| Colorado | 08 | 10.3 | 9.1%-14.0% |
| Connecticut | 09 | 9.9 | 9.1%-14.0% |
| District of Columbia | 11 | 20.0 | 19.1%-24.0% |
| Delaware | 10 | 11.2 | 9.1%-14.0% |
| Florida | 12 | 12.6 | 9.1%-14.0% |
| Georgia | 13 | 12.1 | 9.1%-14.0% |
| Guam* | 66 | 22.5 | 19.1%-24.0% |
| Hawaii | 15 | 11.3 | 9.1%-14.0% |
| Idaho | 16 | 6.7 | 4.0%-9.0% |
| Illinois | 17 | 14.8 | 14.1%-19.0% |
| Indiana | 18 | 8.5 | 4.0%-9.0% |
| Iowa | 19 | 8.2 | 4.0%-9.0% |
| Kansas | 20 | 6.3 | 4.0%-9.0% |
| Kentucky | 21 | 13.0 | 9.1%-14.0% |
| Louisiana | 22 | 17.5 | 14.1%-19.0% |
| Maine | 23 | 11.6 | 9.1%-14.0% |
| Maryland | 24 | 10.7 | 9.1%-14.0% |
| Massachusetts | 25 | 15.1 | 14.1%-19.0% |
| Michigan | 26 | 14.5 | 14.1%-19.0% |
| Minnesota | 27 | 7.8 | 4.0%-9.0% |
| Mississippi | 28 | 12.1 | 9.1%-14.0% |
| Missouri | 29 | 10.5 | 9.1%-14.0% |
| Montana | 30 | 7.1 | 4.0%-9.0% |
| Nebraska | 31 | 7.5 | 4.0%-9.0% |
| Nevada | 32 | 15.2 | 14.1%-19.0% |
| New Hampshire | 33 | 5.4 | 4.0%-9.0% |
| New Jersey | 34 | 8.7 | 4.0%-9.0% |
| New Mexico | 35 | 21.5 | 19.1%-24.0% |
| New York | 36 | 14.9 | 14.1%-19.0% |
| North Carolina | 37 | 12.5 | 9.1%-14.0% |
| North Dakota | 38 | 7.2 | 4.0%-9.0% |
| Ohio | 39 | 12.2 | 9.1%-14.0% |
| Oklahoma | 40 | 16.9 | 14.1%-19.0% |
| Oregon | 41 | 18.1 | 14.1%-19.0% |
| Pennsylvania | 42 | 15.0 | 14.1%-19.0% |
| Rhode Island | 44 | 12.8 | 9.1%-14.0% |
| South Carolina | 45 | 10.4 | 9.1%-14.0% |
| South Dakota | 46 | 8.1 | 4.0%-9.0% |
| Tennessee | 47 | 9.6 | 9.1%-14.0% |
| Texas | 48 | 11.0 | 9.1%-14.0% |
| U.S. Virgin Islands* | 78 | 19.9 | 19.1%-24.0% |
| Utah | 49 | 5.1 | 4.0%-9.0% |
| Vermont | 50 | 10.0 | 9.1%-14.0% |
| Virginia | 51 | 9.4 | 9.1%-14.0% |
| Washington | 53 | 11.4 | 9.1%-14.0% |
| West Virginia | 54 | 15.5 | 14.1%-19.0% |
| Wisconsin | 55 | 11.6 | 9.1%-14.0% |
| Wyoming | 56 | 4.6 | 4.0%-9.0% |
Note: Shares based on initial participation counts for May 2025, the most recent available. A separate nutrition assistance program covers Puerto Rico, American Samoa and the Northern Mariana Islands.
Source: Pew Research Center analysis of data from the U.S. Department of Agriculture’s Food and Nutrition Service, Census Bureau and CIA World Factbook.
What can you buy with food stamps? What can’t you buy?
SNAP benefits can be used to buy most groceries for household use, including breads and pastries; meats, poultry and fish (but not, in most cases, live animals and birds); fruits and vegetables; dairy products, including ice cream; and snack foods such as cookies, cakes and soft drinks. Recipients can also use SNAP benefits to buy plants and seeds to grow food for the household, but not (for example) non-edible flowers.
Alcoholic beverages and tobacco products cannot be bought with SNAP benefits, nor can nutritional supplements, medicines or pet food. Foods that are sold hot (think rotisserie chickens or ready-to-eat soups) aren’t eligible either, nor are household goods such as paper towels, cleaning products and toiletries. Gasoline isn’t eligible either.
Where can people use food stamps? Where do they use them most frequently?
Almost 267,000 establishments – from grocery stores and farmers markets to meal delivery services and senior centers – were authorized to accept SNAP benefits as of September 2024. A few types stand out:
- Supermarkets and superstores, such as Walmart and Target, together make up about 15% of SNAP-accepting establishments, but they accounted for nearly 74% of all redemptions.
- More than 44% of all SNAP-accepting establishments are convenience stores, but they accounted for only about 5% of redemptions in 2024.
- While only 561 internet retailers, such as Amazon, were authorized to accept SNAP benefits, they accounted for more than 10% of all redemptions.
How much does the federal government spend on food stamps each year?
Through the first eight months of fiscal 2025, the government spent almost $65 billion on benefits alone, 4.7% more than during the corresponding period in fiscal 2024.
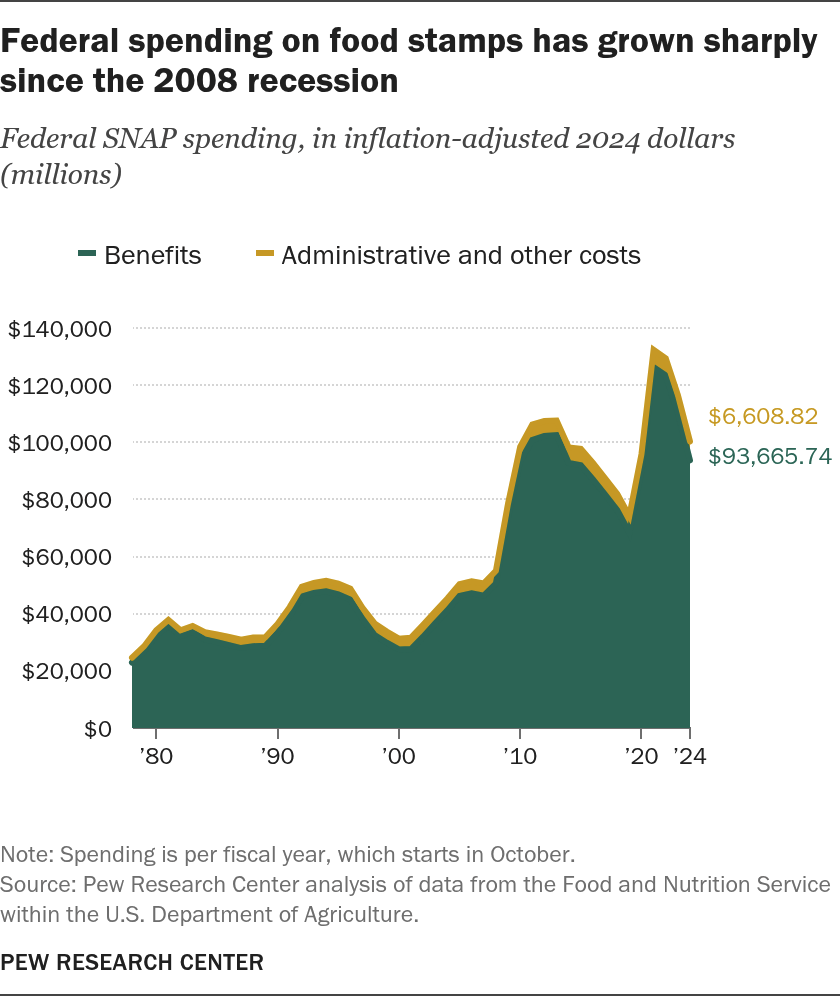
Note: Spending is per fiscal year, which starts in October.
Source: Pew Research Center analysis of data from the Food and Nutrition Service within the U.S. Department of Agriculture.
| Year | Benefits | Administrative and other costs |
|---|---|---|
| 1978 | $22,904.04 | $1,695.79 |
| 1979 | $26,699.59 | $1,893.63 |
| 1980 | $32,353.01 | $1,801.49 |
| 1981 | $35,828.14 | $2,006.80 |
| 1982 | $32,196.53 | $1,981.95 |
| 1983 | $33,621.57 | $2,094.66 |
| 1984 | $30,975.76 | $2,556.00 |
| 1985 | $30,055.47 | $2,684.50 |
| 1986 | $29,005.93 | $2,825.87 |
| 1987 | $27,984.56 | $2,942.03 |
| 1988 | $28,647.29 | $3,000.37 |
| 1989 | $28,761.25 | $3,035.91 |
| 1990 | $33,340.33 | $3,075.17 |
| 1991 | $39,072.64 | $3,230.15 |
| 1992 | $46,042.44 | $3,428.37 |
| 1993 | $47,252.02 | $3,536.36 |
| 1994 | $47,825.63 | $3,668.34 |
| 1995 | $46,754.50 | $3,812.60 |
| 1996 | $44,955.24 | $3,788.08 |
| 1997 | $38,218.65 | $3,829.28 |
| 1998 | $32,545.93 | $4,042.28 |
| 1999 | $29,854.58 | $3,883.93 |
| 2000 | $27,485.71 | $3,798.53 |
| 2001 | $27,631.34 | $3,984.56 |
| 2002 | $31,967.34 | $4,168.91 |
| 2003 | $36,617.90 | $4,126.41 |
| 2004 | $41,156.91 | $4,146.20 |
| 2005 | $46,245.49 | $4,053.67 |
| 2006 | $47,130.22 | $4,239.94 |
| 2007 | $46,330.14 | $4,271.39 |
| 2008 | $50,545.54 | $4,427.14 |
| 2009 | $73,787.15 | $4,776.54 |
| 2010 | $93,230.37 | $5,160.35 |
| 2011 | $100,794.18 | $5,439.84 |
| 2012 | $102,232.09 | $5,194.88 |
| 2013 | $102,505.17 | $5,110.97 |
| 2014 | $92,782.00 | $5,383.42 |
| 2015 | $91,981.44 | $5,681.22 |
| 2016 | $87,045.32 | $5,720.50 |
| 2017 | $81,667.23 | $5,722.10 |
| 2018 | $76,236.64 | $5,671.51 |
| 2019 | $68,336.90 | $5,848.59 |
| 2020 | $89,767.67 | $6,059.83 |
| 2021 | $126,290.44 | $6,068.20 |
| 2022 | $123,373.48 | $6,016.18 |
| 2023 | $110,284.44 | $6,254.41 |
| 2024 | $93,665.74 | $6,608.82 |
Note: Spending is per fiscal year, which starts in October.
Source: Pew Research Center analysis of data from the Food and Nutrition Service within the U.S. Department of Agriculture.
In fiscal 2024, the government spent $100.3 billion on SNAP. Nearly all of that money ($93.7 billion, or 93.4%) went to benefits, while $6.6 billion (6.6%) went to reimburse states for half of their administrative and other expenses. (Under the new domestic policy law, that reimbursement rate will fall to 25% starting in fiscal 2027.)
SNAP is one of the larger federal social welfare programs, but by no means the largest. For comparison, in fiscal 2024, the federal government spent $874.1 billion on Medicare, $617.5 billion on Medicaid, $161.3 billion on income security for veterans, $54.4 billion on Supplemental Security Income and $38.3 billion on unemployment compensation.
Currently, the federal government pays 100% of SNAP benefit costs. However, starting in fiscal 2028, many states may have to pay anywhere from 5% to 15% of benefit costs from their own funds, depending on how much they over- or underpay SNAP benefits in a given year.
This summer’s tax and policy law penalizes states with relatively high rates of overpayment or underpayment. States with combined over- and underpayment rates above 6% – the “error rate” – will have to start paying for a share of their state’s benefits. The higher the error rate, the higher the cost share.
Most states could feel the pinch. In fiscal 2024, the most recent year for which data was available, only eight states and the Virgin Islands had combined error rates lower than 6%, while Alaska’s was the highest at 24.7%.
States that exceed the allowable error rate could be faced with unpalatable choices: raising taxes or cutting other expenses to pay for their cost share, restricting eligibility to lower the potential cost, or even dropping SNAP entirely.
How has the cost of the food stamp program changed over time?
SNAP is an entitlement program, which means spending on it rises and falls based primarily on how many people qualify for benefits – but also through changes in its authorizing legislation.
For decades, annual spending on SNAP appeared to follow a regular pattern: It fell to around $31 billion a year (in inflation-adjusted 2024 dollars) during strong economic times and rose during and immediately after recessions, at times topping $50 billion.
But that pattern changed following the dot-com recession of 2001. Inflation-adjusted spending on SNAP rose throughout the 2000s, even after the economy began growing again. It then jumped after the economy sank into the Great Recession, topping out at $107.6 billion in inflation-adjusted dollars in fiscal 2013. SNAP spending then fell slowly, until the COVID-19 pandemic upended the economy again. Spending on the program soared from $74.2 billion in fiscal 2019 to $132.4 billion in fiscal 2021 in inflation-adjusted dollars. Since the 2021 peak, inflation-adjusted SNAP spending has fallen 24.2%.
Why are they called ‘food stamps,’ anyway?
The precursor to the modern SNAP program, which began in 1939 and ran until 1943, did use actual stamps. Besides feeding the hungry, the program was designed to aid farmers struggling with surplus crops they couldn’t sell profitably.
People receiving public assistance could buy orange stamps that were exchangeable, dollar for dollar, for most food items at grocery stores. For every dollar participants spent on orange stamps, they also received 50 cents’ worth of blue stamps, which could be spent only on USDA-designated surplus commodities such as beans, eggs, dairy products, fruits and vegetables. Over the program’s lifespan, approximately 20 million people received food stamps at one time or another, at a total cost of $262 million.
The U.S. entry into World War II put an end to the first food stamp program, as the war effort absorbed both farm and labor surpluses. But the concept stuck in people’s heads, and when it was revived in 1964 as part of President Lyndon Johnson’s “War on Poverty,” it was formally named the Food Stamp Program. But instead of stamps, beneficiaries purchased multicolored “food coupons” that could be used much like cash. The purchase requirement was eliminated in 1977, benefits began to be widely delivered by debit card in the 1990s, and by 2004 the paper coupons had gone the way of the blue and orange stamps. The program was renamed SNAP in 2008.
Note: This is an update of a post originally published July 19, 2023.
