

Most U.S. adults (86%) say small businesses have a positive effect on the way things are going in the country these days, according to a recent Pew Research Center survey. Small businesses, in fact, receive by far the most positive reviews of any of the nine U.S. institutions we asked about, outranking even the military and churches.
Despite their name, small businesses loom large in the United States. These businesses – defined here as those with 500 employees or fewer – account for 99.9% of U.S. firms, according to the Small Business Administration. While most of these 33 million firms don’t have paid employees, about 6 million of them do. They account for just under half of total private sector employment (46%).
As National Small Business Week approaches, here’s a look at small businesses in the U.S. and public attitudes about them, based on federal data and Center surveys.
Pew Research Center conducted this analysis to provide a glimpse into the state of American small businesses ahead of National Small Business Week.
In this analysis, “small businesses” are defined as employer firms with fewer than 500 workers. The analysis relies primarily on data from several Census Bureau sources: the Annual Business Survey (ABS), the Business Dynamics Statistics (BDS), and the Business Formation Statistics (BFS).
The ABS – conducted annually since 2017 – includes all non-farm U.S. firms with paid employees and receipts of $1,000 or more. Majority business ownership is characterized in the survey as having 51% or more of the stock or equity in the firm. The Census Bureau counts multiracial firm owners under all racial categories they identify with; Hispanic firm owners may be of any race. Read more about the ABS methodology.
Data on the age of small business comes from the BDS. Data on the annual number of high-propensity business applications in the United States is based on the number of Employer Identification Number applications used for tax purposes and is not seasonally adjusted. Read more about the BFS methodology. Per capita calculations use state-level resident population data from the Census Bureau; estimates are as of July 1, 2023.
This analysis also draws on findings from recent Center surveys. More information on the methodology for these surveys can be found by following the links in the text.
There’s no single way to define a “small business.” Economists sometimes use the size of the establishment or firm, or turn to industry-specific size standards based on average revenue. For this analysis, we’ve used the U.S. Small Business Administration’s broadest definition: employer firms with fewer than 500 workers.
An establishment is a business with one physical location. A firm is a business organization that may have multiple locations (i.e., multiple establishments).
Just how ‘small’ are small businesses?
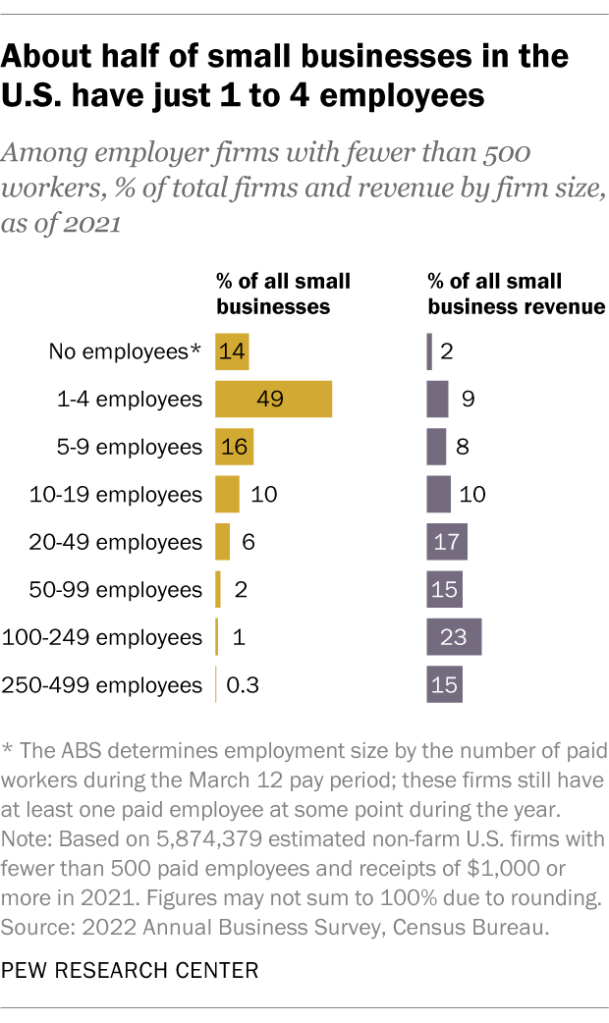
Among the roughly 6 million small businesses with employees, 49% have just one to four workers, according to the latest estimates for 2021 from the Census Bureau’s Annual Business Survey (ABS). About a quarter (27%) have between five and 19 employees; 8% have 20 to 99; and just 1% have 100 to 499 workers. The remaining 14% had paid employees at some point during the year, but not during the March 12 pay period, which the ABS uses to determine employment size.
Overall, small businesses employed an estimated 56.4 million workers in 2021 and brought in over $16.2 trillion in revenue, according to ABS data. Perhaps unsurprisingly, small businesses with more employees tend to account for larger shares of overall revenue than those with fewer workers.
Who owns and runs small businesses?
Some small businesses are family-owned, but the vast majority are not. Among small businesses that reported this type of information for 2021, 27% were family-owned and 73% were not.
So-called “mom and pop shops” account for a relatively modest share of small businesses for which information is available. Overall, 10% of small businesses in the U.S. were jointly owned and operated equally by spouses in 2021. Another 11% were jointly owned by spouses but separately operated, with men more likely than women to serve as primary operators.
Franchises aren’t very common among small businesses. Just 5% of small businesses that reported this information were fully or partially operated as franchises in 2021.
In terms of demographics, men own a greater share of small businesses overall. About six-in-ten small businesses (61%) were majority-owned by men in 2021, while 22% were majority-owned by women. Another 14% were owned equally by men and women. (The ABS defines majority ownership as having at least 51% equity in the firm.)
Looking at small businesses where estimates of majority owners’ race and ethnicity are available, most (85%) had majority-White ownership in 2021. Smaller shares were majority-owned by Asian Americans (11%), Hispanic adults (7%), and Black or African American adults (3%). About 1% were estimated to have either American Indian and Alaska Native, or Native Hawaiian and other Pacific Islander majority owners.
Related: A look at Black-owned businesses in the U.S.
Despite owning small shares of these firms overall, many Black and Asian Americans see entrepreneurship as a marker of success, according to Center surveys.
For example, 30% of Asian Americans say owning a business is important to their own view of the American dream, according to a Center survey conducted from July 2022 to January 2023. And 36% of Black adults say owning a business is important to their personal definition of financial success, with another 22% saying it’s essential, according to a September 2023 survey.
Still, Black and Asian Americans are more likely to place emphasis on other measures asked about in these surveys, such as owning a home, having a good family life and being debt-free, among others.
How old are most small businesses?
Many small businesses have stood the test of time. In 2021, the majority of these firms (59%) had been operational for at least six years, according to the Census Bureau’s Business Dynamics Statistics. This includes 15% that had been in business for more than 25 years.
On the other end of the spectrum, about a third of small businesses (35%) had been running for five years or fewer in 2021, including 9% that had launched in the last year. (The bureau could not determine the age of the remaining 6% of firms.)
How often do new businesses open?
Small businesses have reported financial and staffing challenges in the years following the coronavirus pandemic. But federal data reveals the staying power of entrepreneurship in the U.S.
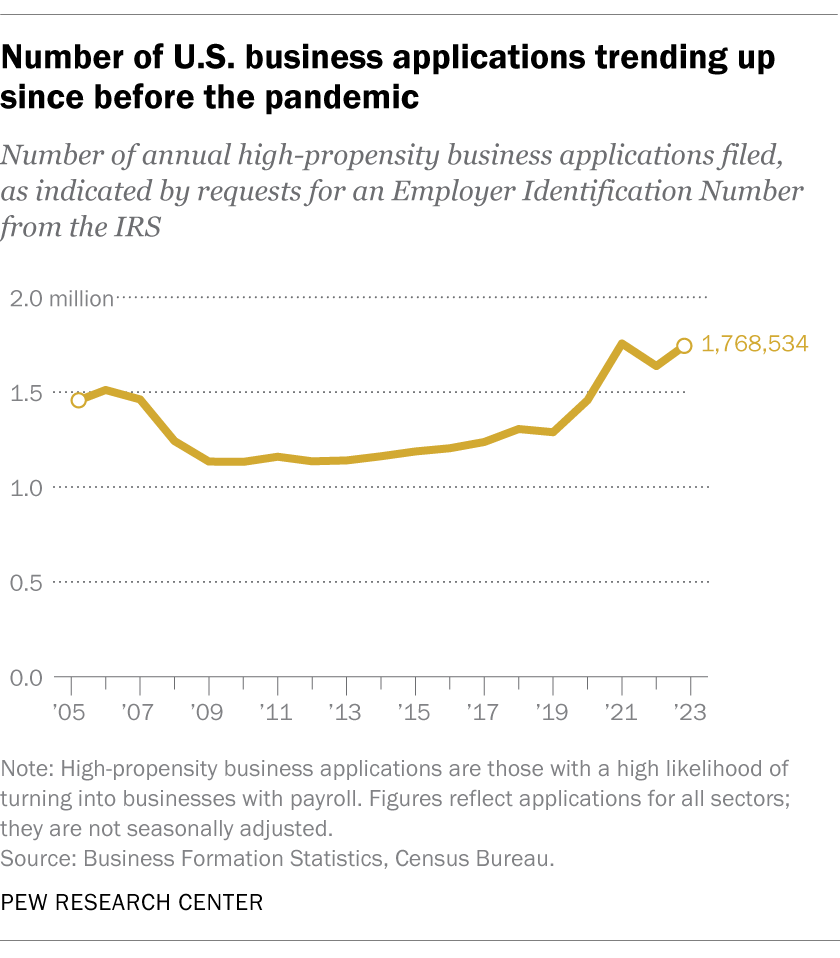
The number of high-propensity business applications – those that are highly likely to turn into businesses with payrolls – remained relatively stable between 2009 and 2019, according to Census Bureau data. But the number of applications has risen since before the pandemic: There were nearly 1.8 million high-propensity business applications in 2023, up from about 1.3 million in 2019.
On the state level, places with larger populations saw the most high-propensity business applications in 2023. Florida (225,809) topped the list, followed by California (221,571), Texas (151,888), New York (131,206) and Georgia (80,403). But Missouri, Wyoming, Delaware, Florida and Colorado had the most applications per capita that year.
