Life for Asians living in the United States is shaped by the relationships they form here, their cultural heritage, and their group’s history in the U.S. Their lives in America are also shaped by the connections they have with other Asian Americans and their views of representation and politics.
For many Asian adults, where they were born shapes friendships formed in the U.S.
Life for Asians living in the United States can look quite different depending on where they were born. Those born outside the U.S. are often older, having experienced a larger share of their formative years in other places. And they often have stronger ties to their origin group than those born in the U.S. do. These differences contribute to the types of social relationships formed by U.S. Asians.
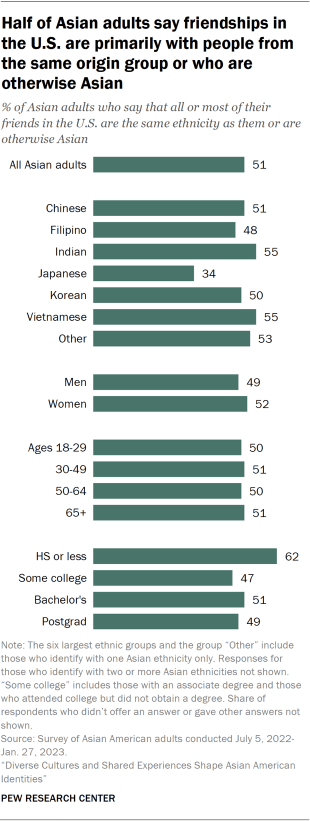
Overall, about half (51%) of Asian Americans say all or most of their friends in the United States share their own ethnicity or are otherwise Asian. The extent to which Asian Americans form friendships with other Asians is similar across most of the largest origin groups. At least half of all Vietnamese (55%), Indian (55%), Chinese (51%) and Korean (50%) respondents say all or most of their friends in the U.S. share their ethnicity or are otherwise Asian, compared with 34% for Japanese respondents.
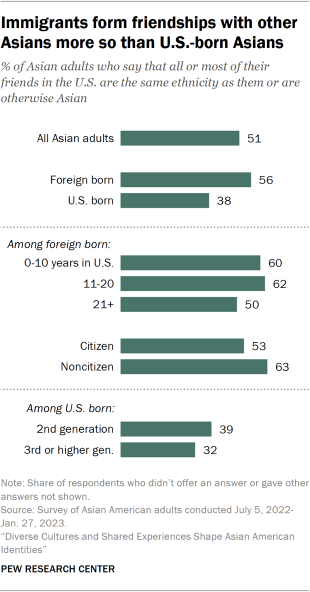
Some of the largest differences among Asian Americans are driven by the experiences of those born outside the United States. More than half of Asian immigrant adults (56%) say all or most of their friends share their ethnicity or are Asian. Among immigrants, those who came to the U.S. in the last 10 years are more likely to indicate this about their friends than those who have lived in the U.S. for 21 years or more (60% and 50% respectively).
By comparison, 38% of U.S.-born Asian adults say all or most of their friends share their ethnicity or are otherwise Asian. Among the U.S. born, about four-in-ten (39%) who are second generation say all or most of their friends share their same ethnicity or are Asian, compared with 32% of those who are third generation or higher who say the same. Immigrants are more likely than U.S.-born adults to say that all or most of their friends are of the same ethnicity (45% vs. 19%). Conversely, U.S.-born Asians (25%) are slightly more likely than Asian immigrants (19%) to say all or most of their friends are not of their ethnicity, but still Asian.
Most Asian adults are comfortable with intermarriage
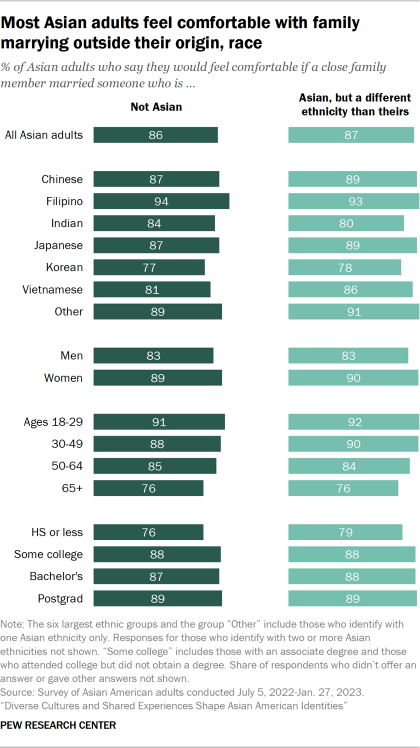
When it comes to marriage, nearly all Asian adults say they would be comfortable if a close family member married someone who is not Asian (86%) or married someone who is Asian but from a different ethnic group (87%).
Historically, Asian Americans have some of the highest intermarriage rates among U.S. adults. In 2021, 23% of Asian newlyweds were married to someone who is not Asian, according to a Pew Research Center analysis of government data. These rates have changed little since the 1990s.
Although large majorities across Asian origin groups say they are comfortable with a close relative marrying outside their racial or ethnic group, Filipino adults stand out on this measure. Nearly all Filipino respondents say they would feel comfortable with a close family member marrying someone who is not Asian (94%) or is Asian but not Filipino (93%).
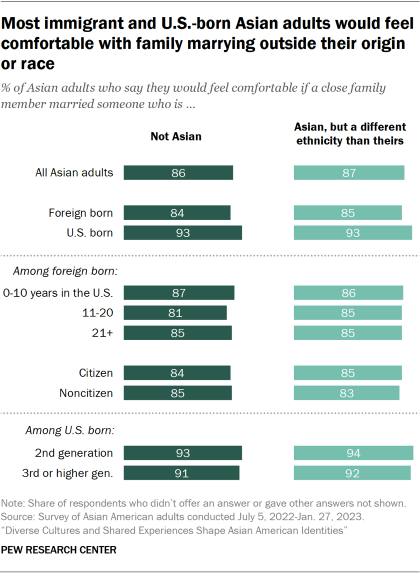
Interestingly, while Asian adults born in the U.S. differ from those born elsewhere when it comes to forming friendships, more than 80% of both groups say they are comfortable with a close family member marrying outside their race or ethnicity.
Asian women are more comfortable than Asian men with intermarriage in their family, both with marrying someone who is not Asian (89% vs. 83%) and someone who is of a different Asian ethnicity (90% vs. 83%). One large gender gap is by immigrant status: U.S.-born Asian women are the most comfortable with a close family member marrying outside their race (95%), foreign-born men are least comfortable (82%), and U.S.-born men (89%) and foreign-born women (87%) are in the middle. Similarly, nearly all U.S.-born women (96%) report being comfortable with a close relative marrying someone who is Asian but of a different ethnicity, followed by U.S.-born men (90%).
Younger Asian American adults are also slightly more comfortable with intermarriage than older Asian adults, with those ages 18 to 29 more likely to say they are comfortable with a close family member marrying outside their race (91%) than those 50 to 64 (85%) and 65 and older (76%). Those ages 18 to 29 are also more likely to say they are comfortable with a close relative marrying someone who is Asian outside of their ethnicity (92%) than older Asian adults (84% among ages 50 to 64, and 76% among ages 65 and older).
Some Asians say they have hidden their heritage
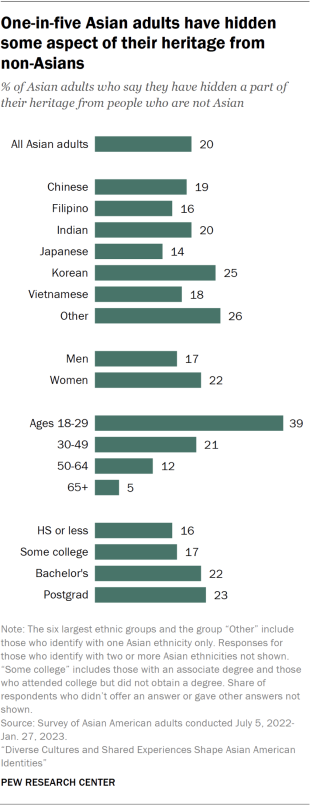
An experience that some Asian Americans have in the U.S. is feeling singled out or “othered” due to their identity. In the new survey, Asian adults were asked if they have ever hidden a part of their heritage (such as food, cultural practices, clothing or religious practices) from people who are not Asian. Overall, one-in-five Asian Americans report doing so. The extent to which U.S. Asians say they have had such experiences varies across several demographic characteristics including age, nativity, education, ethnicity and gender.
Among the largest Asian origin groups, 25% of Korean adults say they have hidden some aspect of their heritage from non-Asians, while slightly smaller shares of Chinese (19%), Filipino (16%), Vietnamese (18%) and Japanese adults (14%) have also done so.
The experience of having to hide some aspect of their heritage from others is one that younger Asian adults are more likely to report than older Asians. Indeed, 39% of U.S. Asians ages 18 to 29 report they have hidden some aspect of their culture or heritage, compared with just 12% among those 50 to 64 and 5% of those 65 and older.
In addition, there are differences between men and women, with a slightly higher share of women than men saying they have had to hide their heritage (22% vs. 17%). Finally, a larger share of Asian adults with a bachelor’s (22%) or postgraduate degree (23%) report having hidden some aspect of their culture or heritage compared with those with some college (17%) or a high school diploma or less (16%).
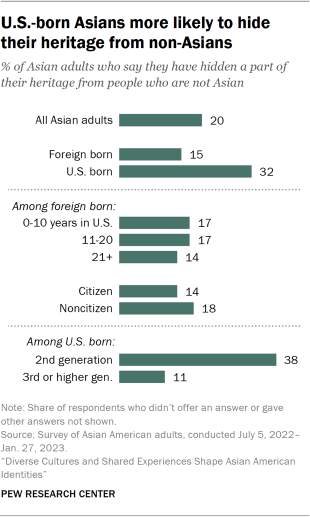
Another large difference is among Asian adults born in the U.S. and those born in another country. U.S.-born respondents were twice as likely as Asian immigrants to report having hidden some aspect of their culture (32% vs. 15%). And one of the largest gaps between groups of Asian adults is generational, with 38% of second-generation Asians saying they have hidden some aspect of their culture or heritage compared with 11% of third generation or higher.
Reasons for hiding heritage vary by nativity
Asian American adults who said they had hidden some aspects of their culture were asked to share their reasoning for doing so in an open-ended question. The responses from those who answered the question highlighted several different situations ranging from fear of being embarrassed to wanting to avoid awkward questions or having to explain themselves, and even concern of potential discrimination.
In addition, there were differences in the words and phrases U.S.-born Asian Americans used compared with Asian immigrants. Here, pointwise mutual information identified the words and phrases more likely to be included in responses from U.S.-born Asian adults compared with foreign-born Asian adults (and vice versa).6 Responses from U.S.-born respondents included terms such as “lack [of] understanding,” which often referred to dealing with non-Asians having a general lack of knowledge of their heritage. Other words and phrases more likely to be included by U.S.-born respondents were ones that related to fears such as “fear [of] discrimination” or avoiding other negative experiences such as being “bullied,” “teased” or “mocked.”
The reasons given by Asian immigrants for hiding aspects of their heritage highlighted similar themes in their open-ended responses but included distinctive words and phrases unique to their own immigrant experiences. For example, responses from foreign-born Asians were more likely to include phrases like “want [to] explain,” which was often in reference to the extra effort sometimes needed to explain aspects of their heritage to non-Asians. Similarly foreign-born respondents were more likely to include the phrase “American culture.” Other terms more likely to be included by those born in another country related to fears of or a desire to avoid “prejudice” or situations that would make them “[feel] uncomfortable.”
Overall, many of these open-ended responses echoed some of the experiences described by participants in Pew Research Center’s 2021 focus group research. Among the topics covered, participants shared their experiences about how they think about their identity as well as their interactions with others. Some of the themes that emerged from these focus group discussions highlighted the general lack of knowledge or familiarity during interactions with others (non-Asians and Asians alike), as well as the experience of focus group participants frequently having to explain themselves and their heritage to others.
Connections with other Asian Americans, politics and political parties
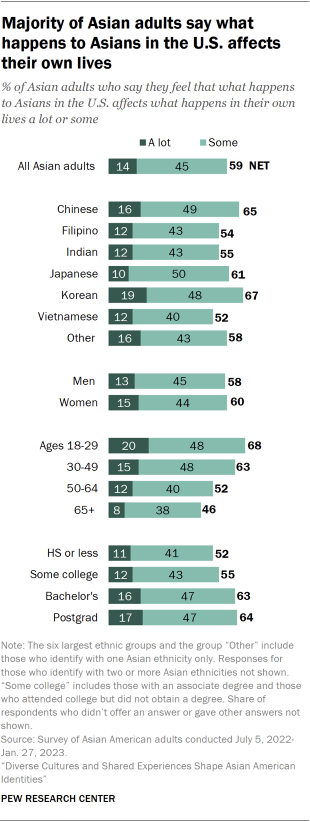
Aside from questions on personal and perceived identities, Asian adults were asked about how connected they feel with Asians living in the U.S. Overall, the majority (59%) of Asian adults say that what happens to Asians living in the U.S. affects what happens in their own lives.
National Asian connections
Across the six largest Asian origin groups, about half or more say that what happens to Asians in the U.S. has an impact on their own lives. But this view varies by origin group, with Korean (67%) and Chinese (65%) adults having a stronger sense of connection to what happens to other Asians in the country compared with Indian (55%), Filipino (54%) and Vietnamese (52%) adults.
In addition, about two-thirds (68%) of Asian adults ages 18 to 29 say that what happens to other Asians in the U.S. affects their lives at least some, a higher share than among Asians 65 and older (46%). And higher shares of those with a college degree compared with those with some college or less say what happens to U.S. Asians affects their own lives a lot or some.
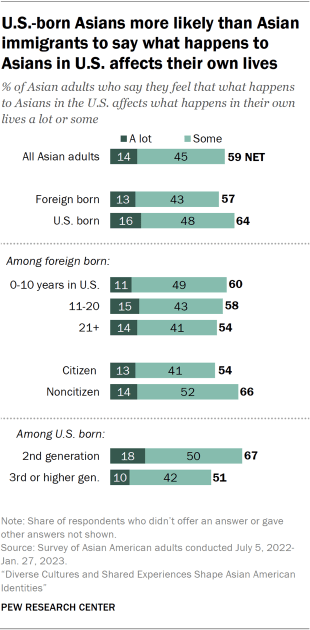
Feelings about shared fates with other U.S. Asians extend across immigrant generations. U.S.-born Asian adults are more likely than Asian immigrants to say that what happens to Asians in the U.S. overall affects what happens in their own lives (64% vs. 57%). This linkage is even stronger for second-generation Asian adults, with about two-thirds saying the same (67%). However, feelings of shared fates with other U.S. Asians fall to about half (51%) among third- and higher-generation Asian adults.
Among Asian immigrants, non-U.S. citizens (66%) are more likely than naturalized U.S. citizens (54%) to say that what happens to Asians in the U.S. affects their own lives, though majorities of both groups hold this view. This connection with other Asians in the U.S. declines for immigrants who have been in the U.S. for more than 20 years when compared with those who arrived within the last 10 years (54% vs. 60% respectively).
Need for a national leader advancing the concerns of Asian Americans
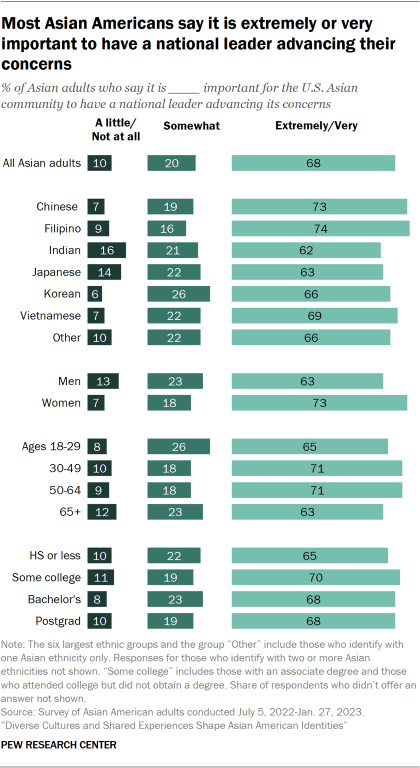
About two-thirds of Asian Americans (68%) say it is extremely or very important for the U.S. Asian community to have a national leader advancing its concerns, while just 10% say it is a little or not at all important.
Most Asian adults among all the largest ethnic groups say a national leader is important. Roughly three-in-four Filipino (74%) and Chinese (73%) adults say it is very or extremely important for the U.S. Asian community to have a national leader advancing its concerns. Majorities of Vietnamese (69%), Korean (66%), Japanese (63%) and Indian adults (62%) say the same.
A higher share of Asian American women (73%) than men (64%) say having a national leader is extremely or very important, though large majorities of both groups say so.
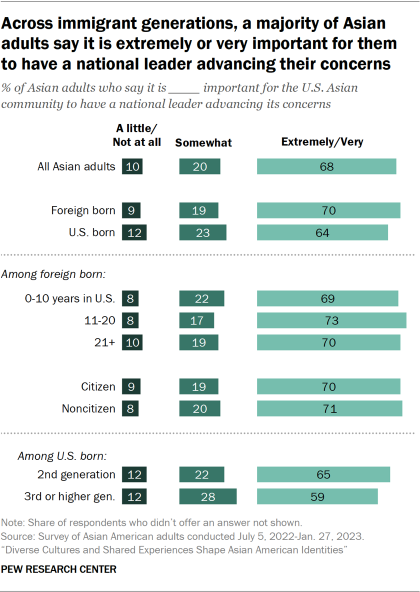
In addition, 70% of immigrant Asian adults say having a national leader advancing Asian community concerns is at least very important, a slightly higher share than among U.S.-born Asian adults (64%).
Asian American registered voters and political party
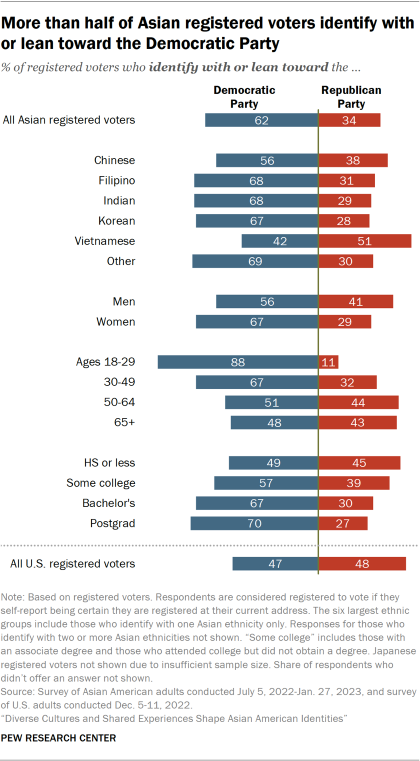
When it comes to political life, Asian Americans represent some of the fastest growing parts of the electorate across the country. A majority of Asian adults who are registered to vote think of themselves as Democrats or lean Democratic (62%) rather than as Republicans or Republican leaners (34%).
In contrast, U.S. registered voters overall are about evenly split between Democrats (47%) and Republicans (48%).
Across origin groups, about two-in-three Filipino (68%), Indian (68%) and Korean (67%) registered voters identify with or lean toward the Democratic Party. A slightly smaller majority of Chinese registered voters (56%) identify as or lean Democratic, while about half of Vietnamese registered voters (51%) identify with or lean to the Republican Party.
The extent to which Asian voters associate with each of the major parties also varies across other demographic characteristics such as gender, age and education. Indeed, a greater share of Asian women (67%) who are registered to vote identify as Democrats when compared with Asian men (56%). There are also wide differences by educational attainment, with 70% of Asian voters with a postgraduate degree identifying as or leaning Democratic compared with about half (49%) of those with a high school education or less.
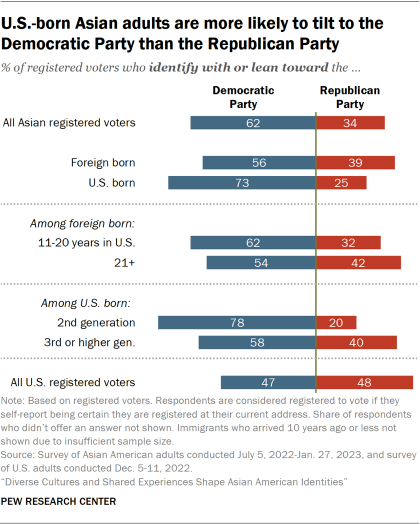
About six-in-ten of those who have spent 11 to 20 years in the U.S. (62%) identify as Democratic, compared with 54% among those who have lived in the U.S. for more than 20 years. There also are generational differences among Asian voters born in the U.S., with a larger share of second-generation Asians associating with the Democratic Party (78%) compared with those who are third or higher generation (58%).
About one-quarter of Asian adults say they are informed about U.S. Asian history
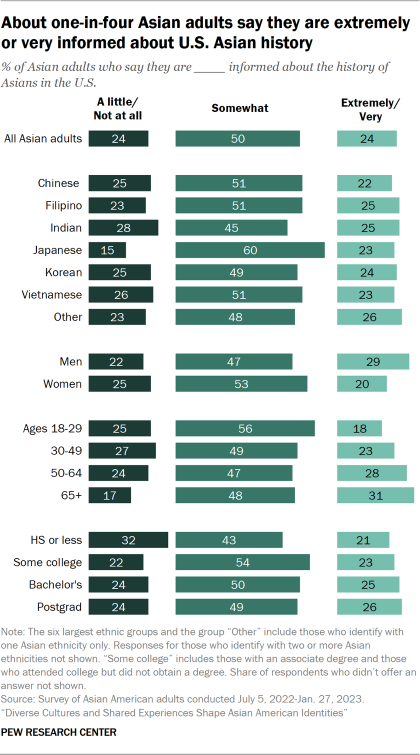
Asian Americans have a history in the United States that spans the nation’s lifetime. This history includes Chinese laborers who helped build the first transcontinental railroad and the subsequent Chinese Exclusion Act, Japanese incarceration during World War II, as well as Filipinos entering as U.S. nationals during the exclusion era, the influx of refugees following wars in Southeast Asia, and since 1960, the arrival of more than 14.7 million immigrants from Asia.
Yet just about one-in-four Asian adults (24%) say they are extremely or very informed about U.S. Asian history, according to the new survey of Asian Americans. Half say they are somewhat informed about U.S. Asian history, while another quarter (24%) say they are little or not at all informed.
The new survey shows there are differences in Asian adults’ knowledge of U.S. Asian history by several demographic characteristics such as age, gender, immigrant status and years since arrival in the U.S.
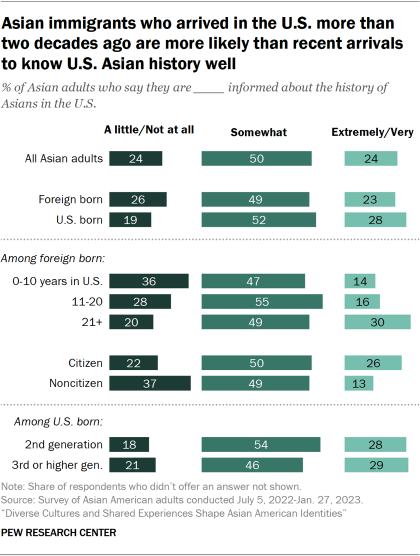
Asian adults ages 65 and older are more likely than those 18 to 29 to say they are extremely or very informed about U.S. Asian history (31% vs. 18%). And Asian men are more likely than Asian women to say they are very or extremely informed (29% vs. 20%). Meanwhile, U.S.-born Asian adults (28%) are slightly more likely than those who are immigrants (23%) to say they are substantially informed about Asian history in the U.S. Among immigrants, how many years they have lived in the U.S. is also related to differences in knowledge of U.S. Asian history.
Three-in-ten Asian immigrants who have been in the country for more than two decades say they are extremely or very informed about U.S. Asian history, higher than the share among those who have been in the country 10 years or less (14%). And Asian immigrants who are U.S. citizens (26%) are more likely than noncitizen Asian immigrants (13%) to say they are extremely or very informed.
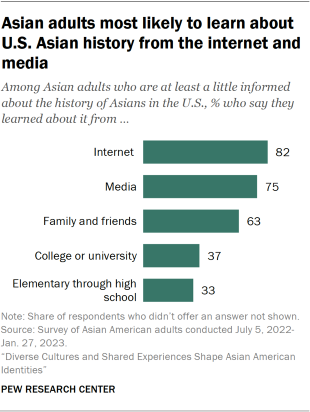
Among those who say they are at least a little informed about U.S. Asian history, most say they learned it from the internet (82%) or media (75%), while 63% say they learned from family and friends. Fewer Asian adults say they learned about it in a classroom setting, with 37% saying they learned in their college or university years and 33% while they attended elementary through high school.
What being ‘truly American’ means to U.S. Asians
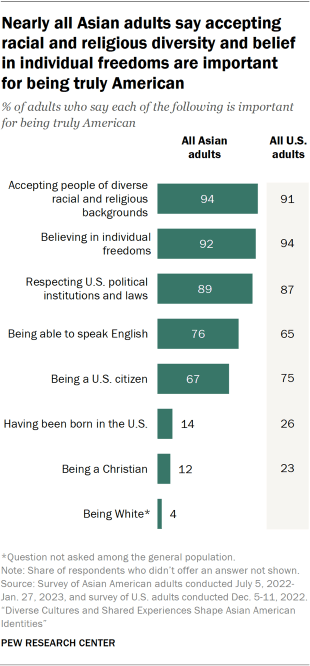
When it comes to being “truly American,” most Asian adults agree acceptance of people of diverse racial and religious backgrounds (94%), believing in individual freedoms (92%) and respecting U.S. political institutions (87%) are important.
Meanwhile, just 14% say having been born in the U.S. is important for being truly American and 12% say the same about being Christian.
Asian Americans’ views about what is important for being truly American are similar to those of the general U.S. adult population. Almost all U.S. adults say accepting diverse backgrounds (91%), believing in individual freedoms (94%) and respecting U.S. political institutions (87%) are important for being truly American.
Still, differences between Asian Americans and the general population do emerge on other traits. For example, Asian Americans are more likely than the general population to say being able to speak English is important for being truly American (76% vs. 65%) but less likely to say that being a U.S. citizen is important (67% vs. 75%). Meanwhile, the general public is more likely than Asian Americans to say it is important to be born in the U.S. or to be Christian to be considered truly American. For example, 26% of U.S. adults say being born in the U.S. is important to be truly American. Just 14% of Asian Americans say the same.
Fewer than half of U.S. Asians consider themselves typical Americans
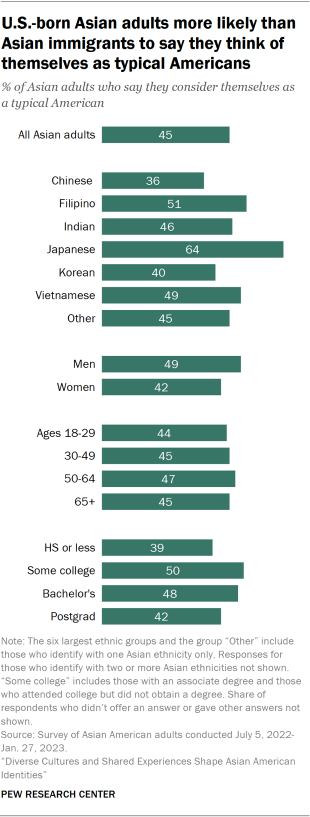
Asian Americans are split on whether they see themselves as typical Americans. Slightly fewer than half (45%) of Asian adults say they consider themselves “a typical American,” while 52% say they are “very different from a typical American.”
Among the largest Asian American ethnic groups, Japanese adults (64%) are more likely than Asian adults in general to say they think of themselves as typical Americans. By comparison, about half of Filipino (51%), Vietnamese (49%) and Indian (46%) adults say they think of themselves this way. And fewer than half of Korean (40%) and Chinese (36%) adults say the same. Meanwhile, about half of Asian men (49%) say they consider themselves typical Americans, a higher share than among women (42%).
Overall, U.S.-born Asians (69%) are more likely than those who are immigrants (37%) to say they are typical Americans.
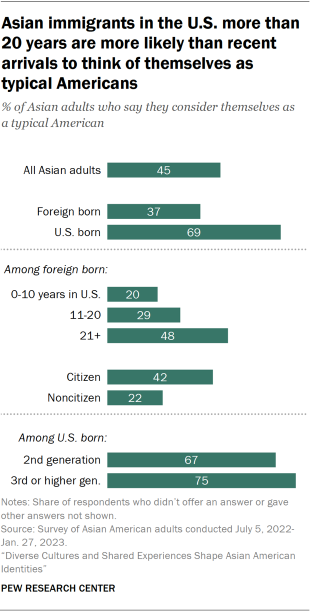
Among immigrants, about half of Asian adults who have been in the U.S. more than 20 years (48%) say they consider themselves typical Americans. This is more than double the share saying this among those who arrived in the past 10 years (20%). Naturalized citizens are also more likely than noncitizens to say they think of themselves as typical Americans (42% vs. 22%).
What do Asian Americans view as important for the American dream?
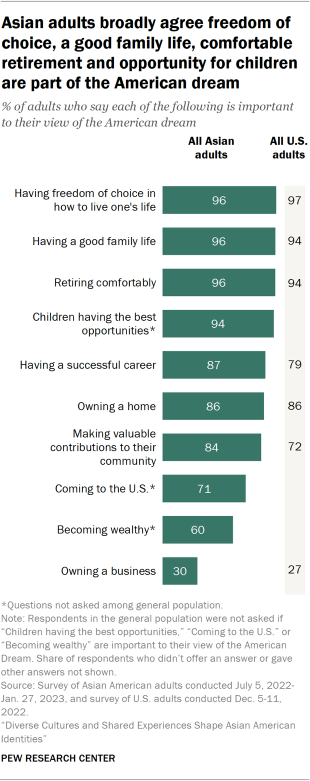
Nearly all Asian adults (96%) say that having freedom of choice to live one’s life, having a good family life and retiring comfortably are important to their view of the American dream. Meanwhile, far fewer say becoming wealthy (60%) or owning a business (30%) are important.
Compared with Asian adults, similar shares of the general U.S. adult population say freedom of choice (97%), a good family life (94%) and retiring comfortably (94%) are important to their view of the American dream.
And when it comes to the milestone of owning a home, Asian adults and the general population are just as likely to say it is important (86% each).
However, the general population is less likely than Asian Americans to say having a successful career (79%) and making valuable contributions to their community (72%) are important to their view of the American dream, though large majorities of both groups hold these views.
Most Asian adults say the American dream is within reach, but about a quarter say they will never achieve it
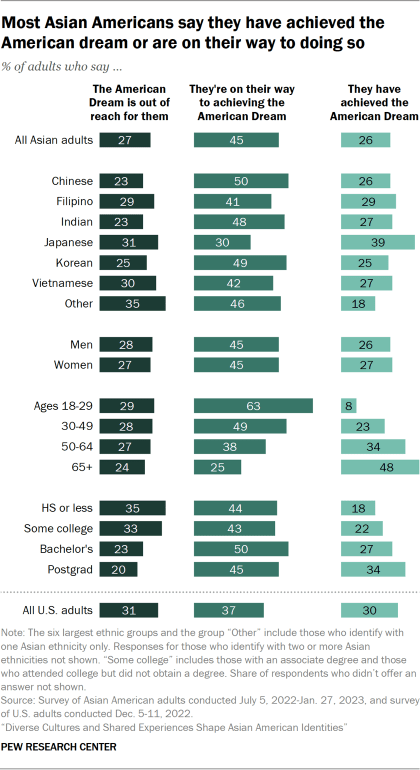
About seven-in-ten Asian adults (72%) believe they are on their way to achieving the American dream (45%) or that they have already achieved it (26%). Yet 27% say the American dream is out of reach for them.
Among the largest ethnic origins, Japanese adults (39%) are the only group that is more likely than Asian Americans overall to say they have achieved the American dream. Still, large majorities of each of the largest ethnic origin groups say they either have achieved the American dream or are on their way to doing so.
There are other important differences among U.S. Asians. Older Asian adults are more likely than younger Asian adults to say they have achieved the American dream. About half (48%) of those ages 65 and older say they have achieved the American dream, a higher share than for all other age groups among Asian adults. And while those 18 to 29 are the least likely to say they have achieved the American dream (8%), they are the most likely age group to say that they are on their way to achieving it (63%).
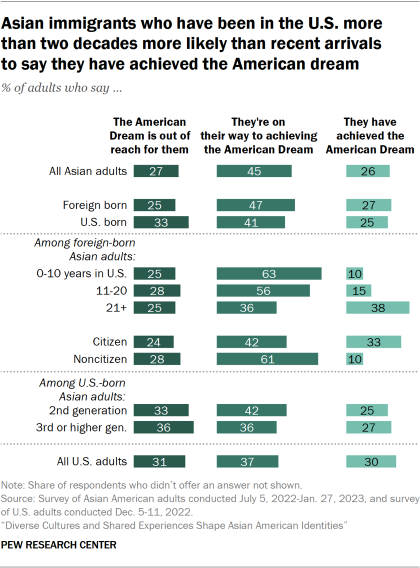
Asian immigrants are slightly more likely than those born in the U.S. to say they’re on their way to achieving the American dream – 47% vs. 41%. At the same time, those born in the U.S. (33%) are more likely than those born abroad (25%) to say it is out of reach for them.
Among Asian immigrants, 38% of those who have lived in the U.S. for more than two decades say they have achieved the American dream, while just 10% of those who arrived in the past 10 years say the same. At the same time, 63% of those who have been in the U.S. 10 years or less say they are on their way to achieving it.
When compared with the general U.S. adult population, Asian Americans differ slightly in their views of the American dream and in achieving it. U.S. adults overall are slightly more likely than Asian adults to say they have achieved the American dream (30%) or that it is out of reach for them (31%) but less likely to say they are on their way to achieving it (37%).