
Asian Americans are often portrayed as educationally and financially successful when compared with other racial or ethnic groups. However, Asian origin groups in the United States vary widely in their economic status and education level. Indeed, more than 2.3 million Asian Americans – about one-in-ten – lived in poverty in 2022, according to a Pew Research Center analysis of U.S. Census Bureau data.
Learn more about Asian Americans’ experiences with economic hardship in our data essay and short film.
Here are nine facts about Asian Americans living in poverty.
Pew Research Center conducted this analysis to better understand the characteristics, experiences and views of Asian Americans living in poverty today. It is part of a three-part study that includes an analysis of 18 focus groups conducted with 144 Asians living with economic hardship completed in February 2023 and a short film about Asian families who have experienced economic hardship.
This analysis is based on two main data sources. The first data source is the U.S. Census Bureau’s 2022 American Community Survey (ACS) provided through Integrated Public Use Microdata Series (IPUMS) from the University of Minnesota. In this analysis, poverty status is determined using the 2022 federal poverty line for the 48 contiguous states and the District of Columbia, Alaska, or Hawaii, depending on respondents’ state of residence, published by the U.S. Department of Health and Human Services. For example, a family of four living in 48 contiguous states and the District of Columbia were categorized as living “in poverty” if they make a yearly income of $27,750 or less.
The second data source is Pew Research Center’s 2022-23 survey of Asian American adults, conducted from July 2022 to January 2023 in six languages among 7,006 respondents. The survey analysis included 561 Asian adults whose approximate family income is at or below the 2022 federal poverty line for the 48 contiguous states and the District of Columbia, regardless of their state of residence. For more details, refer to the survey methodology. For questions used in this analysis, refer to the topline questionnaire.
Pew Research Center is a subsidiary of The Pew Charitable Trusts, its primary funder. The Center’s Asian American portfolio was funded by The Pew Charitable Trusts, with generous support from The Asian American Foundation; Chan Zuckerberg Initiative DAF, an advised fund of the Silicon Valley Community Foundation; the Robert Wood Johnson Foundation; the Henry Luce Foundation; the Doris Duke Foundation; The Wallace H. Coulter Foundation; The Dirk and Charlene Kabcenell Foundation; The Long Family Foundation; Lu-Hebert Fund; Gee Family Foundation; Joseph Cotchett; the Julian Abdey and Sabrina Moyle Charitable Fund; and Nanci Nishimura.
We would also like to thank the Leaders Forum for its thoughtful leadership and valuable assistance in helping make this survey possible.
The strategic communications campaign used to promote the research was made possible with generous support from the Doris Duke Foundation.
The terms Asians and Asian Americans are used interchangeably throughout this post to refer to individuals who self-identify as Asian, either alone or in combination with other races or Hispanic identity.
The terms living in poverty and living near or below the federal poverty line are used interchangeably throughout this post to refer to those whose family income is close to or below the 2022 federal poverty line.
- For results on Asian adults from the survey, this refers to adults whose approximate family income falls at or below 100% of the federal poverty line.
- For data on the total U.S. Asian population from the U.S. Census Bureau, this refers to all Asian Americans whose family income is at or below 100% of the federal poverty line.
The term U.S. born refers to people who are U.S. citizens at birth, including people born in the 50 U.S. states, the District of Columbia, Puerto Rico, or other U.S. territories, as well as those born elsewhere to at least one parent who is a U.S. citizen.
The term immigrants, when referring to Census Bureau data, includes those who were not U.S. citizens at birth – in other words, those born outside the 50 U.S. states or the District of Columbia, Puerto Rico, or other U.S. territories to parents who were not U.S. citizens. When referring to survey respondents, this group only includes those born outside the 50 U.S. States or the District of Columbia, Puerto Rico or other U.S. territories.
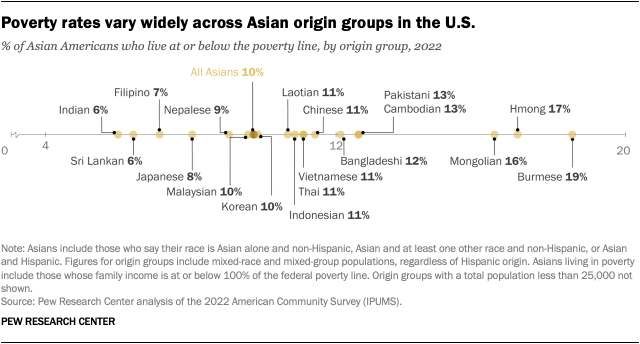
About 10% of Asian Americans overall live in poverty, but poverty rates vary widely across origin groups. Burmese (19%) and Hmong Americans (17%) were among the Asian origin groups with the highest poverty rates in 2022. Meanwhile, Filipino (7%) and Indian Americans (6%) were among the groups with the lowest poverty rates.
A third of Asian Americans ages 25 and older who live in poverty have a bachelor’s degree. By comparison, among non-Asians 25 and older who live in poverty, only 14% have a bachelor’s degree.
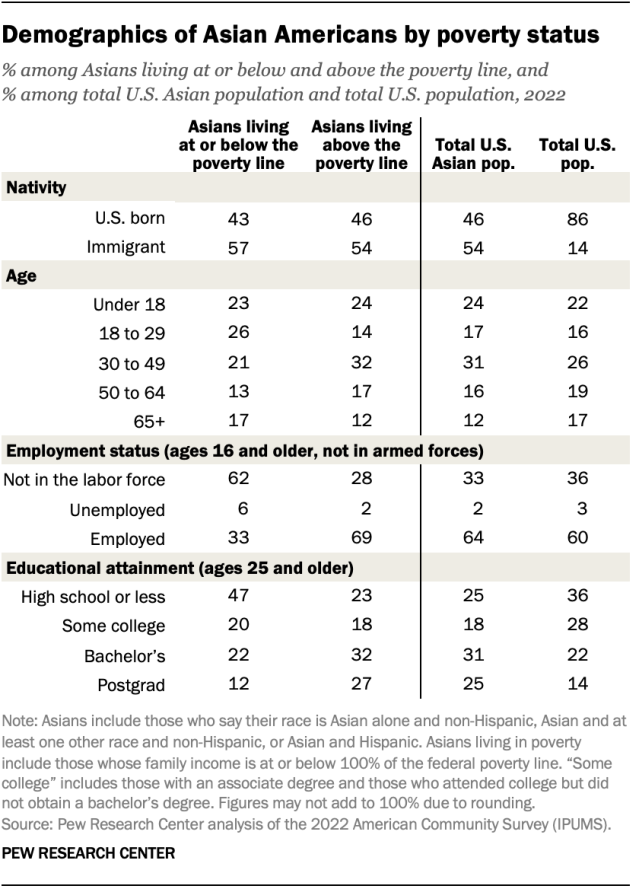
Asian Americans 25 and older with at least a bachelor’s degree are still less likely to live in poverty (5%) than those with less formal education (13%).
Nearly six-in-ten Asian Americans who live in poverty are immigrants. And relatively few of these immigrants speak English proficiently.
Among Asian immigrants ages 5 and older living below the poverty line, 44% are proficient in English (meaning they either speak only English or speak the language very well). By comparison, 61% of those immigrants above the poverty line speak English proficiently.
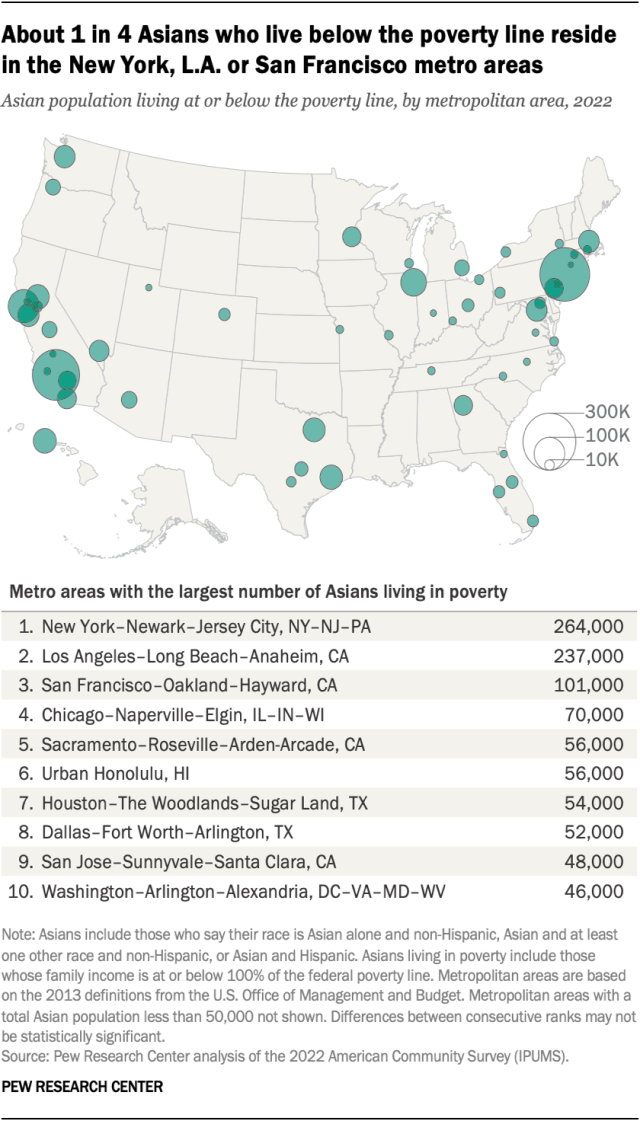
About 1 million Asians who are below the poverty line live in 10 U.S. metropolitan areas. In fact, more than 500,000 live in just three metropolitan areas: New York City, Los Angeles and San Francisco. These metro areas each have about 100,000 or more Asians living in poverty, and together they hold 26% of all Asian Americans living in poverty.
Fresno, California (19%), Buffalo, New York (18%) and Pittsburgh, Pennsylvania (15%) are among the metro areas with the highest poverty rates among Asian Americans. Still, Asian Americans who live in poverty largely reside in places with larger Asian populations than these metro areas.
Refer to a downloadable spreadsheet for detailed data on the number and share of Asians living in poverty by metro area.
Around eight-in-ten Asian adults who live in poverty (79%) have experienced financial challenges in some way in the past 12 months, according to a Pew Research Center survey of Asian adults conducted in 2022 and 2023. By contrast, 48% of Asian adults living above the poverty line say they have experienced the same. Among the specific financial challenges they faced:
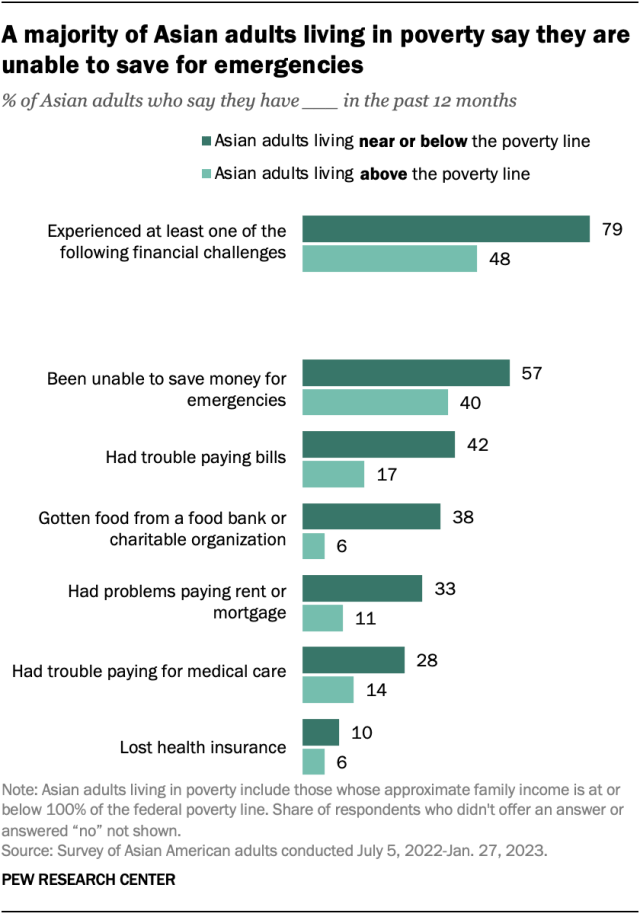
- 57% of Asian adults living in poverty were unable to save for emergencies, compared with 40% of Asian adults living above the poverty line.
- 42% had trouble paying their bills, more than twice the share of Asian adults living above the poverty line who said the same (17%).
- 38% have gotten food from a food bank or charitable organization, about six times the share among Asians living above the poverty line (6%).
Financial difficulties tend to come in bundles: Among those living in poverty who say they experienced at least one of the financial challenges asked about, 65% experienced two or more.
A majority of Asian adults who live in poverty (61%) have turned to family or friends for help with bills, housing, food or employment.
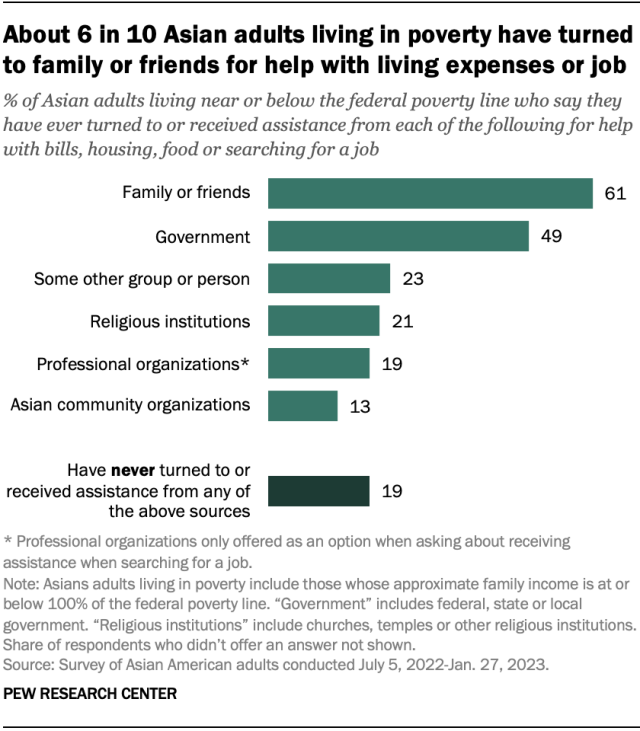
A large share (49%) also say they have sought help from local, state or federal governments. Smaller shares have sought help from religious institutions such as churches or temples (21%) or Asian community groups (13%).
However, 19% of Asian adults living in poverty say they have not sought help from any of the sources asked about in the survey.
Why Asian immigrants came to the U.S. is linked to whether they have received help from the government. For example, a third of all Asian immigrants, regardless of poverty status, who came to the U.S. due to conflict or persecution in their home country have received help with bills, housing, food or employment from governments (33%). By comparison, smaller shares of Asian immigrants who came for educational opportunities (14%) or economic opportunities (16%) or who migrated to be with family (25%) say the same.
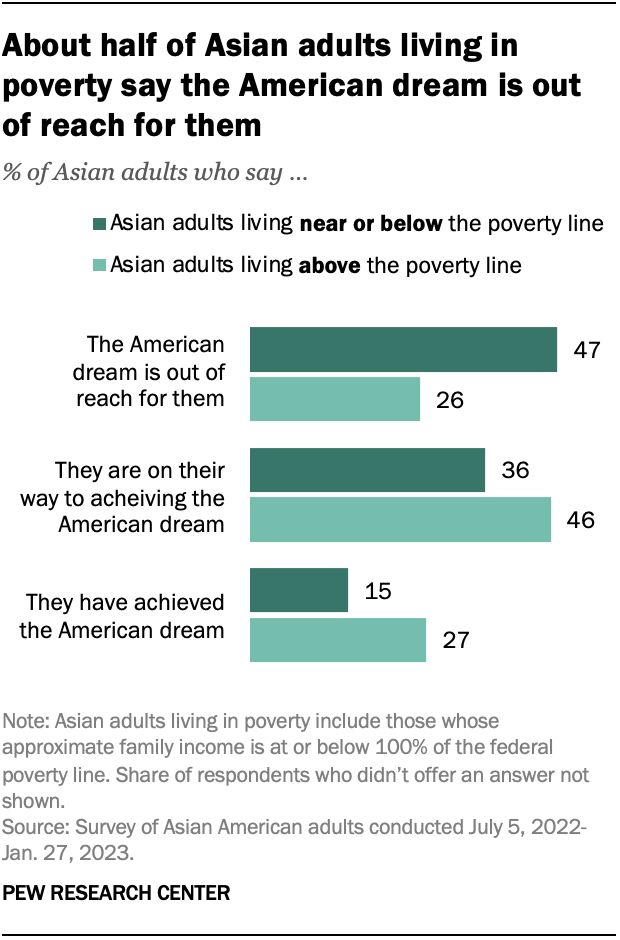
Roughly half of Asian Americans who live in poverty (47%) say the American dream is out of reach, but others say they have achieved it (15%) or are on their way to achieving it (36%). By comparison, Asians living above the poverty line are more optimistic about their chances of achieving the American dream: 26% say it is out of reach for them, while 27% say they have achieved it and 46% say they are on their way to achieving it.
Asian adults who live below the poverty line and those who live above it have similar views on what’s important to achieving the American dream. For Asians living in poverty, the vast majority say having freedom of choice in how to live one’s life (91%), a good family life (91%), children having the best opportunities (91%) and retiring comfortably (90%) are important to their view of the American dream. Among Asian adults living above the poverty line, similar shares say these elements are important.
Homeownership is also seen as key: 81% of Asian adults living in poverty and 87% of those living above the poverty line say owning a home is important to their view of the American dream. However, Asian adults in poverty are much less likely than those above the poverty line to be homeowners (40% vs. 71%), according to Census Bureau data.
Note: For more details, refer to the survey methodology. For questions used in this analysis, refer to the topline questionnaire.

