
Reflecting the public’s unhappiness with the U.S. political system, there is broad support for a number of significant structural changes to politics:
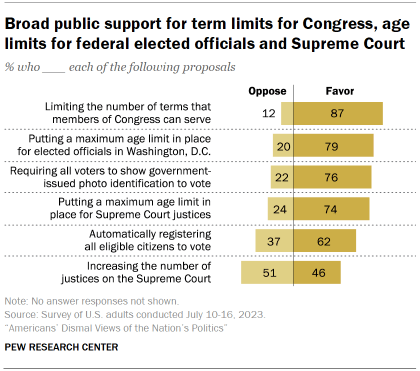
Term limits for members of Congress. An overwhelming majority of adults (87%) favor limiting the number of terms that members of Congress are allowed to serve. This includes a majority (56%) who strongly favor this proposal; just 12% are opposed.
Maximum age limits for elected officials in Washington, D.C., and Supreme Court justices. Nearly eight-in-ten adults (79%) favor maximum age limits for elected officials in Washington, while 74% favor a maximum age limit for Supreme Court justices.
Requiring voters to show government-issued identification. By more than three-to-one (76% to 22%), Americans support requiring all voters to show government-issued photo identification in order to vote. These views are little changed from 2021.
A narrower majority (62%) favors automatically registering all eligible citizens to vote.
A proposal to increase the number of justices on the Supreme Court, by contrast, draws slightly more opposition (51%) than support (46%).
Overwhelming majorities in both parties favor term limits for members of Congress
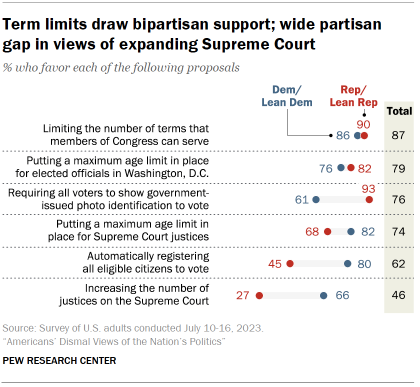
Term limits for members of Congress are widely popular with both Republicans and Republican-leaning independents (90%) and Democrats and Democratic leaners (86%).
Establishing age limits for elected officials in Washington, D.C., also draws broad bipartisan support.
There are wider partisan differences in views of putting a maximum age limit for Supreme Court justices. Still, 82% of Democrats and 68% of Republicans support age limits for the justices.
As in past surveys, Republicans and Democrats hold different views of proposals to change how voting works in this country.
Nearly all Republicans support requiring all voters to show government-issued identification (93% favor this), compared with a narrower majority (61%) of Democrats. Meanwhile, Democrats (80%) are much more likely than Republicans (45%) to favor automatically registering all eligible citizens to vote.
Increasing the number of justices on the Supreme Court is supported by about two-thirds of Democrats (66% favor). But only about a quarter of Republicans (27%) favor expanding the size of the court, while more than twice as many (72%) are opposed.
Young adults more likely than older people to support adding Supreme Court justices
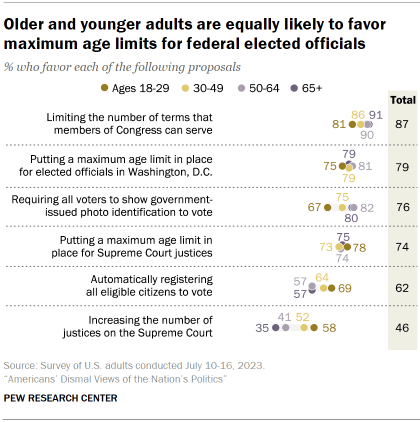
There are fairly modest age differences in views of most of these proposals. However, adults under age 50 are more likely than those 50 and older to favor automatically registering all eligible citizens to vote (66% vs. 57%).
And a majority of adults under 30 (58%) favor increasing the number of justices on the Supreme Court. Support for this proposal decreases with age: About a third (35%) of those 65 and older favor this.
These age differences are more pronounced among Republicans than Democrats. About four-in-ten Republicans ages 18 to 29 (44%) favor expanding the court, but that drops steadily with age; just 13% of Republicans 65 and older support this. In contrast, Democrats in all age groups are nearly equally likely to favor increasing the number of justices on the court.
Views of the Electoral College
Nearly two-thirds of Americans (65%) favor changing the current system for presidential elections so that the candidate who receives the most votes wins, while a third prefer to keep the current system so that the candidate who wins the Electoral College vote wins the election.
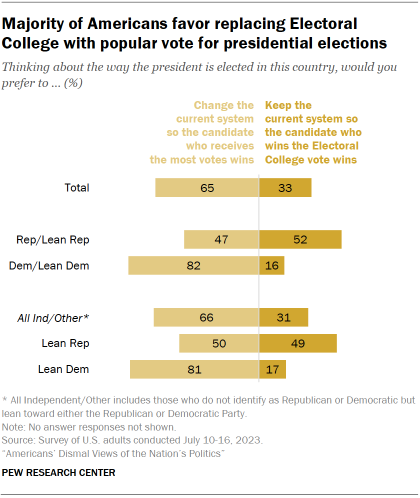
Support for changing the current system has ticked up slightly since last summer.
Democrats remain much more likely to favor a popular vote system for presidential elections than Republicans: 82% of Democrats and Democratic leaners say they would prefer to change the current system, compared with 47% of Republicans and Republican leaners.
Among all political independents and others who don’t identify with a party, about two-thirds (66%) favor changing the current system so the candidate who receives the most votes wins, while 31% prefer to keep the current Electoral College system. However, Democratic-leaning independents are much more supportive of changing the Electoral College system than Republican-leaning independents.
Should the size of the U.S. House of Representatives change?
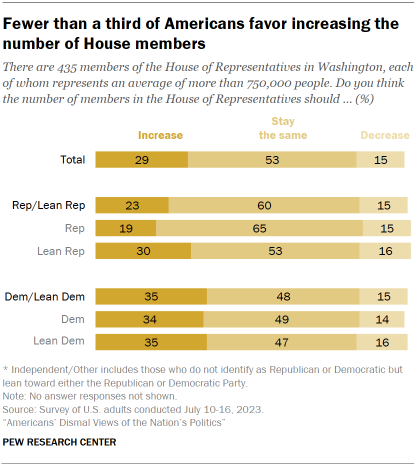
About three-in-ten adults (29%) say the size of the House of Representatives should be increased beyond its current 435 members, while a narrow majority (53%) say the size of the House should stay the same. Another 15% prefer to decrease the size of the House.
Democrats are more likely than Republicans to say that the number of members in the House should increase, though larger shares in both parties favor keeping the House at its current size.
About a third of Democrats and Democratic leaners (35%) favor increasing the size of the House, compared with 23% of Republicans and Republican leaners.
Republican-leaning independents (30%) are more likely than GOP partisans to favor increasing the size of the House (19%). The views of Democratic-leaning independents on this question are nearly identical to those of Democratic identifiers.
Senate seats and population size
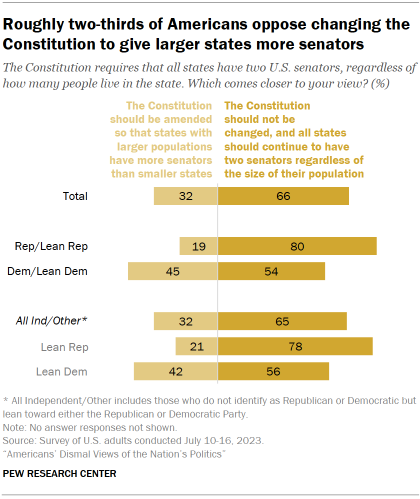
When it comes to the Senate, 66% of adults say that the method of determining representation in the upper chamber should not be changed, and all states should continue to have two senators regardless of population size. Roughly half as many (32%) say that the Constitution should be amended so that states with larger populations have more senators than smaller states.
Eight-in-ten Republicans favor maintaining the Senate’s present structure.
Among Democrats, a narrower majority (54%) favor the current allocation, while 45% say the Constitution should be amended.
The views of independents are similar to the overall public’s views, with 65% preferring to keep the current system as-is. However, Democratic-leaning independents’ views are nearly identical to Democratic partisans’ views, while Republican-leaning independents’ views are nearly identical to Republicans’ views.
Younger adults more supportive of structural changes
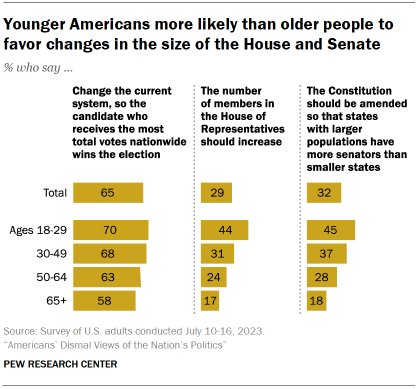
Younger adults are more likely than older adults to favor a popular vote for president, an expansion of the House of Representatives and a change to the way representation in the Senate is apportioned.
While majorities of adults across age groups support changing the presidential election system so the candidate who wins the popular vote wins the election, this view is more common among those under 50 (69%) than among those ages 50 and older (61%).
Age differences are larger when it comes to changes to the structure of Congress, with support for changes decreasing with age. Adults under 30 are much more likely than those 65 and older to say both that the number of House members should be increased (44% vs. 17%) and that the Constitution should be amended so that more populous states have more senators than smaller states (45% vs. 18%).
