
Pew Research Center conducted this analysis to understand the changes in partisan identification over time as well as the changing composition of the U.S. electorate and partisan coalitions. For this analysis, we used annual totals of data from Pew Research Center telephone surveys among registered voters. Due to smaller sample sizes in 2018 and 2019, the data from those years has been combined in Chapter 1. The surveys were conducted in both English and Spanish. Each survey reflects a balanced cross section of the nation, with the data weighted to match the U.S. adult population by gender, age, education, race and ethnicity and other categories.
For the most recent data on partisan identification in the U.S., read this April 2024 report: Changing Partisan Coalitions in a Politically Divided Nation
Note that the 2024 report is based on data from online surveys, with historical telephone data adjusted to make trends directly comparable to online surveys. As a result, the historical point estimates in this 2020 report differ from those in the 2024 report. There is nothing inaccurate about this 2020 report. Both reports tell essentially the same story about trends in American voters’ partisanship. Visit Appendix A of the 2024 report for more detail.
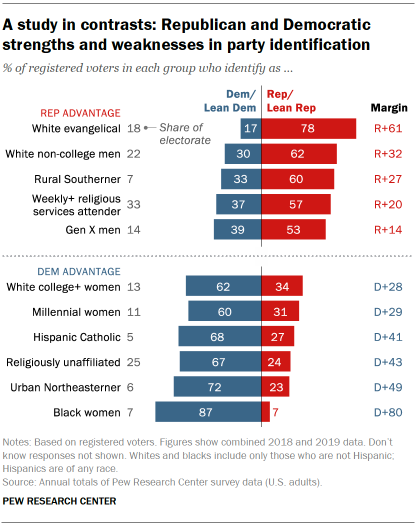
Republicans hold wide advantages in party identification among several groups of voters, including white men without a college degree, people living in rural communities in the South and those who frequently attend religious services.
Democrats hold formidable advantages among a contrasting set of voters, such as black women, residents of urban communities in the Northeast and people with no religious affiliation.
With the presidential election on the horizon, the U.S. electorate continues to be deeply divided by race and ethnicity, education, gender, age and religion. The Republican and Democratic coalitions, which bore at least some demographic similarities in past decades, have strikingly different profiles today.
A new analysis by Pew Research Center of long-term trends in party affiliation – based on surveys conducted among more than 360,000 registered voters over the past 25 years, including more than 12,000 in 2018 and 2019 – finds only modest changes in recent years.
Overall, 34% of registered voters identify as independents, 33% as Democrats and 29% as Republicans. The share of voters identifying as Republicans is now the same as it was in 2016, after having ticked down in 2017; Democratic identification is unchanged. Slightly fewer voters identify as independents than in 2017 (34% vs. 37%). See detailed tables.
Most independents lean toward one of the major parties (leaners tend to vote and have similar views as those who identify with a party), and when the partisan leanings of independents are taken into account, 49% of registered voters identify as Democrats or lean Democratic, while 44% affiliate with the GOP or lean Republican.
There have been few significant changes in party identification among subgroups of voters since 2017. Yet over a longer period, dating back more than two decades, there have been profound shifts in party identification among a number of groups as well as in the composition of the overall electorate. This is reflected in the starkly different profiles of the Republican and Democratic coalitions:
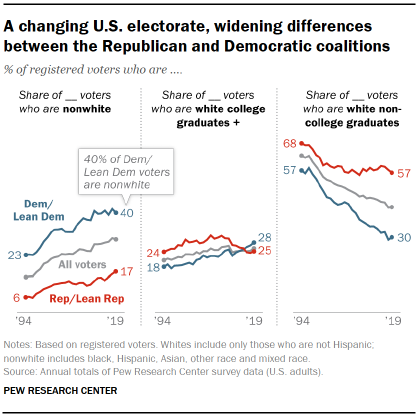
Race and ethnicity. White non-Hispanic voters continue to identify with the Republican Party or lean Republican by a sizable margin (53% to 42%). Yet white voters constitute a diminished share of the electorate – from 85% in 1996 to 69% in 2018/2019. And the growing racial and ethnic diversity of the overall electorate has resulted in a more substantial change in the composition of the Democratic Party than in the GOP: Four-in-ten Democratic registered voters are now nonwhite (black, Hispanic, Asian and other nonwhite racial groups), compared with 17% of the GOP.
Education and race. Just as the nation has become more racially and ethnically diverse, it also has become better educated. Still, just 36% of registered voters have a four-year college degree or more education; a sizable majority (64%) have not completed college. Democrats increasingly dominate in party identification among white college graduates – and maintain wide and long-standing advantages among black, Hispanic and Asian American voters. Republicans increasingly dominate in party affiliation among white non-college voters, who continue to make up a majority (57%) of all GOP voters.
Age and generations. The electorate is slowly aging: A 52% majority of registered voters are ages 50 and older; in both 1996 and 2004, majorities of voters were younger than 50. Two decades ago, about four-in-ten voters in both parties were 50 and older; today, these voters make up a majority of Republicans (56%) and half of Democrats. Looking at the electorate through a generational lens, Millennials (ages 24 to 39 in 2020), who now constitute a larger share of the population than other cohorts, also are more Democratic leaning than older generations: 54% of Millennials identify with the Democratic Party or lean Democratic, while 38% identify with or lean to the GOP.
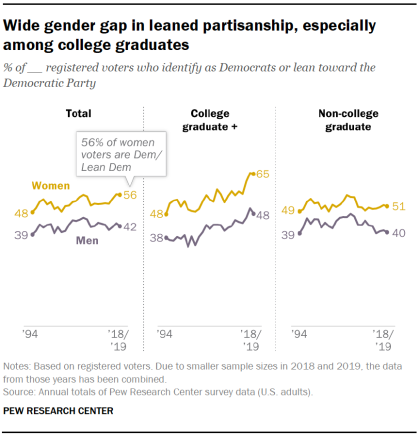
The gender gap. The gender gap in party identification is as large as at any point in the past two decades: 56% of women align with the Democratic Party, compared with 42% of men. Gender differences are evident across a number of subgroups: For example, women who have not completed college are 11 percentage points more likely than men to identify as Democrats or lean Democratic (51% to 40%). The gap is even wider among those who have at least a four-year degree (65% of women, 48% of men).
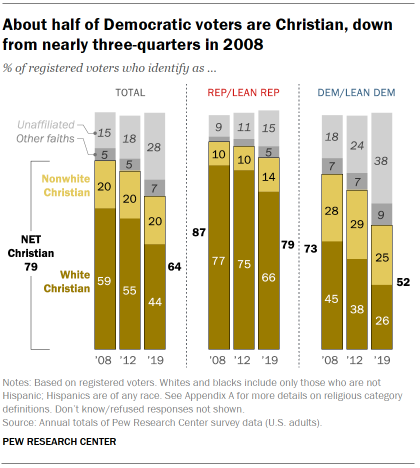
Religious affiliation. The U.S. religious landscape has undergone profound changes in recent years, with the share of Christians in the population continuing to decline.
These shifts are reflected in the composition of the partisan coalitions. Today, Christians make up about half of Democratic voters (52%); in 2008, about three-quarters of Democrats (73%) were Christians. The share of Democratic voters who are religiously unaffiliated has approximately doubled over this period (from 18% to 38%).
The changes among Republicans have been far more modest: Christians constitute 79% of Republican voters, down from 87% in 2008. (Data on religious affiliation dates to 2008; prior to that, Pew Research Center asked a different question about religious affiliation that is not directly comparable to its current measure.)
CORRECTION (June 2, 2020): The following sentence was updated to reflect that millennials constitute a larger share of the U.S. population than other cohorts: “Looking at the electorate through a generational lens, Millennials (ages 24 to 39 in 2020), who now constitute a larger share of the population than other cohorts, also are more Democratic leaning than older generations…” The changes did not affect the report’s substantive findings.
