
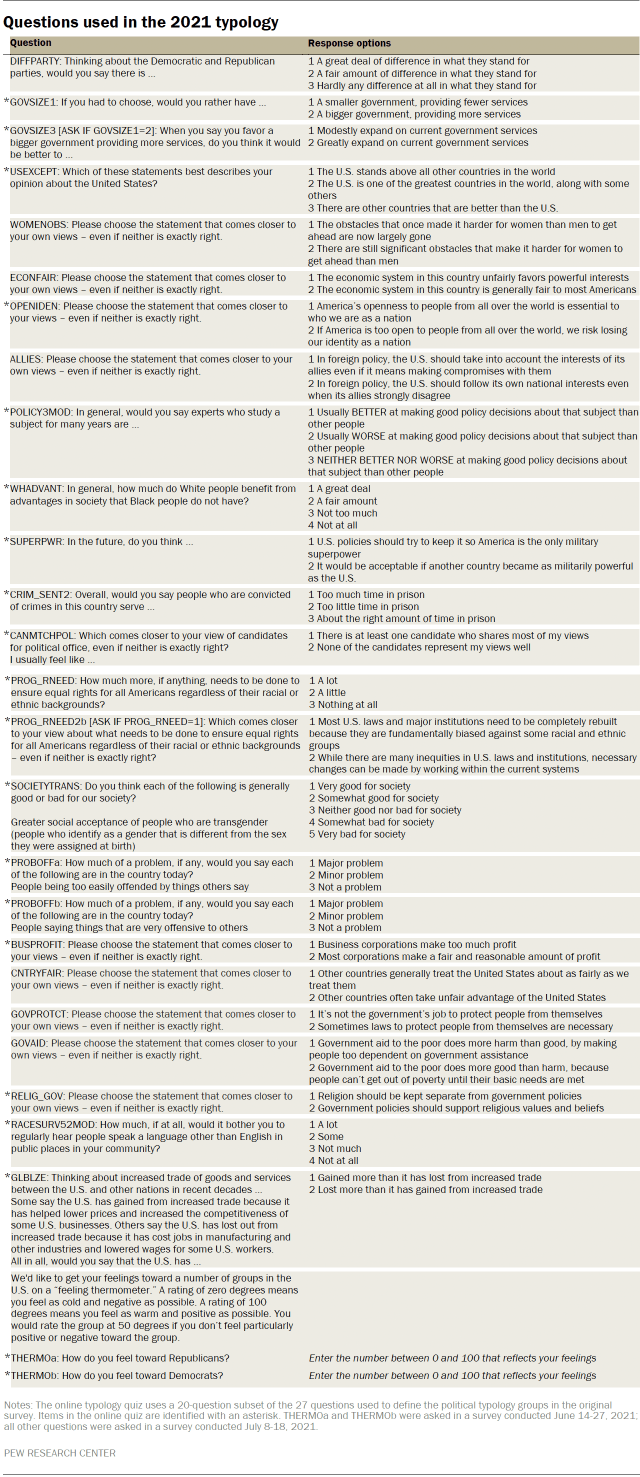
The 2021 political typology divides the public into nine groups. The assignment of individuals to one of the nine groups is based on their responses to 27 questions about social and political values.
The table below lists the items used in the construction of the typology groups. Items included in the typology construction measure a variety of different political values. Many of these values items are similar to those used in past typology studies.
The typology groups are created with a statistical procedure that uses respondents’ scores on all 27 items to sort them into relatively homogeneous groups. The specific statistical technique used to calculate group membership is weighted clustering around medoids (using the WeightedCluster package version 1.4-1 in R version 4.1.1). The items selected for inclusion in the clustering were chosen based on extensive testing to find the model that fit the data best and produced groups that were substantively meaningful. Most prior Pew Research Center typologies used a closely related method, cluster analysis via the k-means algorithm, to identify groups.
Decisions made at different points in the analysis can have a dramatic impact on the ultimate results of any data partitioning exercise. Different solutions are possible using the same data depending on the algorithm used for partitioning, the ways in which the variables are coded, and even the order in which respondents are sorted. For more details on decisions made during the cluster analysis, see “Behind Pew Research Center’s 2021 Political Typology.”
Missing data imputation
Most of the variables used in the clustering solution were from the W92 ATP survey, but the two party “feeling thermometers” were from the previous wave (W91). There were a small number of respondents (310 in total) who responded to W92 but not W91. There was also a small amount (ranging from 24 cases to 354 cases) of item nonresponse in the measures used. To account for the missingness in the measures, multiple imputation (via the mice package version 3.13.0 in R) using predictive mean matching was used. This resulted in 10 copies of the dataset to account for uncertainty in the imputation. For the clustering algorithm, these 10 imputed datasets were stacked and the algorithm partitioned the stacked dataset. In rare cases where a single respondent was classified into multiple groups because of variation in the multiply imputed data, the assignment from one of the 10 imputed datasets was selected at random. This means that if a respondent with missing data was classified eight times as a Faith and Flag Conservative and twice as a Committed Conservative, they had an 80% chance of being assigned to the Faith and Flag group and a 20% chance of being assigned to the Committed Conservative group.
Coding of input variables
Many data partitioning methods are sensitive to the scaling of the variables. For this project, variables were standardized by subtracting their means and dividing by their standard deviations. This has the effect of equalizing the impact of each variable and putting more weight on responses to each question that are distinctive. In several cases, question sets that were filtered (for example, the GOVSIZE set) were combined into a single ordinal measure that was treated as continuous for the purposes of the partitioning.
Selecting the number of groups
Solutions with different numbers of groups were examined, and the results evaluated for their effectiveness in producing cohesive groups that were sufficiently distinct from one another and large enough in size to be analytically practical and substantively meaningful.
Other methodological decisions
To address the potential sensitivity of cluster analysis to the order in which cases are entered, each model was run several times. The k-medoids algorithm was robust to different initial conditions and consistently returned the same results even with different random starts.
While each model differed somewhat from the others, all of them shared certain key features. The final model selected to produce the political typology was judged to be strong from a statistical point of view, most persuasive from a substantive point of view, and was representative of the general patterns seen across the various models run.
In past political typologies, so-called “Bystanders” (politically disengaged Americans) were identified and excluded from the analysis out the outset. For the 2021 typology, the clustering was performed using only data from registered voters. Less politically engaged Americans tend to have less common patterns of attitudes, and excluding those who are not registered to vote from the clustering had the effect of sharpening the distinctions between the groups. Although they were not used in the modeling, unregistered respondents were assigned to the group to which they were most similar and are included in the analysis.
Adjusting income and defining income tiers
To create upper-, middle- and lower-income tiers, respondents’ 2020 family incomes were adjusted for differences in purchasing power by geographic region and household size. “Middle-income” adults live in families with annual incomes that are two-thirds to double the median family income in the panel (after incomes have been adjusted for the local cost of living and household size). The middle-income range for the American Trends Panel is about $42,000 to $125,900 annually for an average family of three. Lower-income families have incomes less than roughly $42,000, and upper-income families have incomes greater than roughly $125,900 (all figures expressed in 2020 dollars).
Based on these adjustments, 31% of respondents are lower income, 47% are middle income and 17% fall into the upper-income tier. An additional 6% either didn’t offer a response to the income question or the household size question.
For more information about how the income tiers were determined, please see here.
Combining multiple waves
The 2021 Typology is the first time Pew Research Center has conducted its typology analysis on the American Trends Panel. The move to our online panel presents a number of advantages chief among them being the ability to use multiple surveys together for analysis. This report uses responses from 12 separate surveys, as well as records from commercial voter files previously matched to members of the panel (see Survey Methodology for more details about the surveys and their methodologies).
This depth of data is unprecedented for the political typology (and most other Pew Research Center reports). For example, the 2017 typology report was based on two telephone surveys: an initial survey to collect the typology measures, and a “call back” survey that was used for some additional content. The 2021 typology has both one of the largest sample sizes we have had for a political typology (more than 10,000 interviews in 2021) and a much wider selection of data attached to each case in the data than in past years (in theory, anything asked over the seven years of the ATP’s existence could have been used, but because of both methodologically practical reasons and a plethora of data, analysis is restricted to surveys conducted since January 2020). Having access to so much additional data also created some challenges. Beyond just narrowing our attention to what we felt were the key factors to focus on, using data from linked surveys required addressing nonresponse to a given panel wave and the recruitment of new panelists (as well as retirement of some prior panelists).
| ATP wave | Survey field dates |
|---|---|
| W59 | Jan 6-19, 2020 |
| W78 | Nov 12-17, 2020 |
| W80 | Jan 8-12, 2021 |
| W84 | Mar 1-7, 2021 |
| W85 | Mar 8-14, 2021 |
| W87 | Apr 5-11, 2021 |
| W89 | Apr 20-29, 2021 |
| W91 | Jun 14-27, 2021 |
| W92 | Jul 8-18, 2021 |
| W93 | Jul 26-Aug 8, 2021 |
| W94 | Aug 23-29, 2021 |
| W95 | Sept 13-19, 2021 |
“Beyond Red vs. Blue: The Political Typology”
ATP participants are asked to complete surveys every few weeks, but not all participants respond to every survey invitation. Additionally, new panelists are recruited to the panel every year, so when doing any analysis that spans more than one wave of the panel there is inevitably some missing data. For this project, custom cross-wave weights were created to deal with this issue. Each analysis in the report uses data from W92 (where the questions used to construct the typology were asked), and in cases where responses from another wave were needed a weight using the cases that were present in both waves was used.
Media measures
Measures of media use come from ATP W85 as a part of a larger study of media use and perceptions. Respondents were asked to identify the news outlets that they had used in the previous week to get political news. For more on how Pew Research Center measures media consumption see “Measuring News Consumption in a Digital Era.”
Validated voting measures
Voter turnout and vote choice in the 2020 election is based on two different sources. First, self-reports of candidate choice were collected immediately after the general election in November 2020 (ATP W78). Secondly, ATP panelists were matched to commercial voter file databases to verify that they had indeed voted in the election. For more details, see “Behind Biden’s 2020 Victory.”
Measuring partisan identification
In every case where partisanship is discussed in this report, the latest measures of party identification were used. These were collected in late July and early August 2021 (ATP W93). In some cases, this created small conflicts with earlier questions that were filtered on an earlier ask of partisanship. For example, panelists were asked about their Democratic presidential primary preference in January 2020 (ATP W59). These questions were not asked of those who identified with or leaned toward the Republican Party (e.g., they were asked only of those who identified or leaned toward the Democratic Party or expressed no partisan leaning). Partisanship is a very stable identity, but it does change. In the rare cases where respondents have changed their partisan identification between waves and so were not asked a previous question that may have been filtered on a prior measure of partisanship, the analysis of these items was restricted to those who received the question.


