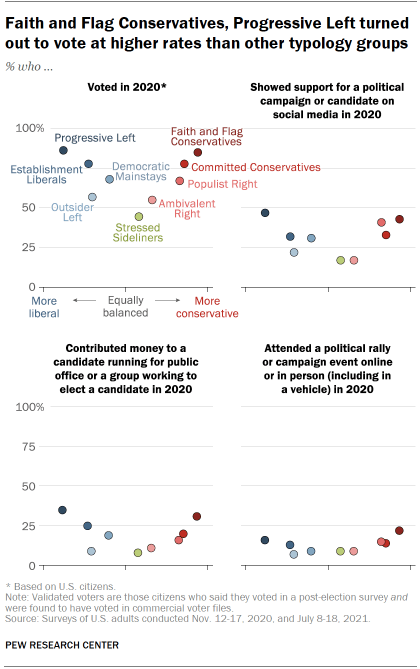
The typology groups at either end of the political spectrum, Faith and Flag Conservatives and Progressive Left, are also the most politically engaged – that is, they voted at the highest rates in the 2020 presidential election, and they are most likely to say they post about politics on social media and that they donated to campaigns. The groups in the middle of the ideological spectrum have much lower levels of political engagement.
This pattern is not new. Pew Research Center’s 2014 study of partisan polarization found that “many of those in the center remain on the edges of the political playing field, relatively distant and disengaged, while the most ideologically oriented and politically rancorous Americans make their voices heard through greater participation in every stage of the political process.”
This is often referred to as the “U shape” in political engagement. Voter turnout of the typology groups in the 2020 election largely fits this pattern: About 85% of citizens in these more ideological groups were validated voters in 2020 (86% for Progressive Left and 85% for Faith and Flag Conservatives).
Moving from either of end of the typology toward slightly more ideologically mixed groups shows a gradual decrease in turnout. Establishment Liberals and Committed Conservatives turned out at slightly lower rates (78% each), though both groups still participated at substantially higher rates than the overall population. Democratic Mainstays and Populist Right were somewhat lower still (68% and 67%, respectively). Outsider Left diverge slightly from this pattern – while they are notably more liberal than conservative, and more liberal than Democratic Mainstays, they voted at a lower rate (57%).
Ambivalent Right, a relatively mixed group ideologically, also had lower turnout (55%), while the very politically mixed Stressed and Sidelined turned out at the lowest rate (45%) of all the groups.
While there are demographic differences between the groups that are also associated with political participation, different rates of participation between the groups persist even after accounting for demographic composition. For example, Progressive Left are among the groups with the highest levels of formal education. Nearly half of this group (48%) has a bachelor’s degree or more education, and education is strongly associated with turnout. Yet Progressive Left without a bachelor’s degree voted at rates higher or as high as members of other groups with college degrees, and the same can be said about Faith and Flag Conservatives without a college degree.
The more ideological groups are most likely to have reported contributing money to candidates and political organizations in 2020, to post support for a candidate or campaign on social media, and to attend political rallies in person or virtually (for more examples of this pattern, see the detailed tables).
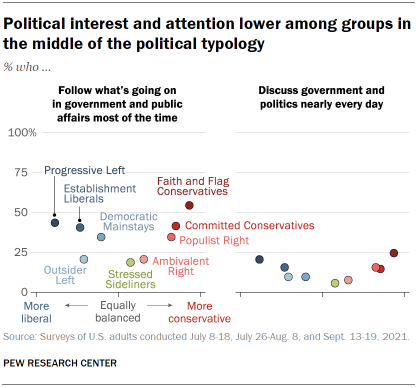
The generally U-shaped pattern also shows up across other measures of political engagement and interest. The more ideological groups register much higher levels of interest in politics. More than half of Faith and Flag Conservatives (55%) say they follow what is going on in government most of the time, followed by Progressive Left (44%), Establishment Liberals (41%) and Committed Conservatives (42%). By comparison, only 19% of Stressed Sideliners say they keep such close tabs on politics and government.
As with political participation, this pattern shows up across a range of different measures. For instance, Progressive Left and Faith and Flag Conservatives are generally more likely than other groups to talk about politics frequently.
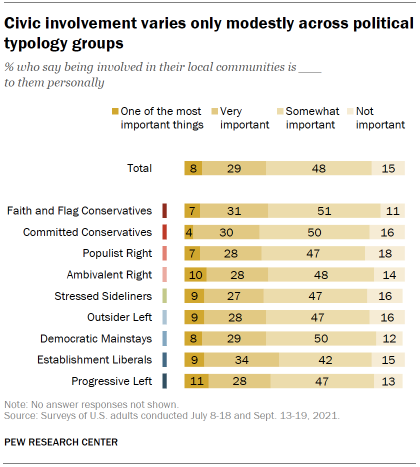
However, this U-shaped pattern seems to be largely confined to political engagement. By comparison, there are only modest differences across typology groups in the shares saying it is important for them to be involved in their local communities. There is also not the same discernable pattern when it comes to reports of volunteering. About 25% to 35% in each group say they have spent time volunteering at some point over the past year.


