
Pew Research Center conducted this study to understand how Americans voted in 2020 and how their turnout and vote choices differed from 2016 and 2018. For this analysis, we surveyed U.S. adults online and verified their turnout in the three elections using commercial voter files that aggregate publicly available official state turnout records. With a small number of exceptions as noted below, panelists for whom a record of voting was located are considered validated voters; all others are presumed not to have voted.
The analysis in this report relies on two slightly different sets of data drawn from the same pool of panelists. The bulk of the report provides comparisons of the 2020 vote by various groups in the population, taken from the 2020 post-election survey (described below), with similar reporting from post-election surveys conducted after the 2016 presidential and 2018 congressional elections. Estimates for 2016 and 2018 in this part of the report are identical to those published in Pew Research Center’s earlier reports and rely solely on the relevant post-election surveys at the time. The 2020 report does not include a small number of estimates from the 2016 report (principally, for subgroups among Hispanic voters) because of a change in the Center’s standards for the minimum acceptable sample size for reporting.
The other part of this report (primarily in the introduction and first few pages) examines change and continuity in turnout and vote choice among individual panelists. For this analysis we attempted to measure voter turnout and vote choice for all three elections for all panelists who took the 2020 post-election survey, including the large number of 2020 respondents who were not members of the panel in 2016 or 2018. To account for this, we obtained measures of turnout and vote choice for these panelists in subsequent annual recruitment and profile surveys from 2018 and 2020, as described below.
The post-election surveys used in this report included interviews with 11,818 U.S. adults in November 2020, 10,640 adults in November 2018 and 4,183 adults in November and December 2016. Everyone who took part is a member of Pew Research Center’s American Trends Panel (ATP). The surveys are weighted to be representative of the U.S. adult population by gender, race, ethnicity, partisan affiliation, education, and many other characteristics, as described below.
American Trends Panel Methodology
The American Trends Panel (ATP), created by Pew Research Center, is a nationally representative panel of randomly selected U.S. adults. This report is based on interviews from three separate waves of the panel, one conducted Nov. 29-Dec. 12, 2016, one conducted Nov. 7-16, 2018, and the final one conducted Nov. 12-17, 2020. Panelists participate via self-administered web surveys. Panelists who do not have internet access are provided with a tablet and wireless internet connection. Interviews are conducted in both English and Spanish. At the time of the Nov. 29-Dec. 12, 2016 survey, the panel was managed by Abt, and it is currently being managed by Ipsos, which oversaw data collection for the 2018 and 2020 surveys.
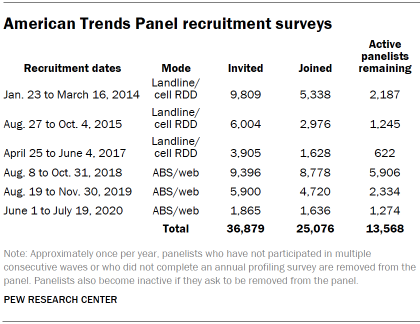
The ATP was created in 2014, with the first cohort of panelists invited to join the panel at the end of a large, national, landline and cellphone random-digit-dial survey that was conducted in both English and Spanish. Two additional recruitments were conducted in 2015 and 2017 using the same method. Across these three surveys, a total of 19,718 adults were invited to join the ATP, of whom 9,942 (50%) agreed to participate.
In August 2018, the ATP switched from telephone to address-based recruitment. Invitations were sent to a random, address-based sample of households selected from the U.S. Postal Service’s Delivery Sequence File. Two additional recruitments were conducted in 2019 and 2020 using the same method. Across these three address-based recruitments, a total of 17,161 adults were invited to join the ATP, of whom 15,134 (88%) agreed to join the panel and completed an initial profile survey. In each household, the adult with the next birthday was asked to go online to complete a survey, at the end of which they were invited to join the panel. Of the 25,076 individuals who have ever joined the ATP, 13,568 remained active panelists and continued to receive survey invitations at the time this survey was conducted.
The 2020 survey
The 2020 survey was conducted Nov. 12-17, 2020, with 11,818 panelists. Noncitizens and those who refused the citizenship question (N=450), voters who refused to answer the vote choice question (N=84) and panelists who declined to provide their names and thus could not be matched to a voter record (N=139) were removed, leaving 11,145 panelists for analysis.
An effort was made to match the panelists to three commercial voter files: one that serves conservative and Republican organizations and campaigns, one that serves progressive and Democratic organizations and campaigns, and one that is nonpartisan. People for whom a registration record could not be found are included in the files but likely underrepresent nonvoters. Because of a law passed in 2018, Utah residents can opt to keep their voter registration and vote history data private. Consequently, Utah residents in the American Trends Panel are considered to be voters if they reported having voted when asked in the post-election survey.
Overall, 97% of voting eligible panelists were matched to at least one of these files and a turnout record for 2020 (or self-report for Utah) was located for 9,668 panelists. Panelists who could not be matched or for whom no 2020 turnout record could be located were considered to be validated nonvoters (1,477 panelists).
Additional details about the administration of this survey can be found here.
The 2016 survey
The 2016 survey was conducted between Nov. 29 and Dec. 12, 2016, with 4,183 respondents. Noncitizens and panelists who declined to provide their names and thus for whom a match to a voter record could not be attempted were removed from the analysis, leaving 3,770 panelists for analysis. An effort was made to match the panelists to five commercially available databases that contain information about voter registration and turnout for nearly every U.S. adult. In total, 91% of panelists were located in at least one of the files. Panelists who were verified as having voted in at least one of the commercial voter databases were considered to be validated voters (3,014 individuals) and are included in the tabulations. Panelists for whom no turnout record was located were considered to be nonvoters (756 individuals).
The validation process is discussed in detail in a more general report about commercial voter files published in February 2018, “Commercial Voter Files and the Study of U.S. Politics.”
The 2016 vote choices reported here are based on panelists who said that they voted and were verified as having done so. Those who refused to state their vote choice or who reported voting for a candidate other than Hillary Clinton, Donald Trump, Gary Johnson or Jill Stein were excluded from the analysis.
The resulting sample of verified voters mirrored the election results very closely. After the validation was done and the sample was limited to those for whom a turnout record could be located, 48% reported voting for Clinton and 45% for Trump. By comparison, the official national vote tally was 48% for Clinton and 46% for Trump.
The 2018 survey
The 2018 post-election survey was conducted Nov. 7-16, 2018, with 10,640 panelists. Noncitizens, those who refused to answer the vote choice question and panelists who declined to provide their names and thus could not be matched to a voter record were removed, leaving 10,144 panelists for analysis. An effort was made to match the panelists to two commercial voter files. Overall, 94% of panelists were matched to at least one file and a turnout record for 2018 was located for 7,585 panelists. Panelists who could not be matched or for whom no 2018 turnout record could be located were considered to be validated nonvoters (2,559 panelists).
Vote choice measures for panelists who did not participate in the 2016 or 2018 surveys
In addition to the comparisons of how different groups in the population voted over time, the current report focuses on how individual panelists’ turnout and vote choice changed over time. A large number of people who participated in the 2020 post-election survey had not been on the panel at the time or did not respond to the 2016 and 2018 post-election surveys at the time they were conducted. For these panelists, their vote choices for 2016 and 2018 were measured after the fact.
For panelists who did not take the 2016 post-election survey, 2016 vote choice was measured on either of two annual profile surveys, depending on when the joined the panel. These were conducted Aug. 20-Oct. 28, 2018, and Aug. 3-16, 2020. In both cases, the vote choice question asked whether panelists voted for Clinton, Trump or someone else.
For panelists who did not take the 2018 post-election survey, 2018 vote choice was measured in the 2020 annual profile survey, conducted Aug. 3-16, 2020. The vote choice question for the U.S. House of Representatives asked whether panelists voted for the Democratic Party’s candidate, for the Republican Party’s candidate, or another candidate. As with the 2016 findings, these were used to supplement the 2018 post-election survey for the analysis of individual-level change.
Weighting for the 2020 post-election survey
The data was weighted in a multistep process that accounts for multiple stages of sampling and nonresponse that occur at different points in the survey process.
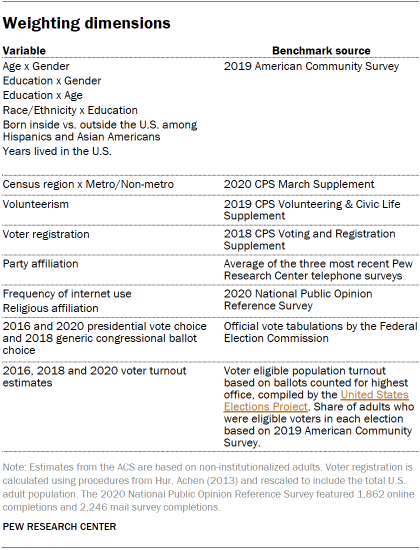
First, each panelist begins with a base weight that reflects their probability of selection for their initial recruitment survey (and the probability of being invited to participate in the panel in cases where only a subsample of respondents were invited). The base weights for panelists recruited in different years are scaled to be proportionate to the effective sample size for all active panelists in their cohort. To correct for nonresponse to the initial recruitment surveys and gradual panel attrition, the base weights for all active panelists are calibrated to align with the population benchmarks identified in the accompanying table (except for vote choice and voter turnout) to create a full-panel weight. For waves in which all active panelists are invited to participate, the wave-specific base weight is identical to the full-panel weight.
The wave-specific base weights for panelists who completed the survey are again calibrated to match the population benchmarks specified above. These weights are trimmed (typically at about the 1st and 99th percentiles) to reduce the loss in precision stemming from variance in the weights. Sampling errors and test of statistical significance take into account the effect of weighting.
A final adjustment was applied to the trimmed weights to ensure that turnout and the popular vote margin for 2016, 2018 and 2020 exactly matched the weighting benchmark.
Variables used to align the 2020 sample to the population are shown in the table. The procedure for weighting the 2018 and 2016 post-election surveys differed slightly from the 2020 survey, principally in the sources of the weighting parameters. Details about these are available in the methodology statements for the 2018 and 2016 surveys.
Sampling errors and tests of statistical significance take into account the effect of weighting. In addition to sampling error, one should bear in mind that question wording and practical difficulties in conducting surveys can introduce error or bias into the findings of opinion polls.


