
American Trends Panel Methodology
The American Trends Panel (ATP), created by Pew Research Center, is a nationally representative panel of randomly selected U.S. adults. This report is based on interviews with respondents to two waves of the panel, one conducted Nov. 29-Dec. 12, 2016, and the other conducted Nov. 7-16, 2018. Panelists participate via self-administered web surveys. Panelists who do not have internet access are provided with a tablet and wireless internet connection. Interviews are conducted in both English and Spanish. At the time of the Nov. 29-Dec. 12, 2016 survey, the panel was managed by Abt, and it is currently being managed by Ipsos, which oversaw data collection for the 2018 survey.
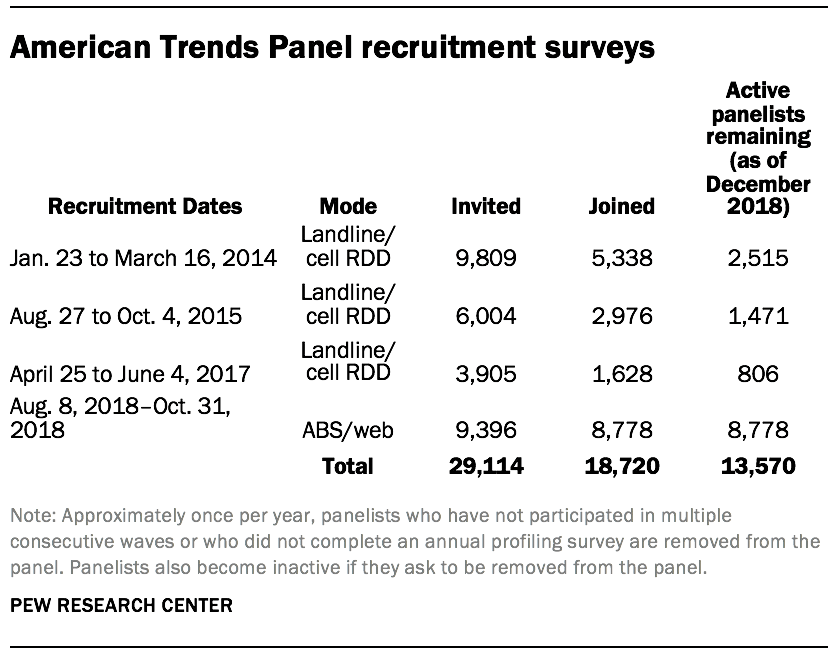
The ATP was created in 2014, with the first cohort of panelists invited to join the panel at the end of a large, national, landline and cellphone random-digit-dial survey that was conducted in both English and Spanish. Two additional recruitments were conducted using the same method in 2015 and 2017, respectively. Across these three surveys, a total of 19,718 adults were invited to join the ATP, of which 9,942 agreed to participate.
In August 2018, the ATP switched from telephone to address-based recruitment. Invitations were sent to a random, address-based sample (ABS) of households selected from the U.S. Postal Service’s Delivery Sequence File. In each household, the adult with the next birthday was asked to go online to complete a survey, at the end of which they were invited to join the panel. For a random half-sample of invitations, households without internet access were instructed to return a postcard. These households were contacted by telephone and sent a tablet if they agreed to participate. A total of 9,396 were invited to join the panel, and 8,778 agreed to join the panel and completed an initial profile survey.
The 2016 survey
The 2016 survey was conducted between Nov. 29 and Dec. 12, 2016, with 4,183 respondents. Noncitizens and panelists who declined to provide their names and thus for whom a match to a voter record could not be attempted were removed from the analysis, leaving 3,770 panelists for analysis. An effort was made to match the panelists to five commercially available databases that contain information about voter registration and turnout for nearly every U.S. adult. In total, 91% of panelists were located in at least one of the files. Panelists who were verified as having voted in at least one of the commercial voter databases were considered to be validated voters (3,014 individuals) and are included in the tabulations here. Panelists for whom no turnout record was located were considered to be nonvoters (756 individuals).
Details about the validation process are discussed in a more general report about commercial voter files published in February 2018, “Commercial Voter Files and the Study of U.S. Politics.”
The 2016 vote choices reported here are based on panelists who said that they voted and were verified as having done so. Those who refused to state their vote choice or who reported voting for a candidate other than Clinton, Trump, Johnson or Stein were excluded from the analysis.
The resulting sample of verified voters mirrored the election results very closely. After the validation was done and the sample was limited to those for whom a turnout record could be located, 48% reported voting for Hillary Clinton and 45% for Donald Trump. By comparison, the official national vote tally was 48% for Clinton and 46% for Trump.
2016 vote choice measures for panelists who did not participate in the 2016 survey
A large number of those who participated in the 2018 survey had not been in the panel in 2016 or had not taken the 2016 post-election survey. For these panelists, their 2016 vote choice was measured in a survey of all panelists conducted Aug. 20 – Oct. 28, 2018. The vote choice question asked whether panelists voted for Clinton, Trump or someone else. These were used to supplement the 2016 post-election survey for the analysis of individual-level change from 2016 to 2018 (e.g., how Trump and Clinton voters voted in 2018). All other 2016 numbers reported here use only the 2016 post-election survey, as found in this report.
The 2018 survey
The 2018 survey was conducted Nov. 7-16, 2018 with 10,640 panelists. Noncitizens, those who refused to answer the vote choice question and panelists who declined to say for whom they voted or provide their names and thus could not be matched to a voter record were removed, leaving 10,144 panelists for analysis. An effort was made to match the panelists to two commercial voter files. Overall, 94% of panelists were matched to at least one file and a turnout record for 2018 was located for 7,585 panelists. Panelists who could not be matched or for whom no 2018 turnout record could be located were considered to be validated nonvoters (2,559 panelists).
Weighting
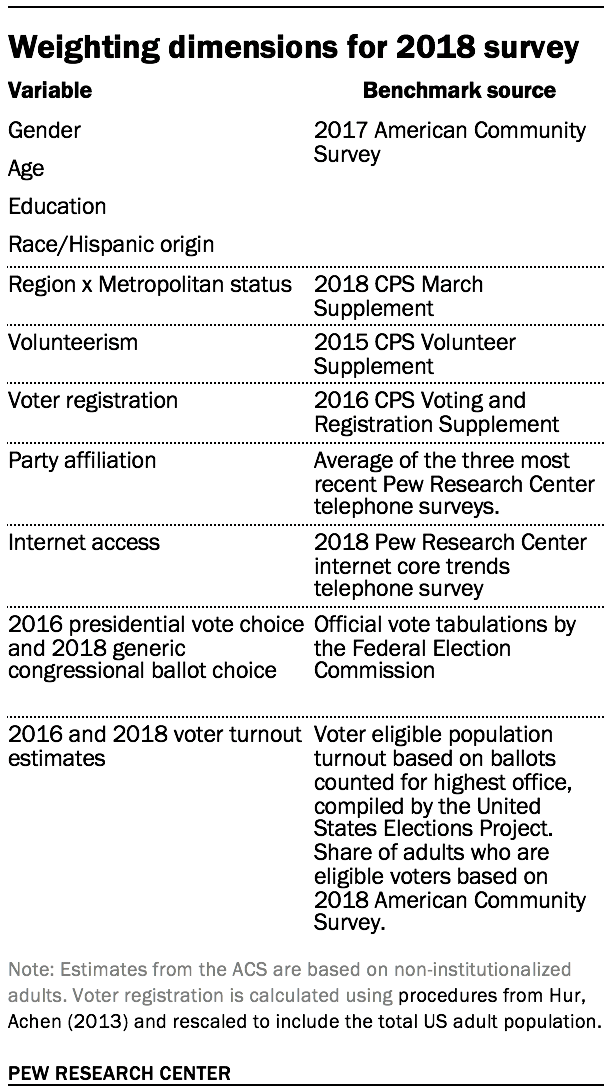
The 2018 ATP data was weighted in a multistep process that begins with a base weight that reflects each panelist’s probability of selection for their initial recruitment. The base weights for panelists recruited in different years are scaled to be proportionate to the effective sample size for all active panelists in their cohort. The next step in the weighting uses an iterative technique that aligns the sample to population benchmarks on the dimensions listed in the accompanying table. These weights are trimmed (typically at about the 1st and 99th percentiles) to reduce the loss in precision stemming from variance in the weights.
Variables used to align the 2018 sample to the population are shown in the table. The procedure for weighting the 2016 post-election survey that provides most of the 2016 estimates differed slightly from the 2018 survey. In 2016, a mild propensity adjustment was applied to the base weights to correct differential panel attrition. It also used a different set of population benchmarks. For the 2016 survey, gender, age, education, race, Hispanic origin and region parameters came from the U.S. Census Bureau’s 2014 American Community Survey. The county-level population density parameter (deciles) came from the 2010 U.S. Decennial Census. The telephone service benchmark came from the July-December 2015 National Health Interview Survey and was projected to 2016. The volunteerism benchmark came from the 2013 Current Population Survey Volunteer Supplement. The party affiliation benchmark was the average of the three most recent Pew Research Center general public telephone surveys. The Internet access benchmark came from the 2015 Pew Survey on Government. Respondents who did not previously have internet access were treated as not having internet access for weighting purposes. The frequency of internet use benchmark was an estimate of daily internet use projected to 2016 from the 2013 Current Population Survey Computer and Internet Use Supplement.
Sampling errors and tests of statistical significance take into account the effect of weighting. Interviews are conducted in both English and Spanish, but the American Trends Panel’s Hispanic sample was predominantly U.S. born and English speaking at the time these surveys were conducted. In addition to sampling error, one should bear in mind that question wording and practical difficulties in conducting surveys can introduce error or bias into the findings of opinion polls.


