
While previous sections of this report have focused on the kinds of systematic biases that may be the largest worry when it comes to public opinion polls, the variance (or precision) of estimates is important as well. Pollsters most commonly talk about precision in terms of the “margin of error” (MOE), which describes how much survey estimates are expected to bounce around if one were to repeat the survey many times identically. For probability-based surveys, the margin of error is usually based on the inherent mathematical properties of random samples. For opt-in samples, this is not possible. Instead, the MOE must be based on modeling assumptions about what other hypothetical samples would look like if the same sampling process were repeated many times. Although the interpretation is largely the same as for probability-based samples, we call it a “modeled” margin of error in order to explicitly acknowledge the reliance on these assumptions.22
This kind of error is in addition to any systematic biases caused by noncoverage, nonresponse or self-selection. For instance, an estimate with a MOE of ±3 percentage points and no bias would usually fall within 3 points of the truth. If the bias were +10 points, the same margin of error would mean that the estimates would usually fall 7 to 13 points higher than the truth – spread out in the same way but centered on the wrong value.
While sample size is usually considered the largest factor in determining the MOE, survey precision is also affected by weighting. Including more variables in adjustment usually leads to a larger MOE, as does throwing away observations when performing matching.
To see how different procedures influence variability, we calculated the modeled MOE for each of the 81 estimates from all 24 benchmark variables and took the average.23 Unweighted, the average margin of error on the benchmarks was ±1.3 percentage points for a sample size of n=2,000. As the sample size increased, the average MOE shrank to a low of ±0.4 points at n=8,000.
The modeled margin of error increases only slightly with the addition of political variables
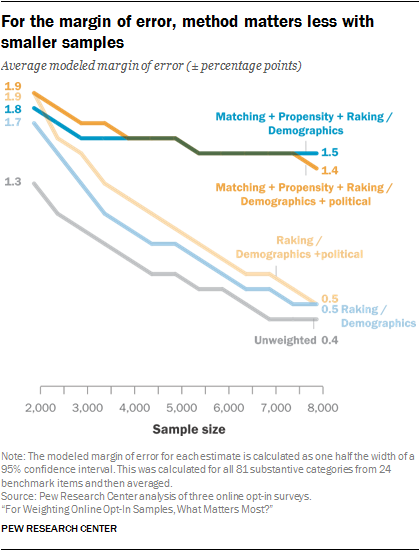
One clear finding is that the use of the political variables in addition to basic demographics has a minimal effect on the margin of error. For all 14 methods and across every sample size, adding political variables to the adjustment procedure never increased the average MOE by more than 0.2 percentage points. In most cases, the difference was even smaller, and in some cases the average MOE was actually smaller with the political variables than without.24 Given this consistent pattern, the remainder of this section will focus only on procedures that adjust on both demographic and political variables.
The loss of precision from matching starts out small but increases quickly with sample size
At smaller sample sizes, the choice of statistical method also has a relatively small effect on the precision of estimates. When n=2,000, the four most effective methods for reducing bias (raking plus the combination methods that use raking as the final stage: P+R, M+R, and M+P+R) all have an average margin of error of ±1.9 percentage points. The other combination method, matching followed by propensity weighting (M+P), is very close, at ±1.8 points. Matching and propensity weighting on their own show somewhat lower MOEs at ±1.6 and ±1.5 percentage points respectively – a modest improvement but unlikely enough to make up for the fact that these methods performed comparatively poorly with respect to bias.
The fact that two methods that retain all of the interviews (raking and P+R) can have the same average MOE as two for which a quarter of the interviews are discarded (M+R and M+P+R) is perhaps surprising, though it serves to highlight the different trade-offs that are involved with each approach. For the former, estimates use the full sample size, but bias reduction is achieved through more variable and extreme weights, which tends to increase the variance of survey estimates. For the latter, estimates use only the matched 1,500 cases, but the weights generated by the subsequent propensity weighting and raking steps are less extreme.
However, as the starting sample size increases, so does the share of interviews that are discarded in the matching process, and the resulting penalty quickly becomes large relative to methods that retain all of the interviews. In this study, by the time the sample size reached 8,000, the methods that retained all interviews (raking and P+R) both had an average MOE of ±0.5. In contrast, the MOE for the two matching methods (M+R and M+P+R) only fell to ±1.4 at that size. Notably, the use of propensity weighting as either the first or second step appeared to have little to no effect on the average margin of error when followed by raking.
For full sample estimates, the benefits of complex statistical methods are situational
If adjustment usually involves a trade-off between reducing systematic error (bias) but increasing random error (variance), what is the best approach? To find the right balance between bias reduction and increased variability, statisticians often use a measure known as root mean squared error (RMSE). RMSE measures the combined effect of both bias and variance on the total amount of error in a survey estimate. Although methods that combine matching with other techniques appear to have a slight edge when it comes to bias reduction, the fact that they also tend to have a larger margin of error means that any gains in accuracy may be overwhelmed by large increases in variance.
To test this, the average RMSE was computed for all 24 benchmark variables and compared across three adjustment methods: raking, because it is most common in practice; the two-stage P+R, which produced slightly less biased estimates than raking on its own with the same margin of error; and the three-stage M+P+R technique, which generally had the lowest estimated bias at the expense of discarding interviews. For brevity, the discussion is restricted to the cases where both demographic and political variables are used, although the general pattern is the same.
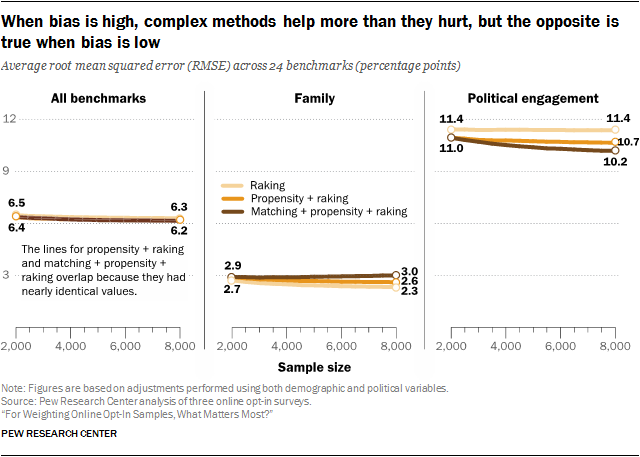
The study found that, averaged over all 24 benchmark variables, P+R and M+P+R are indistinguishable from one another at every sample size – both having an average RMSE between 6.4 and 6.2 percentage points at sizes n=2,000 and n=8,000 respectively. Simply put, in the aggregate, the total amount of error was the same for both methods. On average, M+P+R produced estimates with slightly more variability than P+R, but made up for it through lower bias. Raking was only slightly higher, going from 6.5 at n=2,000 to 6.3 at n=8,000 – a difference of only 0.2 points.
Although these methods were all roughly equivalent in the aggregate, there were important differences for some survey topics depending on their level of bias prior to adjustment. For most topics, the pattern was consistent with what we saw across all variables. However, for two topics in particular, a different pattern emerged. For questions related to family, raking produced the lowest RMSE, followed by P+R, with M+P+R appreciably higher than the others. Before weighting, the family-related variables had the lowest average bias out of all of the topics, and weighting had little effect. Consequently, none of these estimates saw much in the way of bias reduction, no matter what method was used. With raking and P+R, there is at least the benefit of lower variance at larger sample sizes, although P+R does slightly worse due to its greater complexity. With M+P+R, the discarded interviews are largely wasted, because there is no bias reduction to offset the greater variability.
The opposite is true for political engagement, which had the highest estimated bias prior to adjustment. Here, the gains from more effective matching at larger starting sample sizes, even after discarding 6,500 out of 8,000 interviews, outweighed the benefits of lower variability that come with methods that use the full sample.
Altogether, these findings suggest that the greater efficacy of complex statistical techniques is highly situational. The three-stage M+P+R method produced real improvements in the total error for the political engagement benchmarks, even accounting for a substantial penalty in terms of variability. Even so, the estimated bias for these measures was high to begin with, and even the most effective adjustment left a great deal of bias remaining. When bias is low, the added complexity simply increases the total level of error relative to simpler methods, as was the case for the benchmarks related to family composition. For most other topics the differences were minimal.


