
A growing share of polling is conducted with online opt-in samples.1 This trend has raised some concern within the industry because, while low participation rates pose a challenge for all surveys, the online opt-in variety face additional hurdles. By definition they do not cover the more than 10% of Americans who don’t use the internet. The fact that potential respondents are self-selected means that there is still substantial risk that these samples will not resemble the larger population. To compensate for these challenges, researchers have employed a variety of statistical techniques, such as raking, propensity weighting and matching, to adjust samples so that they more closely match the population on a chosen set of dimensions. Researchers working with online opt-in samples must make a great many decisions when it comes to weighting. What factors should guide these decisions, and which ones are most consequential for data quality?
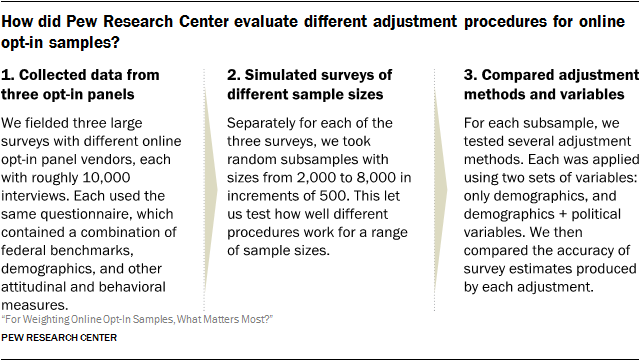
A new Pew Research Center study adds to the survey field’s broader efforts to shed light on these questions. The study was based on over 30,000 online opt-in panel interviews conducted in June and July of 2016, with three vendors, and focuses on national (as opposed to state or local level) estimates. We evaluated three different weighting techniques, raking, propensity weighting and matching, both on their own and in combination. Every method was applied using two sets of adjustment variables: basic demographics (age, sex, race and ethnicity, education, and geographic region), and a more extensive set that included both demographics and a set of variables associated with political attitudes and engagement (voter registration, political party affiliation, ideology and identification as an evangelical Christian). Each procedure was performed on simulated samples ranging in size from n=2,000 to n=8,000.
The procedures were primarily appraised according to how well they reduced bias on estimates from 24 benchmark questions drawn from high-quality federal surveys.2 They were also compared in terms of the variability of weighted estimates, accuracy among demographic subgroups, and their effect on a number of attitudinal measures of public opinion.
Among the key findings:
- Even the most effective adjustment procedures were unable to remove most of the bias. The study tested a variety of elaborate weighting adjustments to online opt-in surveys with sample sizes as large as 8,000 interviews. Across all of these scenarios, none of the evaluated procedures reduced the average estimated bias across 24 benchmarks below 6 percentage points – down from 8.4 points unweighted. This means that even the most effective adjustment strategy was only able to remove about 30% of the original bias.
- When it comes to accuracy, choosing the right variables for weighting is more important than choosing the right statistical method.3 Adding a set of politically focused variables to the weighting adjustment reduced the average estimated bias by an additional 1.4 percentage points relative to adjusting only on basic demographics (e.g., age, education, race). While that might seem small, a difference of 1.4 points in the average implies that about 36 percentage points of bias were removed overall, but spread out across all 24 variables. Benchmarks most strongly associated with the political adjustment variables saw the largest improvements. In contrast, the use of more complex statistical methods never reduced the average estimated bias by more than 0.3 points beyond what was achieved with raking, the most basic statistical method evaluated.4
- The benefits of adding political variables to adjustment differ by survey topic. Perhaps not surprisingly, benchmarks related to political engagement saw the largest improvement with the addition of political adjustment variables. Unweighted, these benchmarks had an average estimated bias of 22.3 percentage points, more than any other topic. While demographic weighting reduced the average bias by an average of 2.9 points, the effect of adding political adjustment variables was four times as large, reducing bias by 11.7 points and cutting the average estimated bias nearly in half (to 10.6 percentage points). Benchmarks pertaining to civic engagement and technology use also benefited disproportionately from political adjustment variables, though to a lesser degree. For benchmarks related to family composition and other personal characteristics, variable selection made little difference and proved mildly detrimental for questions of personal finance.
- The most basic weighting method (raking) performs nearly as well as more elaborate techniques based on matching. When weighting on both demographic and political variables, methods based on matching resulted in the lowest average bias across the full set of 24 benchmarks – either in combination with raking at smaller sample sizes (n=less than 4,000) or on its own when the sample size was larger. Even so, procedures that only used raking (the least complex method evaluated) performed nearly as well, coming in 0.1 to 0.3 points behind the most effective method, depending on sample size. For benchmarks related to political engagement, the benefits from the more complex approach are somewhat larger than for other topics, doing between 0.5 and 1.2 points better than raking depending on sample size, but nowhere near the magnitude of improvement derived from weighting on political variables in addition to demographics. If the data necessary to perform matching are readily available and the process can be made routine, then a combination of matching and other methods like raking is likely worthwhile, providing incremental but real improvements.5 In other situations, such marginal improvements may not be worth the additional statistical labor.
- Very large sample sizes do not fix the shortcomings of online opt-in samples. While an online opt-in survey with 8,000 interviews may sound more impressive than one with 2,000, this study finds virtually no difference in accuracy. When adjusting on both demographic and political variables, the most effective procedure at n=8,000 was only 0.2 points better than the most effective procedure at n=2,000. While a large sample size may reduce the variability of estimates (i.e., the modeled margin of error), this is of little help from a “total survey error” perspective. For example, raking on demographic and political variables, the average modeled margin of error across all 24 benchmark variables is ±1.8 percentage points when n=2,000 and ±0.5 points when n=8,000, but the average bias holds steady at 6.3 points. As the sample size increases, estimates become less dispersed and more tightly clustered, but they are often more tightly clustered around the wrong (biased) value.
- Adjusting on political variables – not just demographics – made key public opinion estimates more Republican. A prior Pew Research Center study found that online opt-in samples tended to overrepresent Democrats compared with traditional, live telephone random-digit-dial (RDD) samples. In this study, demographic weighting produced almost no change in this distribution or in measures of partisan attitudes such as approval of then-President Barack Obama, views on the Affordable Care Act and 2016 presidential vote. Adding political variables (which include party identification) to the weighting pushes these estimates several points in a Republican direction. For example, support for the Affordable Care Act dropped about 5 percentage points (from 51% to 46%) when the political variables were added to a raking adjustment that initially just used demographics.
The weighting procedures tested in this report represent only a small fraction of the many possible approaches to weighting opt-in survey data. There are a host of different ways to implement matching and propensity weighting, as well as a variety of similar alternatives to raking (collectively known as calibration methods). We also did not evaluate methods such as multilevel regression and poststratification, which require a separate statistical model for every outcome variable. Add to this the innumerable combinations of variables that could be used in place of those examined here, and it is clear that there is no shortage of alternative protocols that might have produced different results.
But whatever method one might use, successfully correcting bias in opt-in samples requires having the right adjustment variables. What’s more, for at least many of the topics examined here, the “right” adjustment variables include more than the standard set of core demographics. While there can be real, if incremental, benefits from using more sophisticated methods in producing survey estimates, the fact that there was virtually no differentiation between the methods when only demographics were used implies that the use of such methods should not be taken as an indicator of survey accuracy in and of itself. A careful consideration of the factors that differentiate the sample from the population and their association with the survey topic is far more important.


